
Introduction
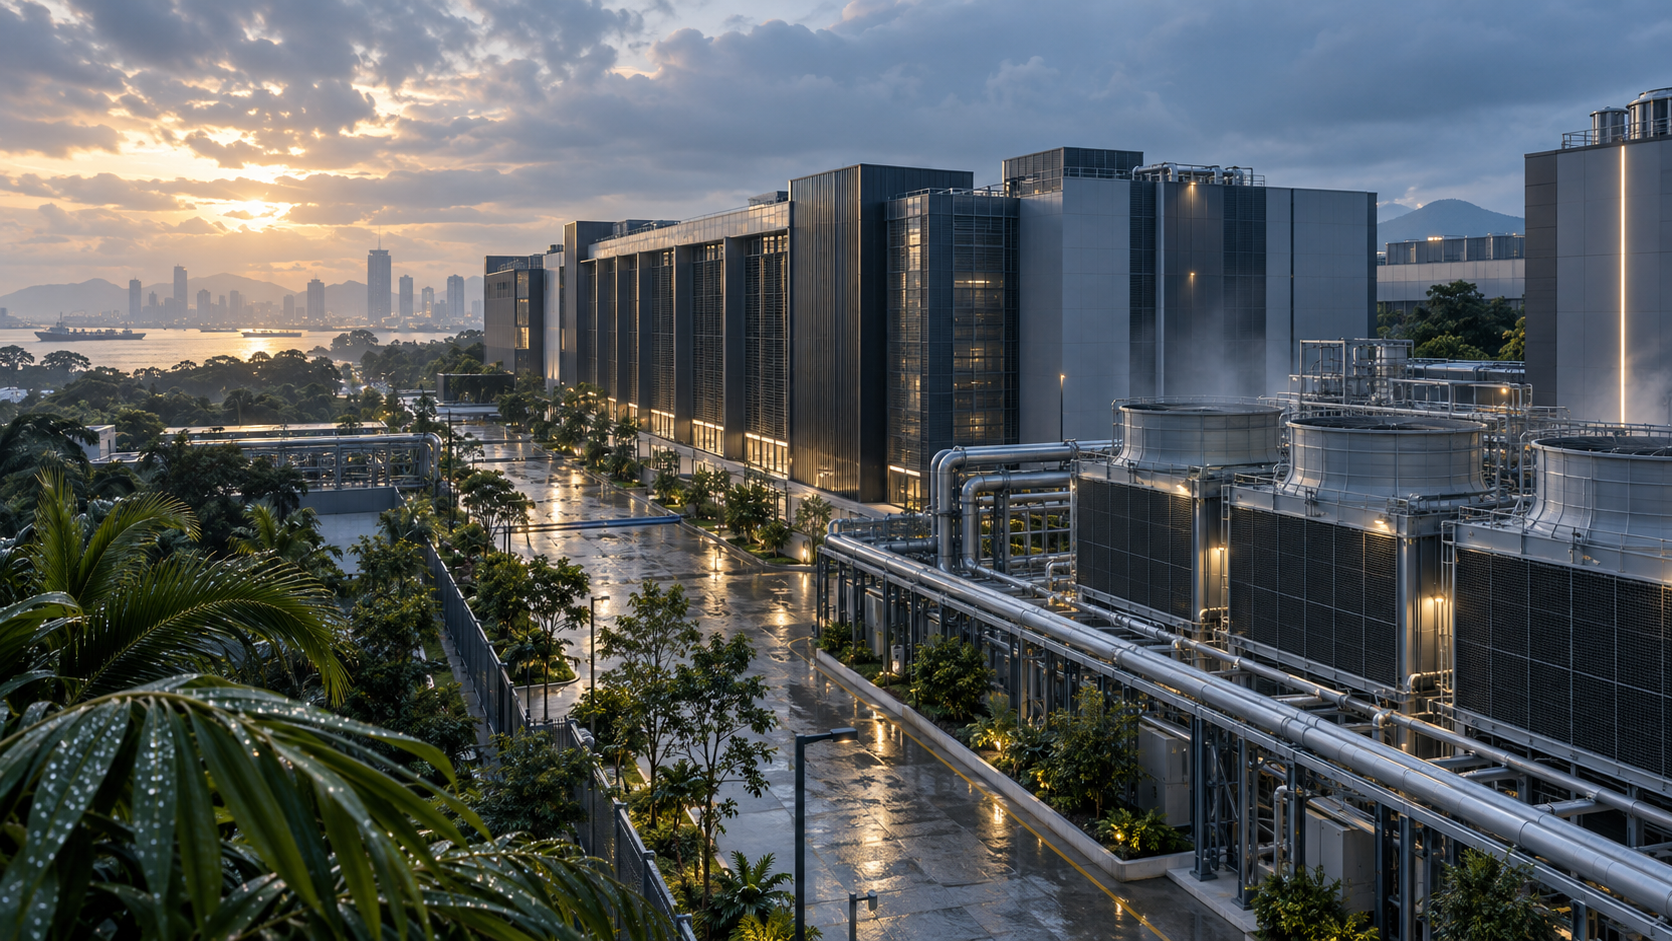
Data centres in Southeast Asia combine long-duration infrastructure, technology-dependent operating assets and service businesses. Heat rejection occurs in environments where high dry-bulb temperature, high moisture content and monsoon conditions can persist. Cooling systems often consume more energy and have fewer hours of air-side economization than comparable assets in temperate markets. Coastal air, urban pollutants, flooding, water constraints and grid conditions can add site-specific risks. An acquisition model that relies on nameplate megawatts and annual Power Usage Effectiveness can miss the cash effects of these conditions. [1][18][20]
The buyer's task is to determine how much capacity can be sold and operated within contractual service levels, what it costs to sustain that performance, and which capital projects are required after closing. The analysis needs engineering, commercial, financial, environmental and legal evidence. Every adjustment should trace to a meter, contract, maintenance record, independent test, regulatory requirement or transparent scenario assumption.
1. Define the acquisition perimeter
Identify the legal entities, sites, land interests, buildings, electrical infrastructure, cooling plant, information-technology equipment, customer contracts, utility agreements, licences, employees and intellectual property included in the transaction. A share purchase may transfer historical liabilities and site permits. An asset purchase may require consent, novation or fresh licensing. The diligence perimeter must match the legal structure being valued.
Separate owner-operated, leased, joint-venture and managed assets. Record which party owns chillers, cooling towers, pumps, cooling distribution units, generators, transformers, controls and customer fitout. Determine whether common infrastructure supports excluded assets or third parties. Shared plant can create cost allocations and operating dependencies that remain after closing.
Set the valuation date, measurement period and weather period. Define installed, commissioned, available, contracted, utilized and billable capacity. These measures should never be treated as interchangeable. The buyer should state the evidence required before capacity is included in price or synergy calculations.
2. Establish the decision the evidence must support
Acquisition diligence should answer a defined decision: proceed, reprice, restructure, require remediation, defer closing or withdraw. Translate that decision into measurable questions. The core questions concern reliable sellable capacity, normalized margin, immediate capex, sustaining capex, outage probability, customer concentration, utility continuity and change-of-control effects.
Assign an owner to each evidence stream. Mechanical engineers assess thermal performance and asset condition. Electrical engineers test power and cooling interaction. Commercial reviewers reconcile service levels and customer acceptance. Financial reviewers rebuild the cost base. Environmental and legal advisers test permits, water, refrigerants, discharge, insurance and enforcement. The investment team integrates the findings into value and transaction terms.
Use an evidence hierarchy. Calibrated interval data and witnessed tests provide stronger support than annual summaries. Executed contracts provide stronger support than pipeline presentations. Paid invoices and bank records provide stronger support than management estimates. Record gaps explicitly and attach a consequence to each unresolved item.
3. Reconstruct the external climate exposure
Obtain at least three years of hourly outdoor dry-bulb temperature, relative humidity, dew point and rainfall data for each site where available. Compare site sensors with an independent meteorological source. Map monsoon seasons, hottest hours, highest dew-point periods and simultaneous heat-and-humidity events. Annual averages conceal the conditions that drive cooling peaks and moisture control.
Create bins for dry-bulb temperature and dew point, then reconcile cooling power, water consumption and alarms within each bin. The analysis should distinguish stable weather response from operational anomalies. A facility that performs well during lower-load months may face a different efficiency and redundancy position during peak ambient conditions.
Review projected climate exposure as a scenario rather than a precise forecast. The World Meteorological Organization reports rising heat and material extreme-weather effects across Asia. The buyer should test whether current design margins, flood protection and utility arrangements remain adequate across the investment horizon. [21]
4. Use dew point to test moisture control
Relative humidity changes with air temperature, while dew point tracks moisture content more consistently. ASHRAE guidance therefore uses dew point within recommended and allowable environmental envelopes. The buyer should examine supply-air, return-air and rack-inlet temperature together with dew point and surface temperatures. Condensation risk arises when a surface falls below the local dew point. [18]
Request trend data for humidifiers, dehumidification coils, chilled-water temperature, condensate drains and underfloor conditions. Identify extended excursions, rapid changes and control hunting. Check whether alarm thresholds reflect equipment class and customer requirements. A stable annual average can coexist with repeated short excursions that affect service risk.
Test moisture control during plant changeover, maintenance, low load and restart after outage. These states can create different airflow and coil conditions from normal operation. Inspect pipe insulation, valve bodies, floor penetrations and cold surfaces for staining, corrosion or historic condensation evidence.
5. Distinguish outdoor conditions from data-hall conditions
Outdoor heat and humidity enter the asset through ventilation, pressurization, door opening, loading activity, envelope leakage and maintenance practices. Measure outside-air volume and the energy required to condition it. Verify that pressurization targets, vestibules, door seals and loading procedures operate as designed.
Map hall-level conditions by rack inlet rather than relying on a small number of room sensors. Averages can hide hotspots, cold-air bypass and recirculation. Review sensor density, placement, calibration history and replacement records. Compare rack inlet conditions with equipment classes and customer contracts.
Separate design conditions from operating set points. A plant may be capable of operating at higher supply temperature while customer requirements or legacy equipment impose a lower set point. The buyer should value the asset using the conditions that can be contractually and technically achieved.
6. Assess design day and coincident peak demand
Reconstruct the coincident peak of information-technology load, cooling demand, humidity control, pumps, fans and auxiliary equipment. The electrical peak may occur when customer load and adverse weather overlap. Demand charges, transformer limits and generator loading can therefore depend on the cooling system as much as the servers.
Check the engineering design-day assumptions against recent site data. Record dry-bulb temperature, wet-bulb temperature, dew point, rainfall and wind conditions. Review whether plant redundancy remains available at that point. A nominal N+1 configuration may lose redundancy when all operating units are required to meet peak load.
Test the effect of future rack density, contracted expansions and degraded equipment performance. Capacity should be reduced where cooling, power or redundancy limits arise before the stated information-technology megawatt rating.
7. Normalize PUE and WUE
Power Usage Effectiveness is total facility energy divided by information-technology equipment energy. Water Usage Effectiveness measures water use against information-technology energy. Both metrics require aligned boundaries, calibrated meters and a stated period. ISO standards provide definitions, while local schemes may add thresholds or reporting conditions. [22][23]
Recalculate monthly and hourly metrics from source data. Verify whether offices, lighting, network rooms, district cooling, tenant equipment, onsite generation and shared plant sit inside the reported boundary. Compare design PUE, contracted PUE and measured PUE. Investigate missing data and manual overrides.
Normalize for utilization and weather before comparing sites. Cooling plants can operate inefficiently at low load. A better annual PUE may reflect higher utilization rather than superior equipment. Water use should be separated into cooling, humidification, domestic, cleaning and other processes.
8. Inspect building management and controls data
Obtain native exports from the building-management, electrical-power-monitoring, data-centre-infrastructure-management and maintenance systems. Reports prepared for the sale may omit alarms, overrides or incomplete tags. Retain timestamps, units, sensor identifiers and quality flags.
Identify points that are manually forced, disabled or substituted. Review alarm frequency, duration, acknowledgement and closure. Compare control sequences with commissioning documents and actual trend behavior. Fixed-speed operation, simultaneous heating and cooling, unstable valve control and poor plant staging can create recurring cost.
Assess data retention and access after closing. Proprietary control systems may require licences, vendor credentials or cloud subscriptions. Confirm source-code, configuration and administrative rights where relevant. A buyer should treat inaccessible controls as an operational and transition risk.
9. Test sensor integrity and calibration
Inventory temperature, humidity, dew-point, flow, pressure, power and water meters. Record make, model, location, range, accuracy, calibration date and data owner. Check whether critical calculations depend on a single point without redundancy or plausibility checks.
Conduct sample calibration and cross-checks. Portable reference instruments can test rack-inlet conditions. Temporary flow meters can test chilled-water or condenser-water readings. Utility invoices can reconcile electricity and water totals. Material unexplained differences should remain open until resolved.
Quantify the financial effect of measurement uncertainty. A PUE adjustment of a few hundredths can change annual power cost at scale. Faulty flow measurement can misstate cooling capacity and efficiency. The valuation model should use a range when the measurement system cannot support a single estimate.
10. Reconcile equipment classes and customer obligations
List the environmental class, inlet-temperature range, humidity range and cooling requirement for material customer equipment. ASHRAE classes provide a common framework, while manufacturer warranty conditions and customer contracts govern the target asset. High-density equipment may use narrower or different conditions from general-purpose servers. [18][19]
Map each customer hall to the equipment class and agreed service levels. Review who approves set-point changes and who bears efficiency costs. A buyer should not assume that a tropical operating standard can be implemented across legacy customer estates without equipment and contract review.
Identify contractual remedies for environmental excursions, including service credits, termination rights and indemnities. Compare the contractual measurement point with the facility sensors. Misaligned definitions can create disputes even when the plant performs within its own design limits.
11. Identify contamination and corrosion exposure
High humidity can increase corrosion risk where airborne contaminants or salts are present. ASHRAE guidance notes the relationship between moisture, gaseous contamination and corrosion of copper and silver. Coastal exposure, nearby industry, construction dust and traffic pollution should therefore enter site diligence. [17][18]
Review particulate and gaseous-contamination monitoring, filter classes, replacement records and corrosion coupons where used. Inspect printed circuit boards, electrical cabinets, busbars, heat exchangers and outdoor coils for deposits or corrosion. Record whether equipment warranties impose environmental limits.
Estimate cleaning, filtration, coating, replacement and monitoring costs. Treat recurring contamination as an operating condition rather than a one-time defect. A buyer may need a capex reserve and revised maintenance plan where current controls are inadequate.
12. Inspect condensation and water-ingress history
Review incident logs for condensation, roof leaks, pipe failures, drain blockages, flooding and water detection. Trace each event to cause, affected equipment, downtime, remediation and insurance recovery. Look for repeated incidents around the same plant or season.
Inspect insulation continuity on cold pipes, valves and cooling distribution units. Check vapour barriers, drain pans, slopes, traps and condensate pumps. Review leak-detection coverage and alarm response. A visual survey should include raised floors, ceiling voids, service corridors and loading areas.
Translate exposure into failure scenarios. A small recurring leak can affect customer confidence and maintenance cost. A common-mode pipe failure can create major downtime. The transaction response may include repair before closing, escrow, specific indemnity or a price adjustment.
13. Map the complete thermal chain
Follow heat from processor and rack to room air or coolant, cooling distribution unit, facility-water loop, chiller or dry cooler, heat exchanger and final heat rejection. Record temperature, flow, pressure and capacity at every interface. Identify ownership and warranty boundaries.
Calculate available thermal capacity after derating for ambient conditions, fouling, redundancy and expected equipment degradation. Compare the result with installed and contracted information-technology load. Shared headers, undersized pumps or control limits can constrain capacity before the main chillers reach nameplate output.
Review interface documents for liquid-cooled racks. Coolant chemistry, materials compatibility, filtration, leak detection, pressure control and commissioning responsibility require explicit ownership. A missing interface obligation can create both technical and contractual risk.
14. Evaluate air management
Inspect hot-aisle or cold-aisle containment, blanking panels, cable openings, floor tiles, rack placement and return-air paths. Use Computational Fluid Dynamics selectively to test high-density or irregular halls, then validate the model against measured temperatures and airflow.
Calculate Return Temperature Index or another documented air-management measure where suitable. The Singapore Green Mark for Data Centres recognizes air management and higher supply-air temperatures within its efficiency framework. The standard requires measurement across meaningful load conditions rather than a single design point. [4]
Estimate the cost and outage requirements for corrective work. Many airflow improvements are modest capex items, while major containment or distribution changes can disrupt customers. Reflect implementation timing in the operating model.
15. Assess liquid cooling readiness
Identify current and planned rack densities, customer equipment roadmaps and liquid-cooling commitments. Review available floor loading, pipe routes, water quality, cooling distribution-unit space, electrical capacity and maintenance access. Confirm whether the facility can support direct-to-chip, rear-door or immersion systems.
Apply ASHRAE facility-water classes and manufacturer limits to the proposed design. Warmer facility-water temperatures may reduce mechanical refrigeration, subject to equipment qualification and local ambient conditions. The buyer should model annual hours and peak conditions rather than infer savings from a class label. [19]
Separate base-building work from customer-specific fitout. Determine who funds and owns cooling distribution units, manifolds, hoses, fluids and controls. Contract terms should address acceptance, leaks, warranty, relocation and refresh.
16. Test chilled-water plant performance
Rebuild plant efficiency across 25, 50, 75 and 100 per cent load where data permit. Include chillers, condenser pumps, chilled-water pumps, cooling towers, air handlers and humidity-control equipment. The GMDC 2024 framework uses total cooling-system efficiency and considers part-load conditions. [4]
Review sequencing, minimum flow, delta temperature, fouling, approach temperatures and variable-speed operation. Compare design curves with operating trends. Poor staging can create significant cost during low utilization, while fouled heat exchangers can reduce peak capacity.
Assess refrigerant type, charge, leak history, regulatory exposure, service availability and replacement plan. Include major overhaul timing and long-lead components in sustaining capex.
17. Evaluate heat rejection and water dependence
Identify whether the site uses cooling towers, dry coolers, adiabatic systems, district cooling, seawater or another heat-rejection method. Map water source, treatment, storage, blowdown, discharge and contingency supply. Separate withdrawal from consumption.
Singapore's published sector benchmark reports a median data-centre water-efficiency indicator of 2.1 cubic metres per MWh. Malaysia's sustainable data-centre guideline recommends design Water Usage Effectiveness of 2.2 cubic metres per MWh or lower and improvement toward 2.0 over ten years for relevant incentive applications. These values are reference points. Asset performance depends on boundary, climate, design and load. [5][10]
Model water and electricity together. Dry operation may reduce water consumption while increasing peak electrical demand. Evaporative operation may improve energy efficiency while increasing water exposure. Value the combined cost, resilience and regulatory position.
18. Test redundancy and failure modes
Draw single-line diagrams for power and thermal systems. Identify N, N+1, 2N and shared components under normal, maintenance and failure states. Confirm whether stated redundancy survives peak ambient conditions and contracted load.
Review integrated systems tests, black-building tests, utility failures, generator operation, chiller failure, pump failure, control failure and network loss. Confirm automatic sequences and recovery time. Witness selected tests when the transaction timetable allows.
Build a failure-mode register with probability, consequence, detection, mitigation and residual risk. Common-mode controls, headers, water sources or software can defeat component-level redundancy. Link each critical risk to capex, insurance and transaction protection.
19. Reconcile power and cooling constraints
Calculate the power available to information-technology load after cooling and auxiliary consumption at adverse ambient conditions. A fixed utility connection can support fewer sellable megawatts when cooling demand rises. The buyer should therefore value reliable net information-technology capacity.
Review contracted utility capacity, connection rights, demand charges, power quality, curtailment, renewable-energy arrangements and expansion milestones. Thailand's policy updates and investment facilitation measures identify power readiness and clean-energy access as material constraints for data-centre projects. [12][13]
Test backup generation under full cooling load. Verify fuel storage, refuelling, emissions permits and maintenance. Cooling must remain available during grid interruption and transition to backup power.
20. Review maintenance quality and asset condition
Reconcile preventive-maintenance schedules, completed work orders, condition monitoring, failure logs, vendor reports and spare-parts inventories. Compare maintenance expenditure with the manufacturer's requirements and the physical condition observed.
Identify deferred overhauls, temporary repairs, obsolete controls and unsupported equipment. Estimate the cost and outage window for remediation. Separate immediate catch-up capex from recurring sustaining capex and growth capex.
Review staff capability, shift coverage, escalation procedures and vendor dependence. An asset can have modern equipment and weak operating controls. Retention and transition arrangements should protect critical technical knowledge.
21. Build the lifecycle capex schedule
Create an asset-by-asset schedule for remaining useful life, overhaul, replacement, efficiency upgrade and expansion. Include chillers, towers, pumps, air handlers, cooling distribution units, controls, sensors, water treatment, generators, switchgear and batteries.
Estimate installed cost, lead time, outage requirement and inflation or foreign-currency exposure. Avoid double counting capex already reflected in maintenance provisions or seller commitments. Apply probability weightings only when scenarios are clearly defined.
The valuation model should show immediate remediation, committed expansion, sustaining capex and optional enhancement separately. These categories affect enterprise value, financing and returns differently.
22. Test permits and change of control
Prepare a country and site permit register covering land, construction, electricity, water, discharge, fire, environmental, refrigerant, telecoms, data protection and operating approvals. Record expiry, renewal, conditions, reporting and enforcement history.
Identify change-of-control, assignment and ownership restrictions. Singapore, Malaysia and Thailand each use different combinations of infrastructure policy, investment incentives and operating standards. The buyer should obtain local legal advice rather than apply a regional assumption. [2][9][12]
Confirm whether tax incentives, land rights, utility allocations and green certifications survive the transaction. Include required consents as conditions precedent or clearly priced risks.
23. Reconcile customer contracts with physical capacity
Map each customer contract to halls, racks, power density, cooling mode, reserved capacity, minimum commitment, ramp schedule and service level. Compare contractual capacity with commissioned and available capacity. Identify overlapping reservations or unbuilt commitments.
Review pass-through mechanisms for electricity, water, carbon and regulatory cost. Determine whether cooling inefficiency remains with the operator or can be recovered. Test indexation, currency, termination and renewal.
Validate billing against meter data and cash receipts. A megawatt under contract is not necessarily billable or collected. The valuation model should use an evidence-weighted capacity-to-cash bridge.
24. Quantify service credits and outage exposure
Extract availability, temperature, humidity and response-time obligations from customer contracts. Reconcile incidents with issued credits, disputed claims and contractual caps. Check whether the seller records credits consistently in revenue or operating cost.
Estimate an expected annual service-credit provision from historical frequency, contract terms and corrected risk. Model severe but plausible events separately. Review customer termination rights and concentration of exposure.
Insurance does not replace service obligations. Confirm coverage, exclusions, deductibles, sublimits, notification and business-interruption basis. Treat uninsured contractual liabilities as part of the transaction risk.
25. Review insurance and loss history
Obtain property, machinery-breakdown, cyber, environmental, liability and business-interruption policies. Review declared values, indemnity periods, deductibles and exclusions for flood, corrosion, gradual deterioration and utility interruption.
Reconcile claims, near misses and uninsured losses with maintenance and incident records. Repeated small events may reveal weak controls even where claims were below deductible.
Assess whether the buyer can place equivalent coverage and whether premiums or terms will change after closing. Include the normalized cost in EBITDA and any coverage gap in transaction protections.
26. Apply country and regulatory context
Singapore provides the region's most developed tropical data-centre standards, including SS 697:2023, SS 715:2025 and GMDC 2024. Malaysia's sustainable-development guideline links incentive eligibility with efficiency, carbon and water measures. Thailand has revised promotion conditions and emphasizes Power Usage Effectiveness, advanced computing and domestic economic contribution. Indonesia, the Philippines and Viet Nam require site-specific review of utilities, data rules, permits and investment conditions. [2][3][4][9][12]
Use these frameworks as diligence inputs. Confirm applicability, transitional arrangements and enforcement with local advisers. Certification can support evidence, while measured operation and contractual compliance remain decisive.
Maintain separate country cases in the valuation model. Tariffs, taxes, utility availability, water rules, foreign ownership and currency exposure should not be blended into a single regional average.
27. Review cyber and data governance dependencies
Cooling, electrical and security systems increasingly depend on networked controls, remote vendors and cloud services. Inventory control-system architecture, remote access, privileged accounts, patching, backup, incident response and vendor support. Confirm the buyer will receive administrative credentials and configurations.
Review applicable data-localization, privacy and critical-infrastructure obligations. Customer contracts may impose additional controls. Cyber diligence should cover both information technology and operational technology.
Model the operational consequence of control-system loss. A secure manual operating mode, tested backups and clear vendor support can reduce recovery risk. Include remediation capex and transition services where needed.
28. Test physical climate and flood resilience
Review elevation, drainage, flood maps, roof design, wind exposure, lightning protection and access routes. Tropical rainfall can interrupt utilities and logistics even when the data hall remains dry. Assess pumps, barriers, drainage maintenance and emergency procedures.
Map critical plant by elevation and flood pathway. Basements and ground-level switchgear, generators, fuel systems, pumps and network entries may create concentrated exposure. Compare design basis with observed events and updated climate data.
Translate physical risk into capex, downtime scenarios, insurance and valuation. Use local engineering and climate evidence. Avoid treating a regional climate projection as a site-specific forecast.
29. Build normalized EBITDA
Start with audited revenue and operating cost, then reconcile monthly management accounts, invoices, meters and customer data. Separate recurring operations from construction, fitout, pass-through revenue, grants, insurance recoveries and one-time items.
Normalize power, water, maintenance, software, staffing, insurance and service credits using the verified operating baseline. Add the recurring cost of required controls and monitoring. Avoid adding savings that require unapproved capex or customer consent.
Create a bridge from reported EBITDA to adjusted EBITDA with evidence for every line. Distinguish run-rate adjustments, pro forma adjustments and buyer synergies. The base valuation should use the cash flow available under current contracts and the costed remediation plan.
30. Build the valuation bridge
Apply an enterprise-value method appropriate to the asset and transaction, then test it with discounted cash flow and replacement or development-cost evidence. Use adjusted EBITDA, reliable sellable capacity and contracted cash flow consistently.
Deduct immediate remediation, unfunded committed capex, debt-like liabilities, customer refunds and working-capital deficits. Price uncertainty through ranges, escrows, holdbacks or contingent consideration rather than unsupported precision.
Show sensitivity to utilization, realized price, power cost, cooling efficiency, service credits, capex and valuation multiple. The investment committee should see which technical findings drive value.
31. Apply the hypothetical acquisition case
The hypothetical target comprises three Southeast Asian sites with 24 MW of installed information-technology capacity, 21 MW of commissioned capacity and 17 MW of average utilized load. Reported annual revenue is USD 78 million and reported EBITDA is USD 32 million.
Diligence identifies USD 18 million of immediate cooling, controls and water-system capex. Weather and utilization normalization add USD 2.6 million of annual operating cost. Historical incidents and customer terms support a USD 1.4 million expected annual service-credit provision. Adjusted EBITDA is therefore USD 28 million.
At 14.0 times reported EBITDA, headline enterprise value is USD 448 million. Applying 12.5 times to adjusted EBITDA gives USD 350 million. Deducting immediate capex produces an illustrative adjusted enterprise value of USD 332 million. All figures are wholly hypothetical.
32. Run operating and climate scenarios
Model separate cases for higher ambient temperature, higher dew point, lower utilization, customer density increase, power-tariff increase, water restriction, chiller failure, control failure and delayed retrofit. Combine correlated risks in an adverse case.
The hypothetical central case uses USD 28 million of adjusted EBITDA and USD 18 million of immediate capex. An adverse case assumes USD 25 million of EBITDA, USD 27 million of capex and a 11.5 times multiple, producing an illustrative enterprise value after immediate capex of USD 260.5 million.
State which actions can reduce each downside. Temporary liquidity does not cure inadequate thermal capacity. Customer repricing does not cure a permit gap. Match each risk with an engineering, commercial, financing or contractual response.
33. Determine purchase-price and closing adjustments
Define treatment of cash, debt, leases, customer deposits, deferred revenue, unpaid capex, vendor claims, service credits and working capital. Cooling retrofit commitments and outstanding purchase orders may create debt-like items.
Use a locked-box or completion-accounts mechanism consistent with available records and transaction risk. Protect against value leakage and unusual maintenance deferral between signing and closing.
Set evidence-based closing conditions for utility consent, customer consent, insurance, key permits, critical repairs and access to control systems. Allocate residual uncertainty through escrow, holdback or contingent consideration.
34. Convert diligence into transaction protections
Draft representations around capacity, environmental conditions, meter data, maintenance, incidents, service credits, permits, utility rights, water use, refrigerants, insurance and customer contracts. Use specific disclosure schedules and defined measurement periods.
Consider indemnities for known defects, regulatory non-compliance, undisclosed incidents and pre-closing customer claims. Define survival, caps, baskets, security and claims procedures with legal advisers.
For performance uncertainty, use measurable earnout or price-adjustment criteria. Avoid metrics controlled solely by the buyer after closing. Conditions should specify data sources, accounting policies, sensor integrity and dispute resolution.
35. Plan transition services and vendor continuity
Identify systems, licences, vendor contracts, staff and operating procedures that will not transfer automatically. Prepare transition-service agreements for monitoring, billing, customer support, procurement and specialist maintenance where required.
Secure cooling-vendor warranties, software licences, spares and service commitments. Check assignment and territorial coverage. A buyer should know how the asset operates during the first night, first maintenance window and first major alarm after closing.
Create a credential, configuration and document handover plan. Test backup restoration and emergency contacts before the seller exits.
36. Establish the first 100-day value-control plan
Prioritize safety, service continuity and evidence quality. Calibrate critical sensors, close urgent maintenance, validate alarms, secure administrative access and establish a daily operating dashboard. Defer discretionary optimization until baseline controls are reliable.
Implement the costed thermal remediation plan with customer and vendor coordination. Confirm outage windows, temporary cooling and acceptance tests. Track capex against the transaction model.
Reforecast EBITDA, capex and sellable capacity at 30, 60 and 100 days. Escalate deviations to the board and lenders. Preserve claim rights under the purchase agreement by maintaining evidence and notice deadlines.
37. Frame the investment committee decision
The investment paper should state reliable sellable capacity, adjusted EBITDA, immediate and sustaining capex, principal failure modes, customer exposure, utility rights, permit status and transaction protections. It should distinguish observed evidence from hypothetical scenarios.
Proceed only where the price and legal structure reflect the remaining risk and the buyer has a feasible remediation plan. Reprice where normalized cash flow or capex differs materially from the seller case. Defer closing where a critical consent, utility right or test remains unresolved. Withdraw where the asset cannot meet service obligations within an acceptable capital and risk envelope.
The technical report, valuation model, financing case, purchase agreement and 100-day plan should share one set of definitions and figures.
Appendix A. Tropical thermal model
Build an hourly model with outdoor dry-bulb temperature, relative humidity, dew point, information-technology load, supply temperature, cooling power, pump and fan power, water use and alarms. Reconcile totals to utility invoices and reported PUE and WUE.
Use separate curves for each plant configuration and load band. Record assumptions for fouling, redundancy, control sequences and equipment degradation. Preserve the raw data, transformations and model version.
Output monthly energy, peak demand, cooling-system efficiency, water use, thermal headroom and excursion hours. Link the model to the operating forecast and valuation adjustments.
Appendix B. Minimum confirmatory evidence
Obtain utility agreements and invoices, hourly meter data, building-management exports, sensor inventory and calibration certificates, design drawings, commissioning reports, integrated tests, maintenance records, incident logs, insurance claims, permits, water records, refrigerant records, customer contracts, service-credit calculations and capex quotations.
For every item, record period, source, owner, completeness and exceptions. Retain native files and metadata. Reconcile summaries to source systems.
Require independent tests for material unresolved issues. A seller-prepared presentation can guide questions and does not replace confirmatory evidence.
Appendix C. Hypothetical worked case
The target has 24 MW installed capacity, 21 MW commissioned capacity and 17 MW average utilized load. Reported revenue is USD 78 million and reported EBITDA is USD 32 million. Diligence adjustments comprise USD 2.6 million of recurring operating cost and USD 1.4 million of expected annual service credits, producing USD 28 million of adjusted EBITDA.
Immediate cooling, controls and water-system capex is USD 18 million. Headline enterprise value at 14.0 times reported EBITDA is USD 448 million. Adjusted enterprise value at 12.5 times adjusted EBITDA, less immediate capex, is USD 332 million. The adverse case uses USD 25 million of EBITDA, USD 27 million of immediate capex and an 11.5 times multiple, producing USD 260.5 million. All figures are wholly hypothetical.
Appendix D. Investment committee questions
What capacity can operate through adverse ambient conditions with contractual redundancy? Which sensors and meters support that conclusion? How much EBITDA changes after weather, utilization, maintenance and service-credit normalization? What capex is required before closing, during the first 100 days and over the hold period?
Which customer, utility, water, permit and vendor rights survive change of control? Which risks remain uninsured or uncapped? How do transaction protections address known defects and evidence gaps?
What price and return range results from central and adverse cases? Which assumptions depend on management estimates, and what evidence will close them?
Appendix E. Scenario governance
Assign each assumption a source, date, owner, confidence level and approval. Separate observed data, contracted terms, engineering estimates and hypothetical scenarios. Version-control the model and preserve change logs.
Use a central case, defined individual stresses and a combined adverse case. Avoid combining incompatible assumptions or applying savings before the enabling action is funded and approved.
Set thresholds for price change, escrow, closing condition and withdrawal. Revisit the decision when new evidence changes a critical assumption.
Appendix F. Data dictionary
Installed capacity is the nameplate information-technology capacity physically present. Commissioned capacity has passed the defined integrated test. Available capacity can operate within redundancy and environmental limits. Contracted capacity is reserved under executed customer contracts. Utilized capacity carries customer load. Billable capacity meets the billing condition. Collected revenue has been received in cash.
Dry-bulb temperature measures air temperature. Relative humidity expresses moisture relative to saturation at that temperature. Dew point indicates the temperature at which condensation begins. PUE is total facility energy divided by information-technology energy. WUE is water use divided by information-technology energy under a stated boundary.
Use these definitions consistently across engineering, commercial, financial and legal workstreams.
Appendix G. Decision figures and tables
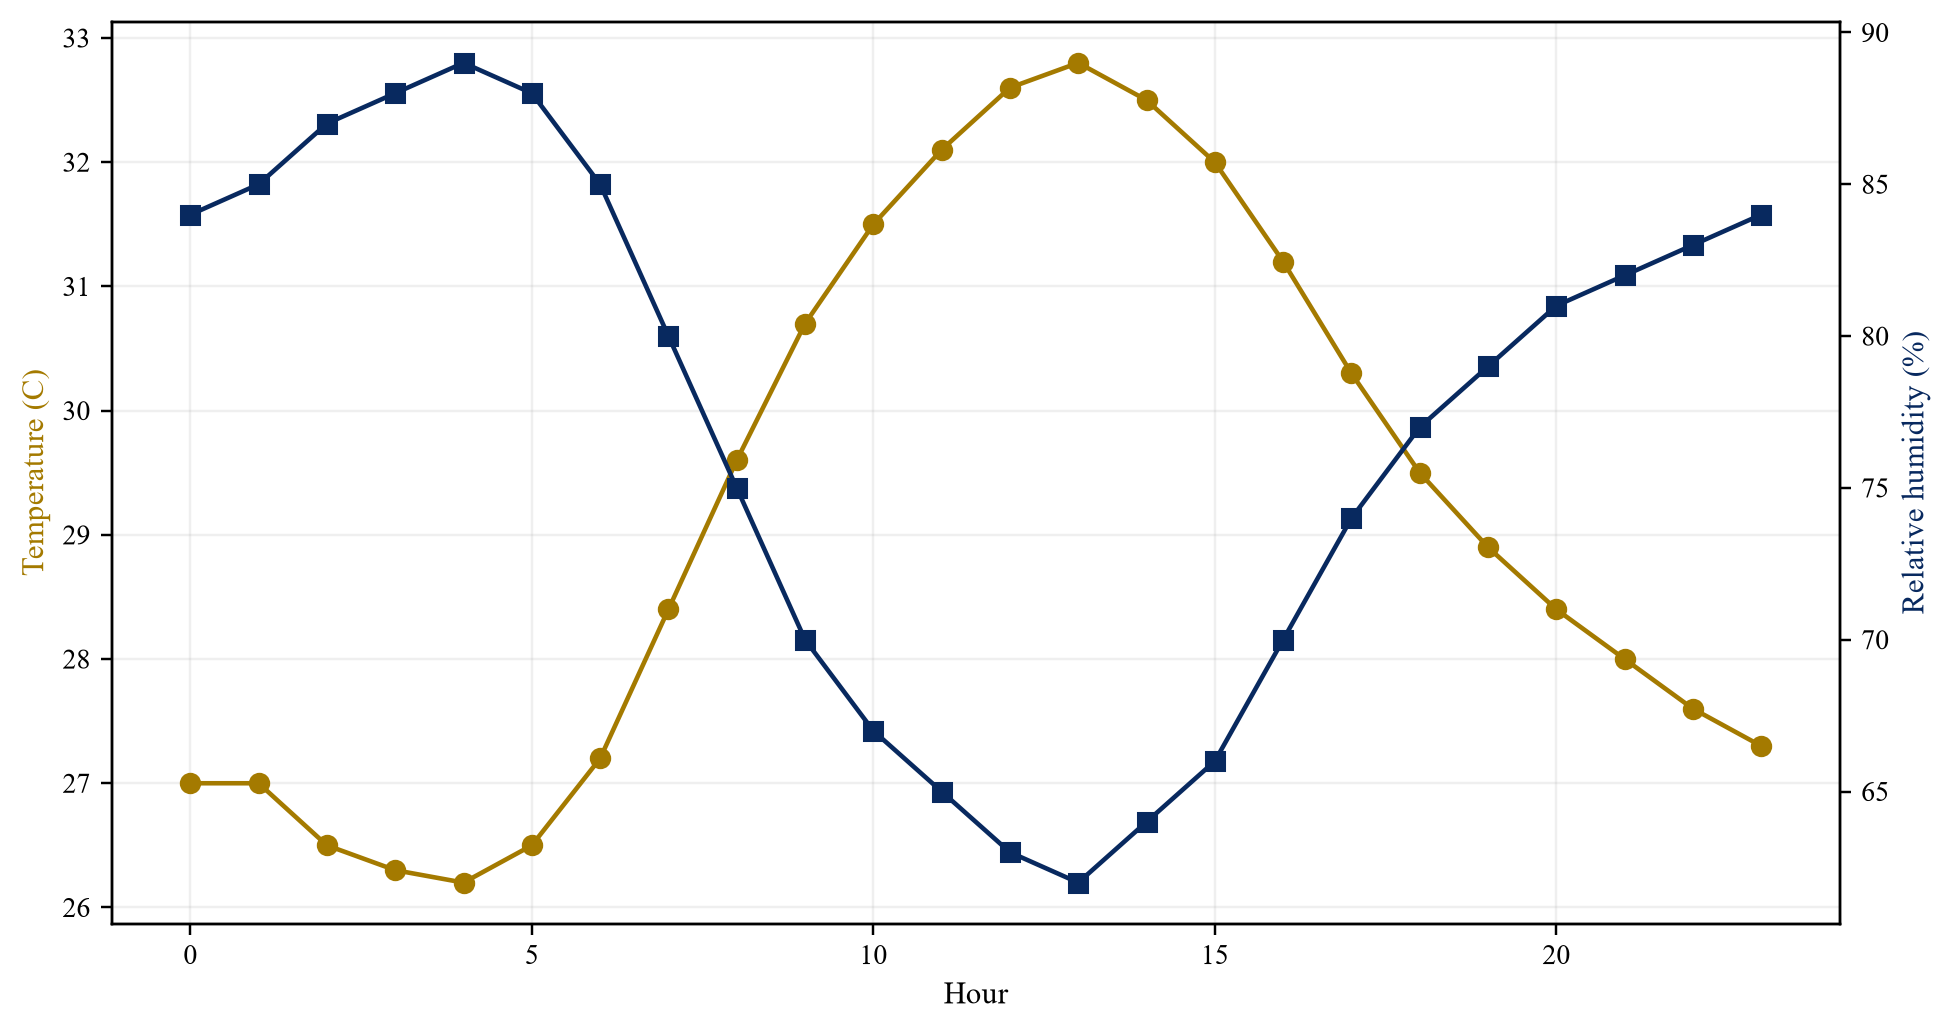
Wholly hypothetical 24-hour profile; no identified site.
| Market | Principal published framework | Cooling and resource diligence focus |
|---|---|---|
| Singapore | SS 697, SS 715 and GMDC 2024 | tropical set points, measured efficiency, power and water allocation |
| Malaysia | Sustainable Development of Data Centre guideline | PUE, WUE, carbon, water stress and incentive conditions |
| Thailand | BOI promotion conditions | PUE, backup systems, power readiness and advanced computing |
| Indonesia | site-specific utility, data and operating approvals | grid, flooding, permits, data obligations and resilience |
| Philippines and Viet Nam | site-specific investment, utility and data rules | power, water, telecoms, permitting and climate exposure |
High-level framework; verify current requirements with local advisers.
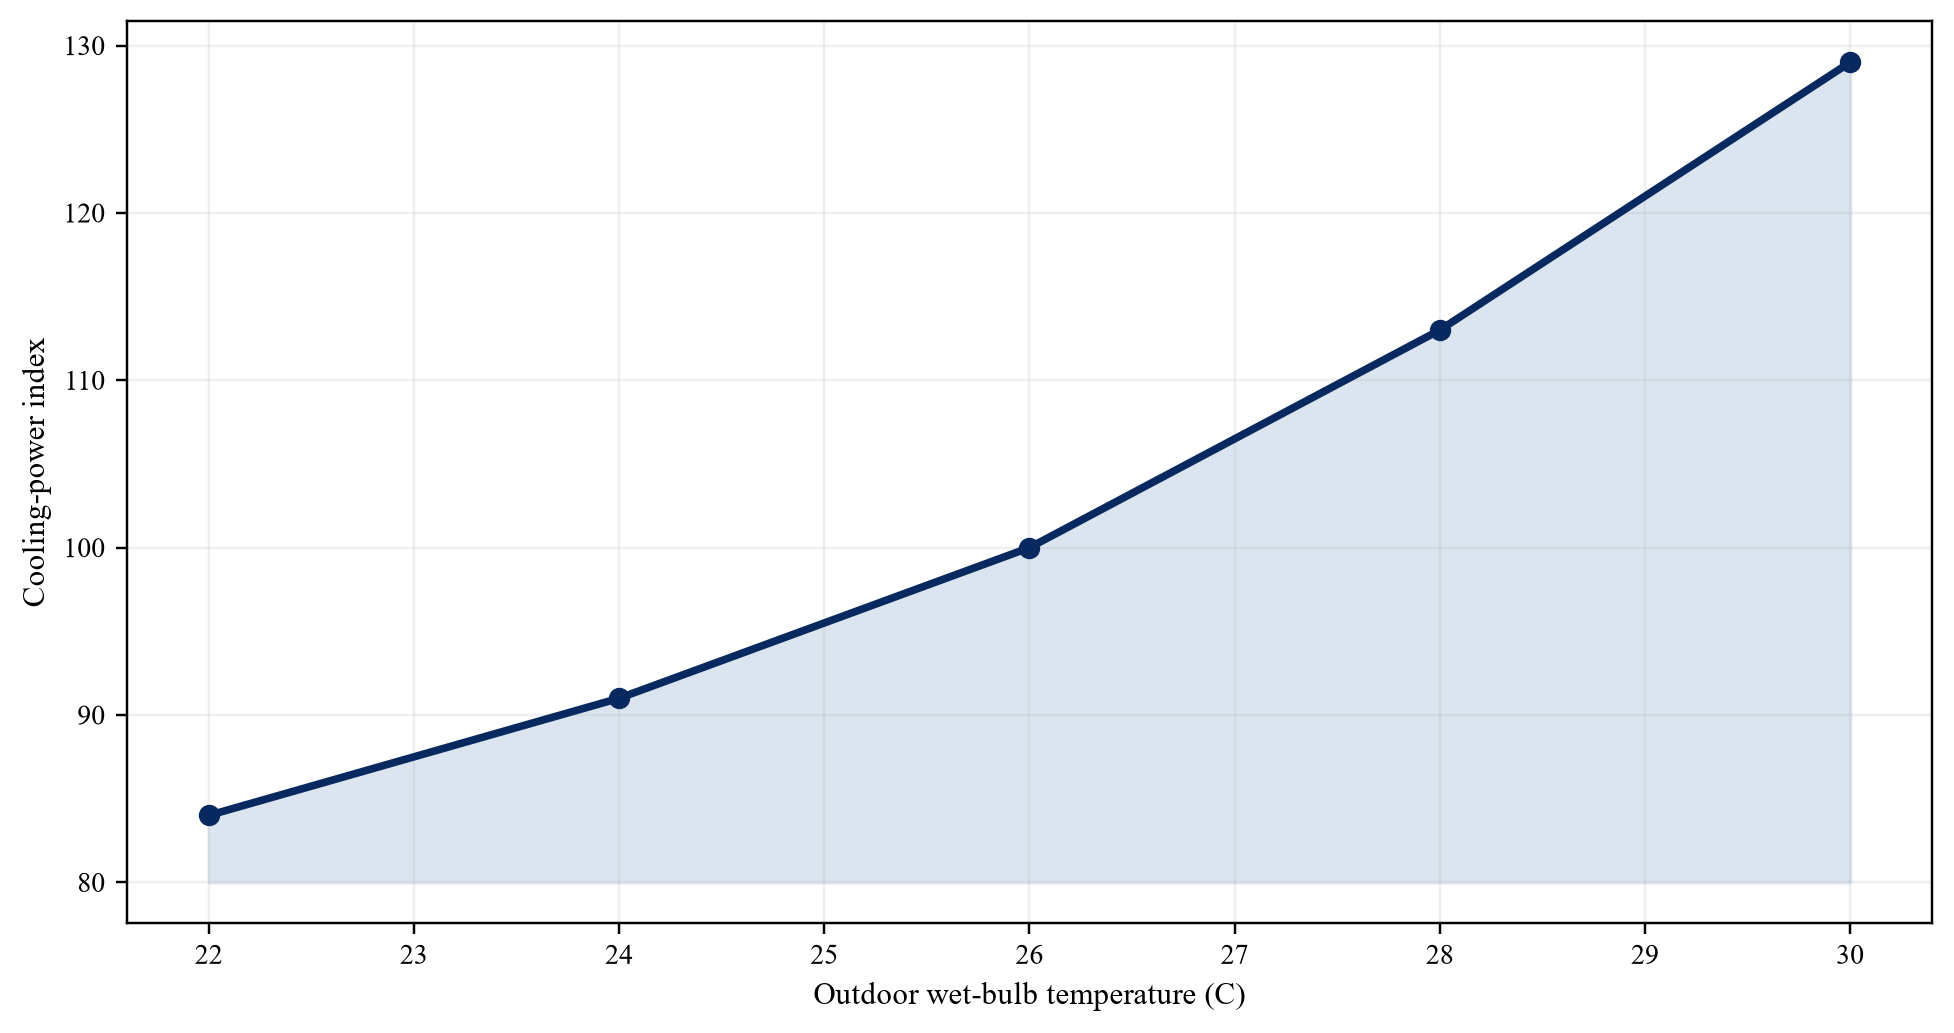
Wholly hypothetical index at constant information-technology load.
| Evidence | Minimum period | Acquisition use |
|---|---|---|
| Hourly weather and plant trends | 36 months | normalize efficiency and peak load |
| Sensor register and calibration | current plus history | test measurement reliability |
| Maintenance and incident records | 36 months | identify condition and failure patterns |
| Utility and water invoices | 36 months | reconcile cost and reported metrics |
| Customer contracts and credits | contract term plus history | link service obligations to cash flow |
| Capex quotes and lifecycle plan | current | quantify immediate and sustaining capital |
Proposed buyer-side request list.
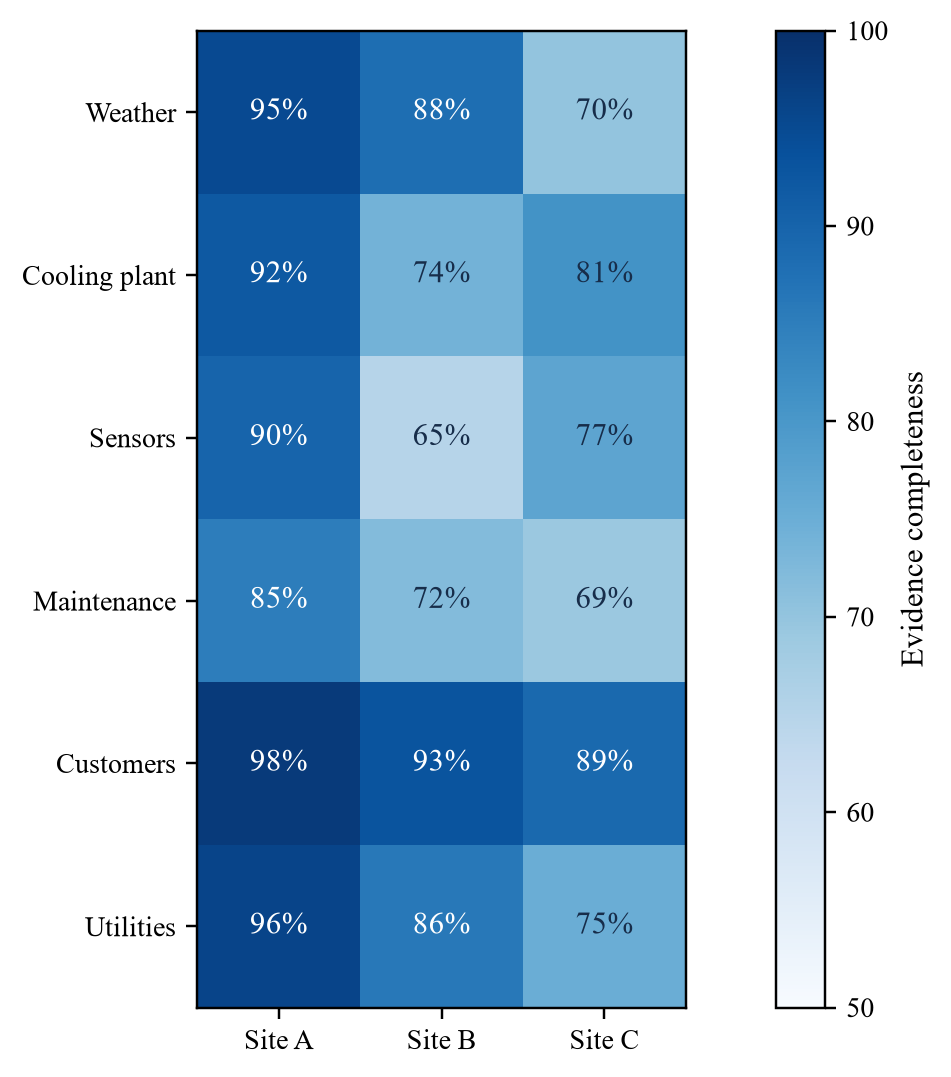
Wholly hypothetical completeness scores.
| Failure mode | Evidence | Cash-flow consequence |
|---|---|---|
| Condensation on cold surfaces | dew-point trends, insulation survey and incident logs | outage, repair and customer claims |
| Corrosion with contaminants | coupons, filters and equipment inspection | failure rate and replacement capex |
| Excessive dehumidification | coil, reheat and control trends | recurring power cost |
| Sensor drift | calibration and cross-checks | misstated efficiency and hidden excursions |
| Drain or leak failure | alarms, work orders and tests | equipment damage and downtime |
Proposed framework; severity depends on site evidence.
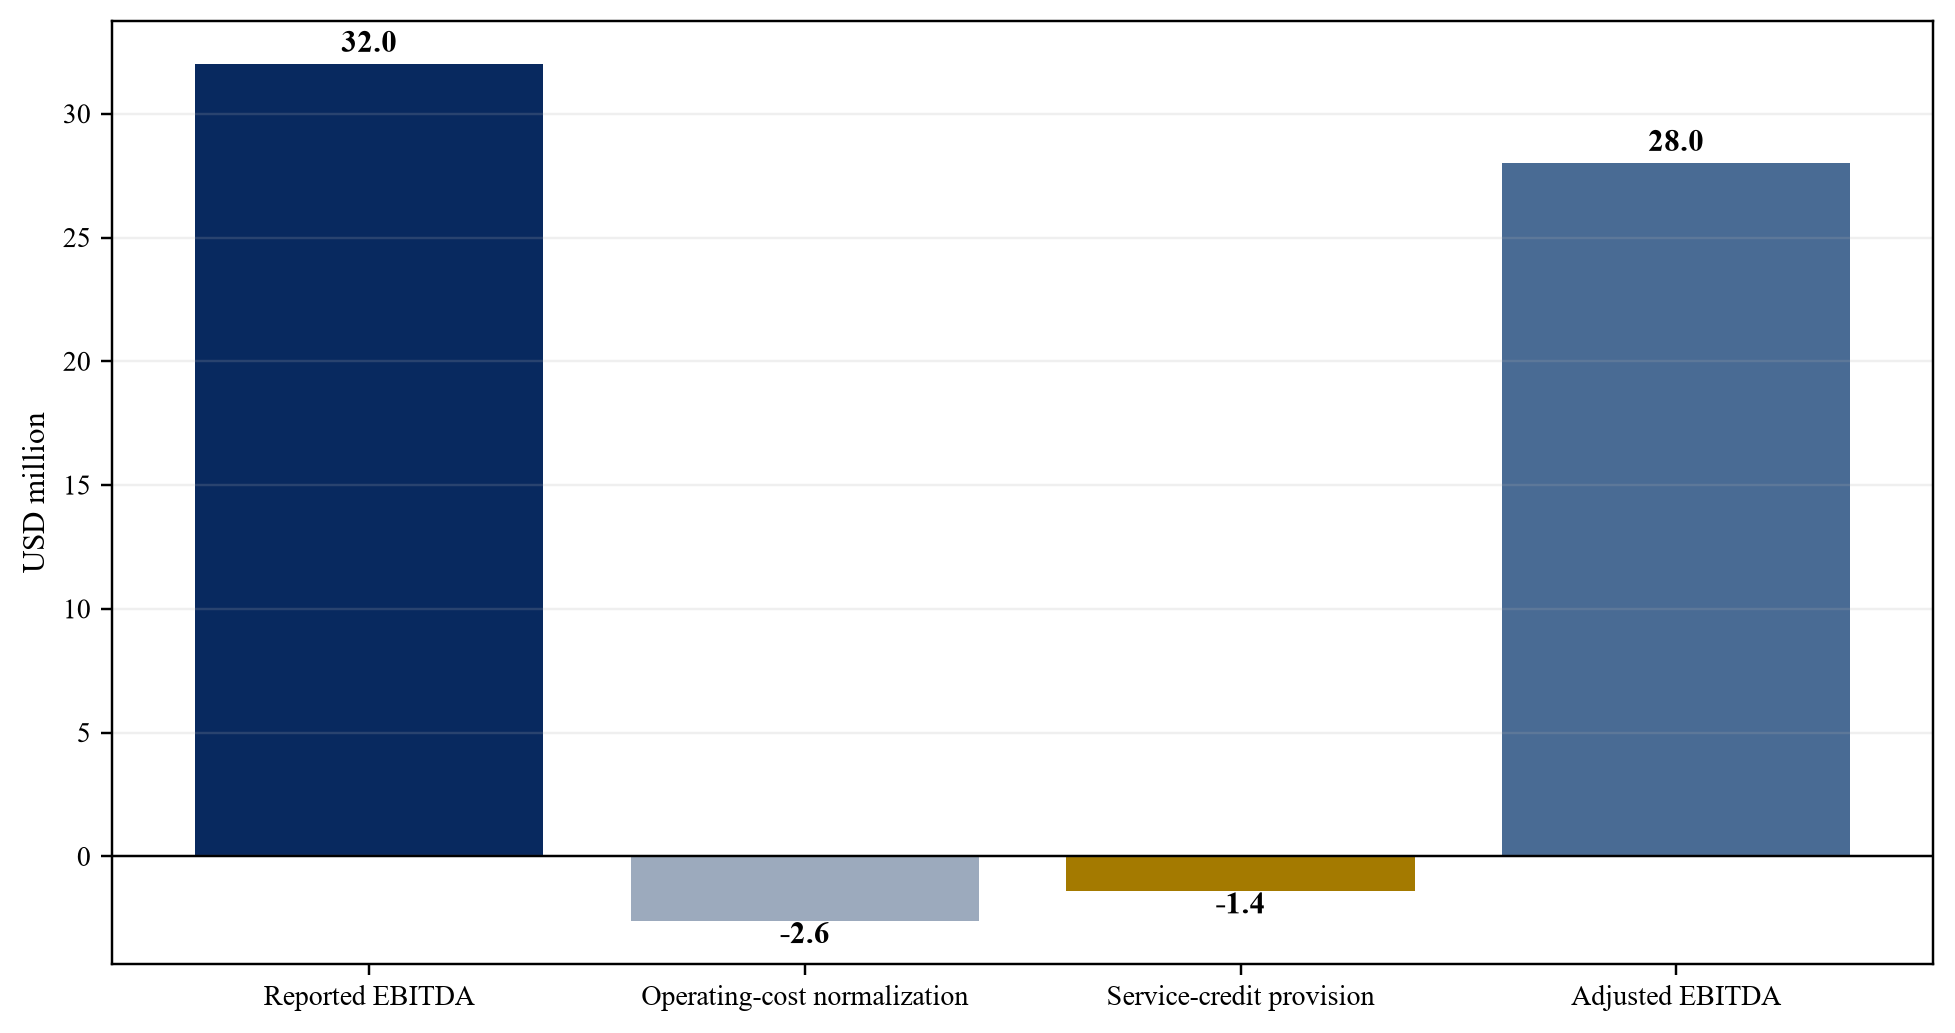
Wholly hypothetical; USD million.
| Architecture | Principal diligence issue | Minimum confirmatory test |
|---|---|---|
| Air cooled hall | recirculation and density ceiling | rack-inlet map and failure test |
| Chilled water | part-load efficiency and common headers | witnessed plant test and trend analysis |
| Direct to chip | interface, coolant and leak responsibility | integrated loop and customer acceptance test |
| Immersion | fluid compatibility and residual value | equipment qualification and service plan |
| Hybrid | control boundary and mixed operating modes | mode matrix and measured transition test |
Proposed framework unless stated otherwise.
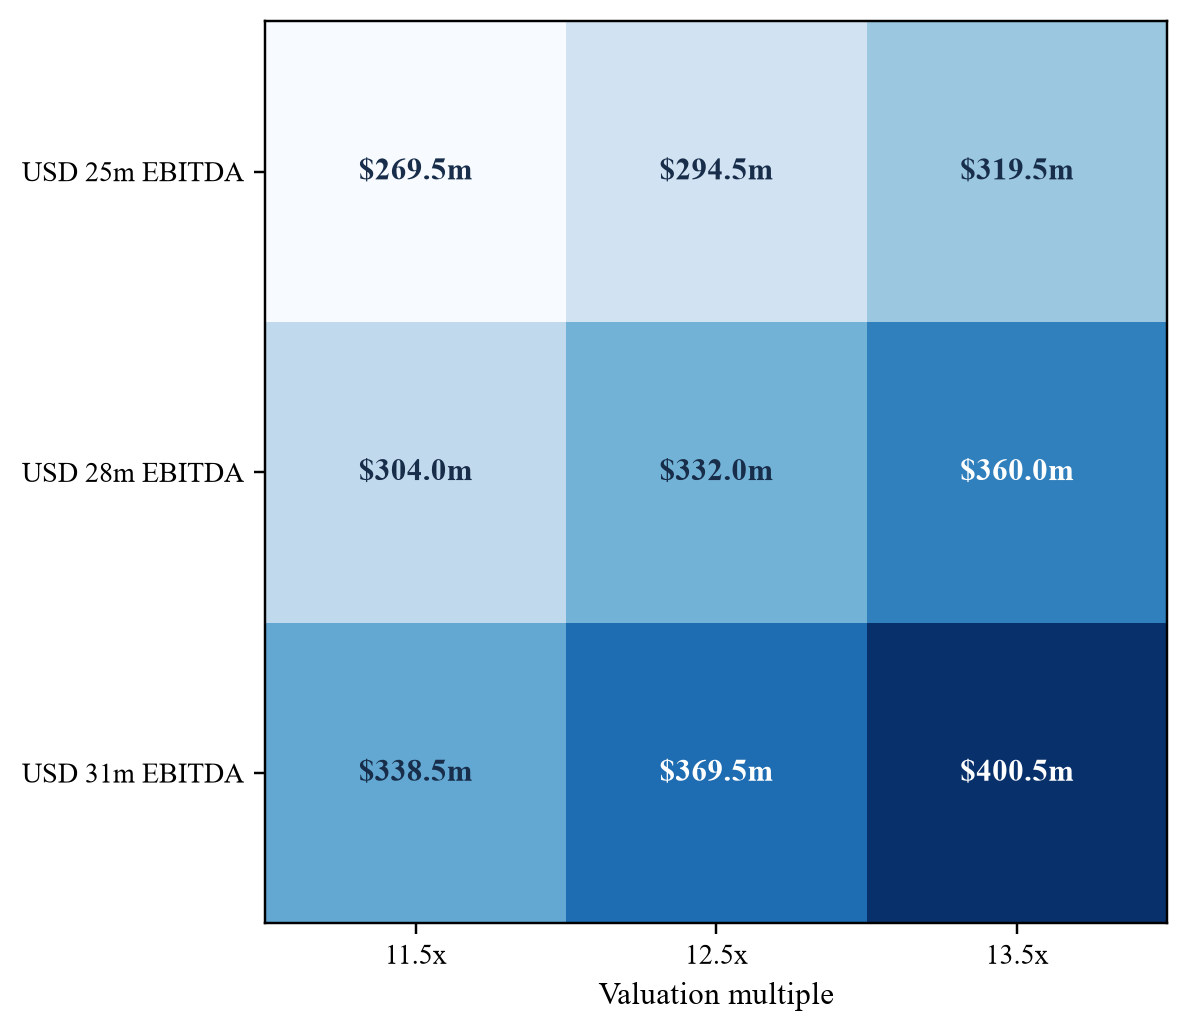
Wholly hypothetical; values deduct USD 18 million of immediate capex.
| Item | Seller case | Buyer central case | Buyer adverse case |
|---|---|---|---|
| Reported or adjusted EBITDA | 32.0 | 28.0 | 25.0 |
| Applied multiple | 14.0x | 12.5x | 11.5x |
| Value before immediate capex | 448.0 | 350.0 | 287.5 |
| Immediate capex | 0.0 | 18.0 | 27.0 |
| Enterprise value after immediate capex | 448.0 | 332.0 | 260.5 |
Wholly hypothetical; USD million except multiples.
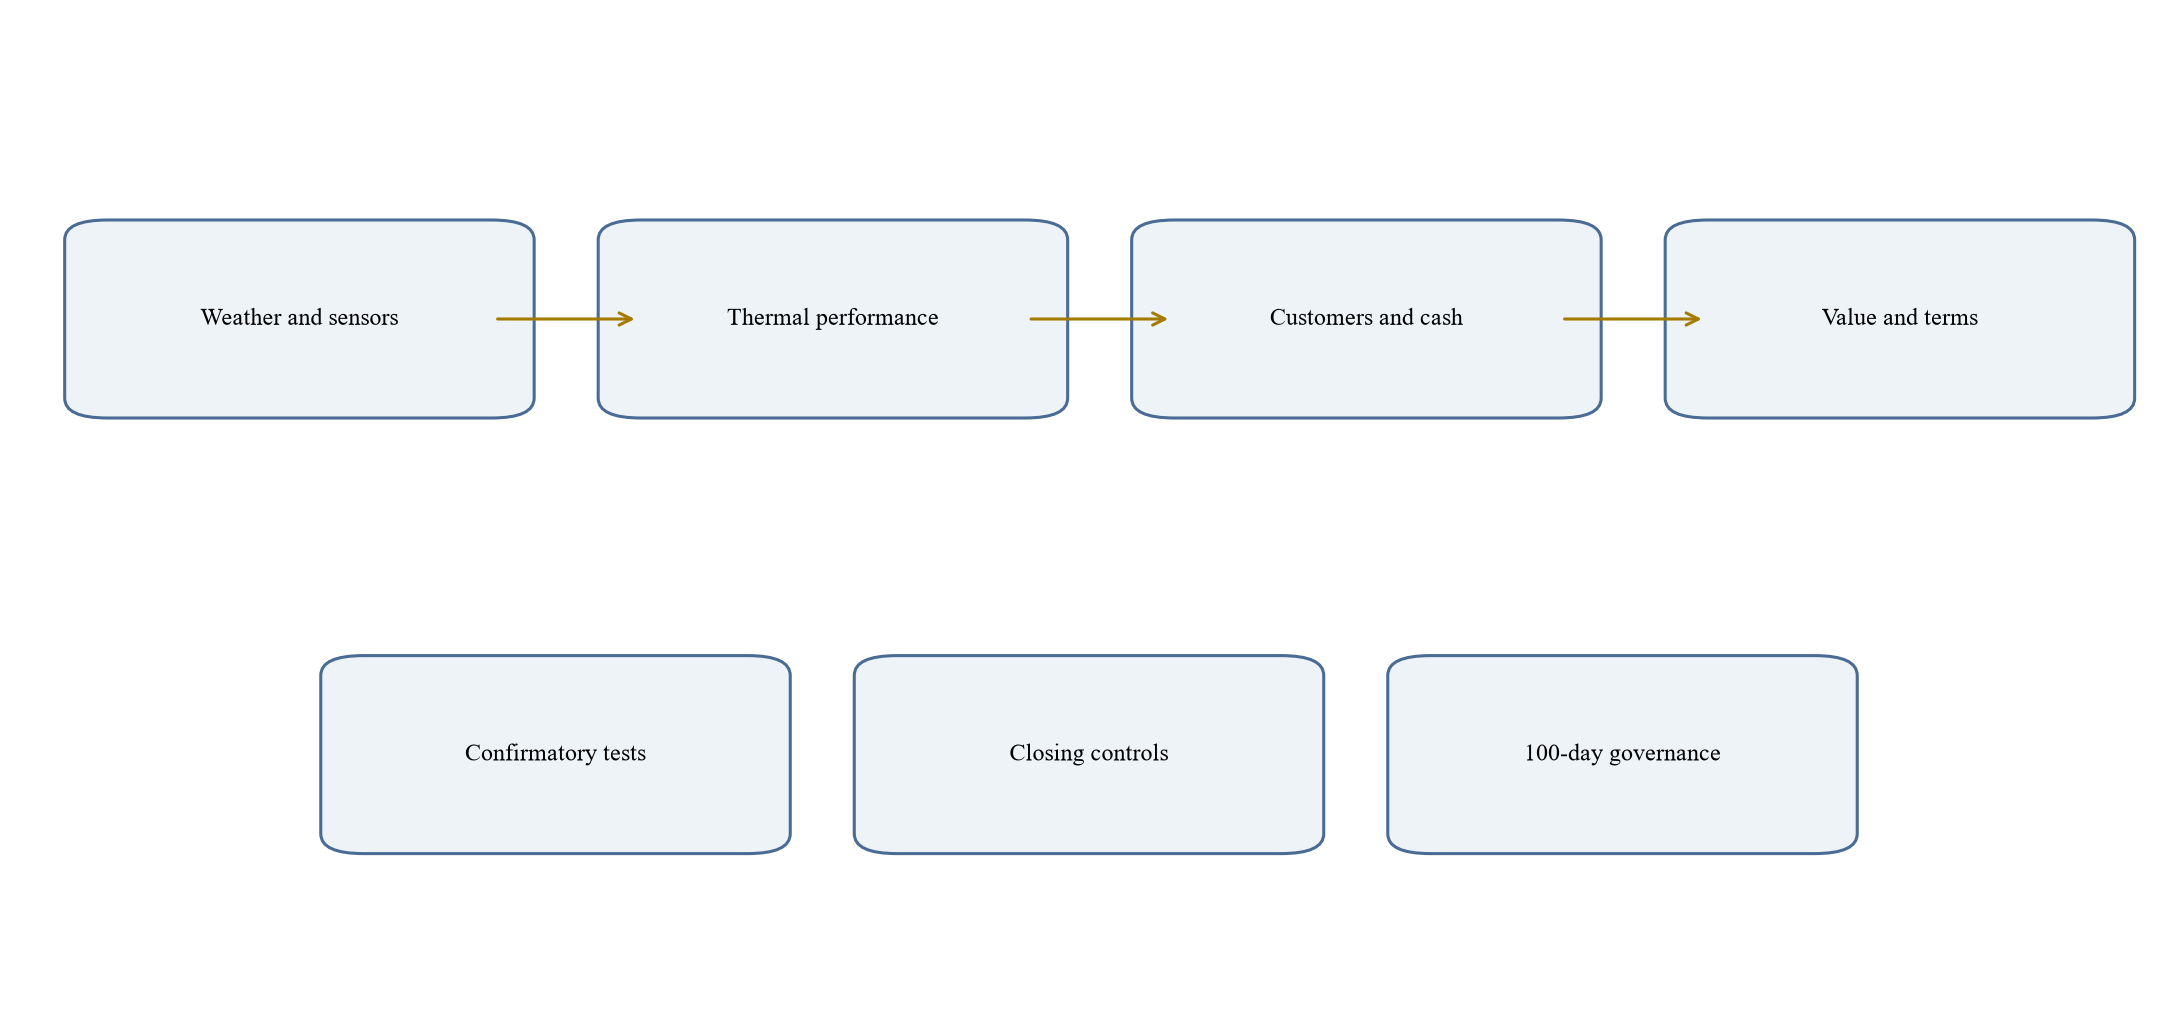
Proposed governance framework.
| Risk | Protection | Evidence or trigger |
|---|---|---|
| Cooling-capacity shortfall | price adjustment or remediation condition | witnessed capacity test |
| Undisclosed service credits | specific indemnity and escrow | customer claims and billing records |
| Deferred maintenance | capex holdback | independent asset-condition report |
| Permit or utility consent | condition precedent | written authority or counterparty consent |
| Meter-data weakness | contingent consideration or reserve | calibrated data and agreed measurement period |
Terms require transaction-specific legal advice.
| Metric | Source | Trigger |
|---|---|---|
| Reliable sellable and utilized MW | commissioning, thermal model and customer records | capacity shortfall |
| Rack inlet, dew point and excursion hours | calibrated environmental sensors | service or condensation risk |
| Weather-normalized PUE and WUE | utility and subsystem meters | cost or resource variance |
| Cooling-system efficiency and redundancy | plant trends and tests | loss of headroom |
| Adjusted EBITDA and service credits | billing, cost ledger and contracts | valuation variance |
| Immediate capex and implementation | approved plan and invoices | funding or timetable variance |
Proposed framework unless stated otherwise.
Sources
- International Energy Agency, Energy demand from AI, Energy and AI, 2025. Read the primary source
- Infocomm Media Development Authority, Green Data Centre Roadmap. Read the primary source
- Infocomm Media Development Authority, Tropical Data Centre Standard SS 697:2023. Read the primary source
- Building and Construction Authority and Infocomm Media Development Authority, Green Mark for Data Centres 2024. Read the primary source
- PUB Singapore National Water Agency, Sectoral Water Efficiency Benchmark. Read the primary source
- PUB Singapore National Water Agency, Water Efficiency Awards 2024. Read the primary source
- Infocomm Media Development Authority, Green Data Centre Standard SS 564. Read the primary source
- Infocomm Media Development Authority, Singapore IT Energy Efficiency Standard for Data Centres SS 715:2025. Read the primary source
- Malaysian Investment Development Authority, Guideline for Sustainable Development of Data Centre. Read the primary source
- Malaysian Investment Development Authority, Sustainable Infrastructure Local Impact, 30 May 2025. Read the primary source
- Thailand Board of Investment, First-half 2025 investment applications and data-centre projects. Read the primary source
- Thailand Board of Investment, Higher technology and human-resource requirements for data-centre investment, 19 May 2025. Read the primary source
- Thailand Board of Investment, Investment Promotion Guide 2025. Read the primary source
- Thailand Board of Investment, Thailand FastPass and power-readiness measures. Read the primary source
- Ministry of Communication and Digital Affairs Indonesia, National Data Centre operating-readiness update, 2 May 2025. Read the primary source
- ASEAN Centre for Energy, The rise of data centres artificial intelligence and ASEAN decarbonisation. Read the primary source
- ASHRAE, Gaseous and Particulate Contamination Guidelines for Data Centers. Read the primary source
- ASHRAE Handbook, Data Centers and Telecommunication Facilities, Chapter 20. Read the primary source
- ASHRAE, Emergence and Expansion of Liquid Cooling in Mainstream Data Centers. Read the primary source
- ASHRAE, Water-Cooled Servers Common Designs Components and Processes. Read the primary source
- World Meteorological Organization, State of the Climate in Asia 2025. Read the primary source
- International Organization for Standardization, ISO IEC 30134-2 Power Usage Effectiveness. Read the primary source
- International Organization for Standardization, ISO IEC 30134-9 Water Usage Effectiveness. Read the primary source
- International Energy Agency, Southeast Asia Energy Outlook 2026. Read the primary source
- International Energy Agency, Energy and AI executive summary, 2025. Read the primary source
- IFRS Foundation, IFRS 3 Business Combinations. Read the primary source
- IFRS Foundation, IFRS 13 Fair Value Measurement. Read the primary source
- IFRS Foundation, IAS 36 Impairment of Assets. Read the primary source
- IFRS Foundation, IFRS S2 Climate-related Disclosures. Read the primary source
- Open Compute Project Foundation, Advanced Cooling Solutions project. Read the primary source
