

Introduction
An industrial plant becomes stranded economically before it becomes unusable physically. Furnaces, kilns, smelters, chemical trains, boilers and production lines may continue to operate while their future cash flow falls below the capital required to sustain them. The causes can include carbon prices, expensive electricity, network constraints, border adjustments, lower-emissions substitutes, customer procurement standards and retrofit obligations.
The valuation problem is difficult because these risks interact. Electrification can reduce direct emissions while increasing exposure to power prices and grid capacity. Carbon capture can preserve an existing process while adding energy consumption, transport requirements and capital. Free emissions allowances can soften near-term cost while declining over time. Border measures can protect a domestic producer from carbon-intensive imports while creating new measurement and reporting burdens for exporters.
The European Union's Carbon Border Adjustment Mechanism entered its definitive regime on 1 January 2026 for specified goods, with certificate prices linked to EU Emissions Trading System allowance prices.[1] The European Commission states that free allocation for CBAM sectors is being phased out over time.[2] The United Kingdom plans its own CBAM from 1 January 2027 for specified aluminium, cement, fertiliser, hydrogen, iron and steel imports.[3] These rules make plant-level emissions data and product destination relevant to value.
Power economics can be equally material. The International Energy Agency reports that EU electricity prices for energy-intensive industries in 2025 remained more than twice US levels and nearly fifty per cent above Chinese levels.[4] Regional cost divergence affects capacity utilisation, investment and customer sourcing. A plant's location can therefore change its value even when its equipment and product are identical.
This paper addresses the board, investor and lender decision: what is the plant worth after carbon, power and border risk, and which action preserves the greatest risk-adjusted value?
1. Define the valuation purpose
The purpose determines the model. A board considering continued operation needs a capital-allocation view. A buyer needs a transaction value and protection package. A lender needs debt capacity and covenant headroom. Financial reporting may require an impairment assessment under applicable accounting standards.
Each purpose uses different assumptions, horizons and constraints. Market value can reflect a buyer's retrofit capability. Value in use generally follows the asset in its current condition under the applicable accounting framework. A liquidation value focuses on separable equipment, land, permits and closure liabilities.
The valuation memorandum should identify its purpose, valuation date, currency, perimeter and decision. It should keep observed facts, contractual terms and hypothetical scenarios distinct.
2. Define the plant perimeter
Map the assets and obligations that produce cash flow. The perimeter can include land, buildings, production equipment, utilities, grid connection, emissions permits, warehouses, logistics, software, contracts, working capital and environmental liabilities.
Shared infrastructure complicates allocation. A captive power plant, port, water system or pipeline may support several production units. Costs and rights should follow physical use and legal control rather than arbitrary accounting allocation.
The model should identify which assets can be repurposed or sold separately. Site-specific equipment can have low removal value. Grid connection, land, permits and logistics can retain value after the original process becomes uneconomic.
3. Build a plant-level transition ledger
The transition ledger records annual production, energy input, direct emissions, purchased-electricity emissions, free allowances, carbon cost, border exposure, product premiums, compliance expenditure and retrofit commitments. It connects technical data to cash flow.
Use product and production-line granularity where emissions and margins differ. A blended site average can hide one profitable low-carbon line and one structurally loss-making line. Customer destination also matters when border rules vary.
Every data field should have an owner, source, measurement method and refresh date. The ledger becomes the controlled basis for valuation, budgeting, customer negotiation and external reporting.
4. Separate policy facts from scenarios
The base case should include enacted rules and current contracts. Proposed policy, expected carbon prices and future customer standards belong in named scenarios until their status changes. This prevents a forecast from being presented as law.
Policy mapping should cover jurisdiction, sector, product, emissions scope, effective date, free allocation, relief, reporting, default values and enforcement. Cross-border assets may face rules in both production and destination markets.
Scenario probabilities should be governance choices, supported by evidence. The model should also show unweighted cases so decision-makers can see the exposure without a probability overlay.
5. Calculate direct carbon exposure
Direct exposure begins with verified emissions per unit of product and the volume expected in each year. Multiply uncovered emissions by the relevant carbon price, then include compliance, verification and hedging costs.
Free allocation should be modelled explicitly by year and benchmark. The European Commission links industrial allocation to performance benchmarks and activity levels and is reducing allocation for CBAM sectors over time.[2] A permanent free-allocation assumption can overstate value.
Operational changes can affect both emissions intensity and allocation. The model should avoid counting a lower production volume as an efficiency gain. It should distinguish physical emissions reduction from financial relief.
6. Calculate electricity exposure
Electricity cost includes energy, capacity, network, balancing, taxes, levies, losses and hedging. Industrial tariffs can differ materially from wholesale prices. The model should use the plant's contractual position and load profile.
Hourly shape matters for electrified processes. A stable annual average can conceal peak demand charges and periods when power is scarce. Flexible production, thermal storage and interruptible arrangements can create value by shifting load.
The cash-flow model should separate fixed network cost, contracted power, indexed power and merchant exposure. It should show hedge expiry and the replacement price required to sustain margin.
7. Include indirect emissions where commercially relevant
Purchased-electricity emissions may affect customer procurement, product certification and some regulatory calculations. Their financial effect can arise through premiums, eligibility or demand even where a border mechanism initially excludes them.
Define the emissions factor, contractual instrument and claim boundary. Location-based and market-based measures can produce different results. Renewable certificates or power contracts should be assessed for legal and commercial recognition.
The valuation should include only benefits supported by an enforceable rule or customer contract in the base case. Other potential benefits remain scenario value.
8. Map border-adjustment exposure
For each product, map destination, commodity code, embedded-emissions method, default value, carbon price paid in the origin jurisdiction and available deduction. The importer may bear the formal obligation while the producer bears the economic effect through price negotiation.
The EU definitive regime applies to specified cement, iron and steel, aluminium, fertiliser, electricity and hydrogen products.[1] The UK regime scheduled for 2027 has its own scope and methodology.[3] A single global carbon-cost assumption is therefore inadequate.
The model should test actual verified emissions against default values. Poor data can create a higher deemed liability, delayed sales or customer reluctance. Measurement capability becomes part of plant value.
9. Model free-allocation decline
Free allowances can support near-term cash flow while creating a future cliff. Model the allocation volume, benchmark, production adjustment, eligibility conditions and phase-down schedule separately from gross emissions.
The valuation should show gross carbon cost, free allocation value and net carbon cost. This transparency prevents a temporary policy benefit from being embedded in the terminal margin.
Management should test whether efficiency, product mix or retrofit can preserve competitiveness as allocation declines. Delay has value only when it creates time to act.
10. Map customer pass-through
Review sales contracts for carbon, electricity, freight and change-in-law pass-through. A published carbon index provides little protection when the contract caps increases, lags recovery or allows customers to switch suppliers.
Classify revenue as fixed, indexed, cost-plus or spot. Identify reset dates, notice periods, volume commitments and termination rights. Pass-through should be modelled net of volume loss and collection risk.
Where customers value lower-emissions product, a premium may offset transition cost. The base case should include premiums only when contracted or evidenced by current realised sales.
11. Distinguish cyclical and structural pressure
Cyclical pressure can reverse with commodity prices, energy markets or capacity closures. Structural pressure persists because of technology, regulation, resource quality or geography. The action depends on the classification.
Compare the plant with regional and global cost curves under normalised inputs. A plant that remains high-cost across plausible cycles needs structural intervention. A competitive plant facing a temporary power spike may require hedging and liquidity.
The model should show recovery cases without assuming that every adverse condition reverts. Historical mean reversion is evidence, not a guarantee.
12. Build the product contribution margin
Start with realised net price by product and destination. Deduct raw materials, energy, carbon, logistics, variable labour, consumables, royalties, compliance and customer-specific cost. The result identifies which output creates value.
Fixed cost should then be allocated using a decision-relevant method. Closing one line may not remove shared cost. The model should distinguish avoidable and stranded overhead.
Contribution margins support production and closure decisions. EBITDA alone can hide a product whose revenue no longer covers incremental carbon and power cost.
13. Create a carbon-price ladder
Model a range of carbon prices and timing rather than one long-term point estimate. Each case should identify its policy basis, currency and real or nominal treatment. Correlate free allocation and border adjustments where rules link them.
The World Bank reported eighty direct carbon-pricing instruments in operation in 2025 and coverage of around twenty-eight per cent of global greenhouse-gas emissions.[5] The OECD documents significant variation across jurisdictions and instruments.[6]
The ladder should reveal the carbon price at which the plant's contribution margin, debt coverage or recoverable amount falls below a decision threshold.
14. Create a power-price ladder
Power cases should reflect regional forwards, contract structures, network charges, renewable supply and plausible stress events. A uniform percentage shock does not capture basis, shape or hedge expiry.
The IEA's reported regional price divergence demonstrates the importance of location.[4] A globally traded product can face a local electricity cost that competitors do not share.
The ladder should show break-even power price and the value of each hedge, power purchase agreement, on-site generator or flexibility measure.
15. Combine carbon and power risk
Carbon and power exposure can move together or in opposite directions. Electrification reduces direct fuel emissions while increasing power demand. Renewable power can lower both cost and emissions in some periods, while grid constraints can raise cost.
Use a two-dimensional sensitivity with carbon cost on one axis and delivered-power premium on the other. Show plant value, margin and debt coverage at each intersection.
The board should focus on thresholds that change the recommended action. Sensitivity becomes useful when it identifies a decision boundary.
16. Include production-volume effects
Lower utilisation spreads fixed cost across fewer units and can reduce process efficiency. It may also change free allocation, contract payments and maintenance needs. A volume downside is therefore more than a proportional revenue reduction.
Model minimum efficient load, shutdown and restart cost, campaign production and working capital. Some plants preserve value by operating intermittently; others suffer damage or prohibitive restart cost.
Volume should be linked to customer contracts and market demand. An uncontracted production forecast should remain an equity scenario rather than debt support.
17. Test exchange-rate exposure
Industrial assets often sell in one currency and buy energy, raw materials or debt service in another. Carbon and border costs can introduce additional currency exposure.
The model should separate transaction, translation and competitive effects. A weaker local currency can improve export revenue while increasing imported energy or equipment cost.
Hedge availability and tenor should be included. A short hedge does not protect a long-lived structural mismatch.
18. Map technology obsolescence
Technology risk includes lower-cost substitutes, changing product specifications, process innovation and equipment that cannot meet future emissions limits. The assessment should compare current performance with credible commercial alternatives.
The IEA notes that some near-zero-emissions industrial technologies remain more expensive than conventional processes and that regional energy costs can dominate competitiveness.[7] Technology choice should therefore be tested with local inputs and timing.
A plant can retain option value through modular upgrades, space, grid capacity and compatible logistics. Rigid equipment and constrained sites can lose value faster.
19. Define retrofit options
List efficiency, fuel switching, electrification, renewable supply, heat recovery, storage, process redesign, carbon capture and product-mix changes. For each option, state capital cost, schedule, emissions reduction, energy effect, production impact and commercial benefit.
Do not combine incompatible measures or count the same saving twice. Electrification changes the baseline for heat recovery and carbon capture. Sequence matters.
The base case should include only approved and funded measures. Other projects are options with separate probability and capital requirements.
20. Value efficiency first
Efficiency can reduce both carbon and power exposure with lower technical complexity than process replacement. Opportunities include motors, drives, compressors, insulation, heat integration, controls and maintenance.
The IEA's industrial work identifies efficiency as a competitiveness measure and reports strong management attention to it.[8] Plant-specific savings still require engineering evidence and measurement.
Value efficiency through avoided input, avoided carbon, reliability and deferred capacity. Deduct implementation cost, downtime and persistence risk.
21. Value electrification carefully
Electrification can reduce direct emissions and enable renewable power, particularly for lower-temperature heat. It can also increase peak demand, grid dependency and exposure to regional electricity prices.
The IEA identifies commercially available heat pumps, electric boilers and resistance heating for many lower-temperature applications.[9] Suitability depends on process temperature, load profile, grid and power economics.
The model should compare fuel and electricity on a useful-heat basis, including conversion efficiency, network cost, storage and backup.
22. Value flexibility and storage
Flexible load and thermal or electrical storage can shift consumption away from expensive hours, reduce demand charges and support renewable integration. The value depends on price volatility, operating constraints and market access.
Model dispatch at the required resolution. Annual average prices cannot value hourly flexibility. Include round-trip losses, degradation and control limits.
Flexibility revenue should be included only where contracts or accessible markets exist. Technical capability alone does not create cash flow.
23. Value on-site and contracted power
On-site generation, direct wire and power purchase agreements can reduce price volatility and emissions exposure. Their value depends on profile, credit, curtailment, network charges and environmental attributes.
Compare fixed, indexed and merchant components. Include balancing, collateral and contract termination. A long power agreement can protect cost while becoming above-market if technology or tariffs change.
The plant valuation should treat the power contract and site asset together when they are economically inseparable.
24. Value carbon capture as a system
Carbon capture requires capture equipment, energy, compression, transport, storage, permits, monitoring and liability allocation. Valuing the capture unit alone can omit the infrastructure that determines viability.
Model capture rate, uptime, energy penalty, transport tariff, storage availability and credit or carbon benefit. A high nominal capture rate provides limited value when the system operates intermittently.
Stage capital around transport and storage certainty. The plant should not commit irreversible retrofit capital without a credible downstream chain.
25. Include grid and infrastructure constraints
A retrofit can be technically sound and commercially delayed by grid connection, pipeline, port, water or storage constraints. Connection rights and queue position can become material assets.
The model should include lead time, reinforcement cost, curtailment, security requirements and alternative supply. A temporary workaround may preserve option value.
Infrastructure assumptions need external evidence. A management intention to secure capacity is not equivalent to a contracted right.
26. Include shutdown and conversion cost
Closure creates redundancy, contract termination, inventory, remediation, dismantling, security and community costs. Conversion can require decontamination, demolition and new utilities before productive investment begins.
Model cash timing and legal responsibility. Provisions recognised for accounting may differ from the full economic cash exposure used in transaction value.
Land and infrastructure value should be assessed net of these costs. A valuable site can still have negative equity value when liabilities and debt exceed proceeds.
27. Assess useful life and residual value
Carbon, power and technology risk can shorten economic life before physical wear ends it. Review production plans, customer demand, permits, retrofit timing and replacement technology.
The IFRS Foundation notes that climate-related matters can affect estimated residual values and useful lives through obsolescence, legal restrictions or inaccessibility.[10] Financial reporting conclusions require application of the relevant standards to the actual facts.
Transaction models should avoid a terminal value beyond the period of credible competitiveness unless supported by a conversion or renewal case.
28. Separate recoverable amount and transaction value
Recoverable amount under IAS 36 is the higher of value in use and fair value less costs of disposal.[11] Transaction value reflects the negotiated economics, synergies, financing and protections of a buyer and seller.
A plant can pass an accounting impairment test while offering little strategic value to a particular buyer. A specialised buyer can also pay more because it controls lower-cost power or proprietary retrofit capability.
The board should reconcile the measures without treating them as interchangeable.
29. Identify impairment indicators
Indicators can include adverse regulation, falling demand, technology change, higher discount rates, lower market capitalisation, obsolescence, idling or performance below plan. Carbon and power conditions can affect several indicators simultaneously.
IFRS educational material states that climate-related matters may indicate impairment and can affect cash-flow assumptions used in recoverable-amount calculations.[12] It also emphasises reasonable and supportable assumptions.
The finance team should connect transition evidence to the formal reporting process and document the conclusion.
30. Define the cash-generating unit
An industrial site may contain several lines that share utilities, customers and logistics. The cash-generating unit should follow the applicable accounting requirements and the level at which independent cash inflows exist.
For strategy, model both the integrated site and separable lines. This reveals whether one unit is supported by another and whether a carve-out can create value.
Allocation of goodwill, shared assets and closure cost should be documented. Arbitrary allocation can mask the source of value erosion.
31. Build explicit cash flows
Forecast volume, price, raw materials, power, fuel, carbon, labour, maintenance, logistics, compliance, tax, working capital and sustaining capital. State the basis for each variable.
Model carbon and power at the plant's actual exposure rather than as a generic margin haircut. Include contract resets, allowance changes and retrofit downtime in the correct year.
Avoid burying transition risk only in the discount rate. Explicit cash-flow effects allow the board to see and manage the drivers.
32. Select the discount rate consistently
The discount rate should match currency, inflation, cash-flow risk and valuation basis. Risks already reflected in expected cash flows should not be duplicated without justification.
Transition uncertainty can affect financing cost, terminal value and scenario weighting. It can also create asymmetric outcomes that a single rate represents poorly.
Use scenario analysis for major discrete outcomes and a rate consistent with each cash-flow set. Document the approach and sensitivity.
33. Model debt and covenant effects
Carbon and power shocks can reduce EBITDA, debt-service coverage and borrowing base. Retrofit capital can increase leverage before savings appear. Covenants may become the binding constraint before equity value reaches zero.
Review financial definitions, permitted debt, capital expenditure, hedging, distributions and material adverse change provisions. Lenders may require updated technical and environmental diligence.
The model should show covenant headroom by year and the liquidity required for downside cases.
34. Review supply and customer contracts
Long-term supply contracts can protect inputs or create above-market obligations. Customer contracts can support revenue or permit rapid repricing and exit. Change-in-law clauses determine how carbon and border costs are shared.
Review volume, price, index, credit, force majeure, termination, assignment and renewal. Model contract exposure separately from merchant assumptions.
In an acquisition, representations should cover emissions data, allowances, CBAM reporting, power contracts and customer claims.
35. Test product-market resilience
Demand can shift toward lower-emissions materials through regulation, procurement standards or customer targets. A plant may retain volume with a discount or capture a premium through verified lower-carbon output.
Segment customers by willingness and ability to pay, qualification requirements and switching cost. Avoid extrapolating a pilot premium across all volume.
The market case should include substitute products and imports. Border protection can support domestic pricing while customer demand changes independently.
36. Benchmark geography
Compare delivered energy, carbon, labour, raw material, logistics, tax, reliability and policy support across relevant regions. A plant competes on total delivered cost and quality.
The IEA reports significant regional electricity-price differences for energy-intensive industry.[4] Carbon-pricing coverage and rates also vary widely.[5][6] Geography is therefore a structural valuation variable.
Benchmarking should use comparable products, utilisation and input quality. Headline national averages can misstate a specific site's cost.
37. Value operational optionality
Options include reduced campaigns, product switching, fuel switching, temporary idling, tolling, asset conversion, equipment sale and land redevelopment. Each option has trigger, cost, lead time and reversibility.
Option value falls when permits expire, skills leave, maintenance is deferred or infrastructure rights lapse. Preserving optionality requires deliberate expenditure.
The board should identify the last responsible decision date for each pathway. Waiting beyond that date can turn a choice into a forced closure.
38. Compare operate, hedge, retrofit, convert, sell and retire
Each pathway should use the same market, policy and financing scenarios. Compare present value, capital at risk, time to cash, execution probability and downside.
Operate can be optimal when current margin and contracts cover exposure. Hedge can bridge a temporary dislocation. Retrofit requires evidence of technical performance and customer value. Conversion depends on site advantage. Sale depends on buyer-specific value. Retirement limits future loss while crystallising closure cost.
The recommendation should identify the conditions that change the preferred pathway.
39. Apply transaction diligence
Buyers should reconcile emissions, energy, production and financial data. Test meters, allowances, grid rights, customer contracts, environmental liabilities, permits and retrofit estimates.
The diligence model should bridge reported EBITDA to transition-adjusted cash flow. It should identify which exposures are transferred through price, indemnity, escrow, earn-out or condition precedent.
Technical uncertainty can support staged consideration or contingent value rather than an unsupported point estimate.
40. Structure acquisition protection
Purchase-price adjustments can address working capital, debt, carbon liabilities and committed capital. Specific indemnities can cover historic non-compliance or inaccurate emissions reporting. Escrow can protect claims.
An earn-out can link value to realised margin, customer premium or retrofit performance. The metric must be controllable and auditable. Operational covenants should preserve the asset between signing and closing.
Conditions can include permits, power contracts, financing, customer consents and verified baseline data. Protection should match the identified risk.
41. Finance transition capital
Transition capital can be funded through corporate debt, project finance, leasing, service agreements, grants, guarantees or customer commitments. The structure should follow cash-flow visibility and asset separability.
Senior debt should rely on contracted or resilient cash flow after carbon and power stresses. Equity should bear technology, market and residual-value uncertainty. Public support should address a defined gap.
Financing terms should preserve flexibility to close or convert if the base pathway fails.
42. Create a transition reserve
A reserve can fund compliance, hedging collateral, major maintenance, retrofit development and controlled shutdown. Its size should follow quantified exposure and decision timing.
Restricted cash reduces equity value but can prevent a distressed outcome. The model should show reserve funding and release conditions.
A reserve cannot make a structurally uncompetitive plant economic. It buys time for a credible action.
43. Monitor leading indicators
Track product margin after carbon and power, emissions intensity, free allocation, hedge coverage, grid availability, customer premium, retrofit milestones, covenant headroom and closure exposure.
Indicators should have thresholds and named actions. A dashboard without decision rights becomes reporting rather than governance.
Refresh the transition ledger when policy, contracts or operating data change. Annual valuation alone can miss a rapid margin shift.
44. Use a stage-gated retrofit programme
Begin with data validation and concept design. Proceed to engineering after confirming the commercial problem. Commit long-lead equipment after securing permits, infrastructure, funding and customer value.
Each gate should specify evidence, capital limit, owner and expiry. Cost escalation, weaker power economics or delayed infrastructure should trigger reapproval.
Stage gates preserve options and reduce sunk-cost pressure. They also create credible milestones for lenders and boards.
45. Establish decision rights
Management can execute hedges, maintenance and approved development within limits. The board should reserve decisions that change capacity, debt, useful life, closure, major retrofit or transaction perimeter.
Material changes in carbon policy, power contracts, customer commitments, capital cost or impairment assumptions should return to the appropriate authority.
The governance record should state assumptions and evidence. It should also identify management-estimated inputs requiring verification.
46. Prepare the board valuation bridge
Bridge from conventional enterprise value to transition-adjusted value through carbon cost, power premium, volume effect, compliance capital, retrofit value, closure cost and residual optionality. Avoid one undifferentiated discount.
Show which adjustments arise from current facts and which arise from scenarios. The bridge should reconcile to the detailed model.
The board can then see whether value erosion is caused by operations, policy, financing or terminal assumptions and select the relevant action.
47. Apply the investment gate
Investment requires a verified technical baseline, current policy map, product-level margin, infrastructure rights, credible capital estimate, funding, customer evidence and downside coverage. Each requirement should have documentary support.
The approval paper should state what remains uncertain and who bears it. Hypothetical scenarios inform the decision without being presented as forecasts.
Approval should expire if financial close or construction notice does not occur by a stated date. Changed facts require revalidation.
48. Define the final mandate
The mandate should authorise one or more pathways with triggers. It can approve continued operation within exposure limits, retrofit development through a gate, preparation for sale or an orderly retirement plan.
It should specify carbon and power thresholds, capital limits, debt constraints, customer requirements, reserve funding and reporting. It should name the authority for routine action and reapproval.
A precise mandate converts transition risk from an abstract concern into a controlled capital-allocation process.
Conclusion
An industrial plant is economically stranded when its expected cash flow no longer supports the capital, obligations and risk required to operate competitively. Carbon prices, electricity costs, border adjustments and technology can accelerate that point while the equipment remains productive.
Valuation should begin at product and plant level. It should model carbon, free allocation, electricity, network, border and customer effects explicitly by year. It should distinguish policy in force from scenarios and connect technical choices to cash flow.
Retrofit options deserve value only after their cost, timing, infrastructure and commercial benefit are evidenced. Accounting impairment, transaction value and strategic value should be reconciled while remaining distinct measures. Debt capacity follows resilient cash flow, with equity and reserves carrying unresolved uncertainty.
The board's practical choices are operate, hedge, retrofit, convert, sell or retire. Early measurement and stage-gated capital preserve those choices. Delay without evidence can consume optionality and leave closure as the only remaining action.
Decision exhibits
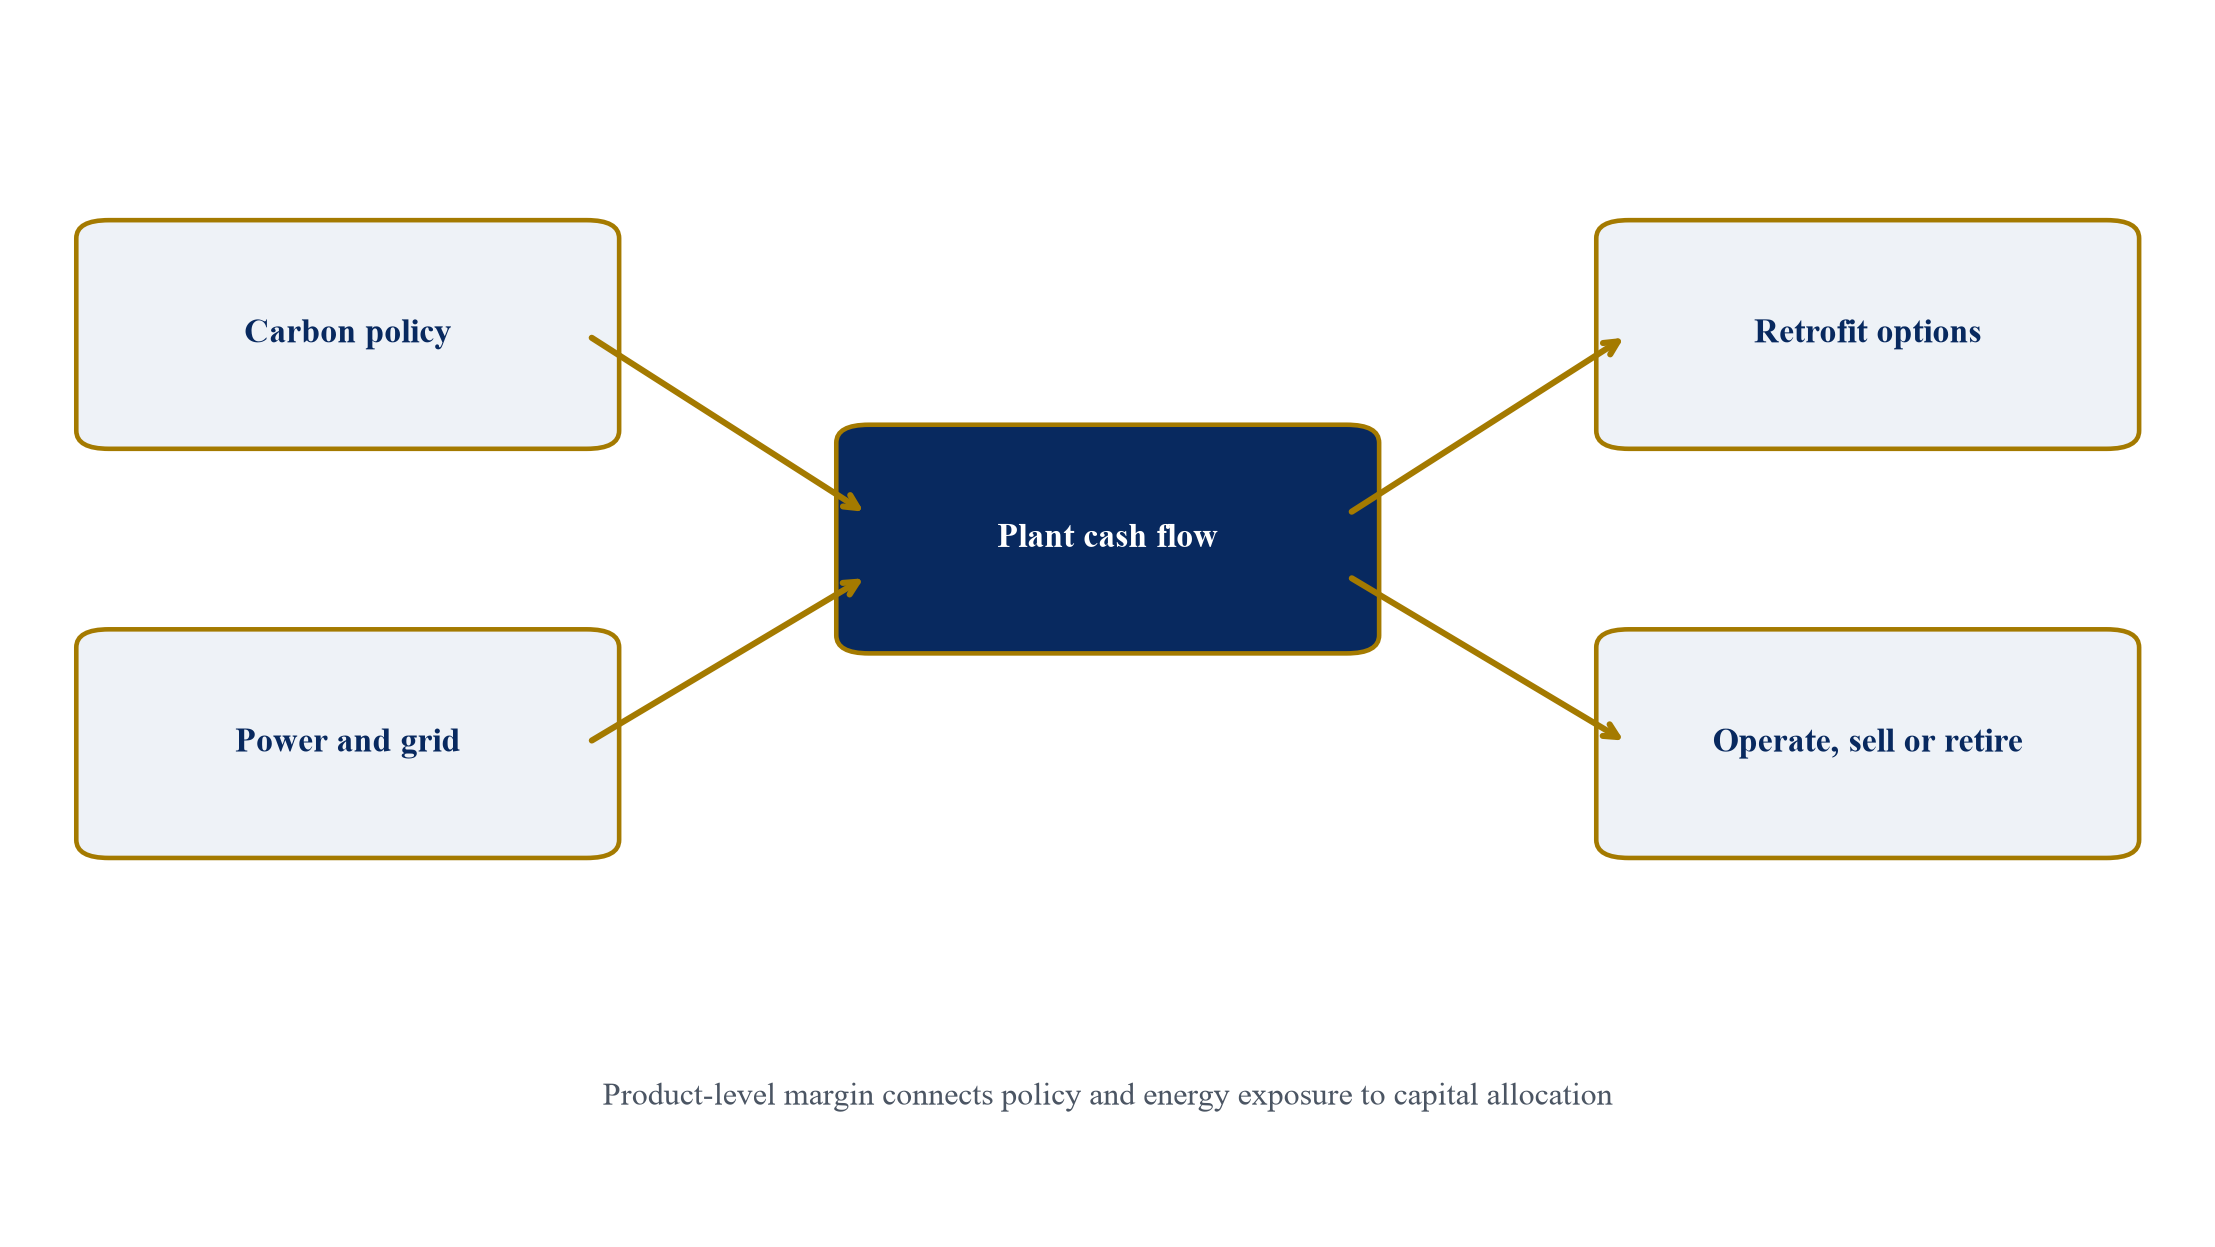
Proposed valuation architecture based on the sources and analysis in this paper.
Table 1. Industrial transition-risk benchmark
| Exposure | Evidence required | Cash-flow treatment | Management response |
|---|---|---|---|
| Direct carbon | verified emissions, allowances and price | annual uncovered emissions cost | efficiency, fuel switch, capture or closure |
| Electricity | tariff, load shape, hedge and network charges | delivered power cost by year | hedge, PPA, flexibility or relocation |
| Border adjustment | product code, destination and embedded emissions | price, volume or compliance effect | data, customer terms and product strategy |
| Customer transition | contract, premium and qualification | realised price and volume | pass-through, low-carbon product or portfolio change |
| Technology | commercial benchmark and retrofit evidence | capex, downtime and operating effect | stage-gated retrofit, conversion or sale |
Proposed qualitative benchmark; applicable law, accounting standards and transaction documents control.
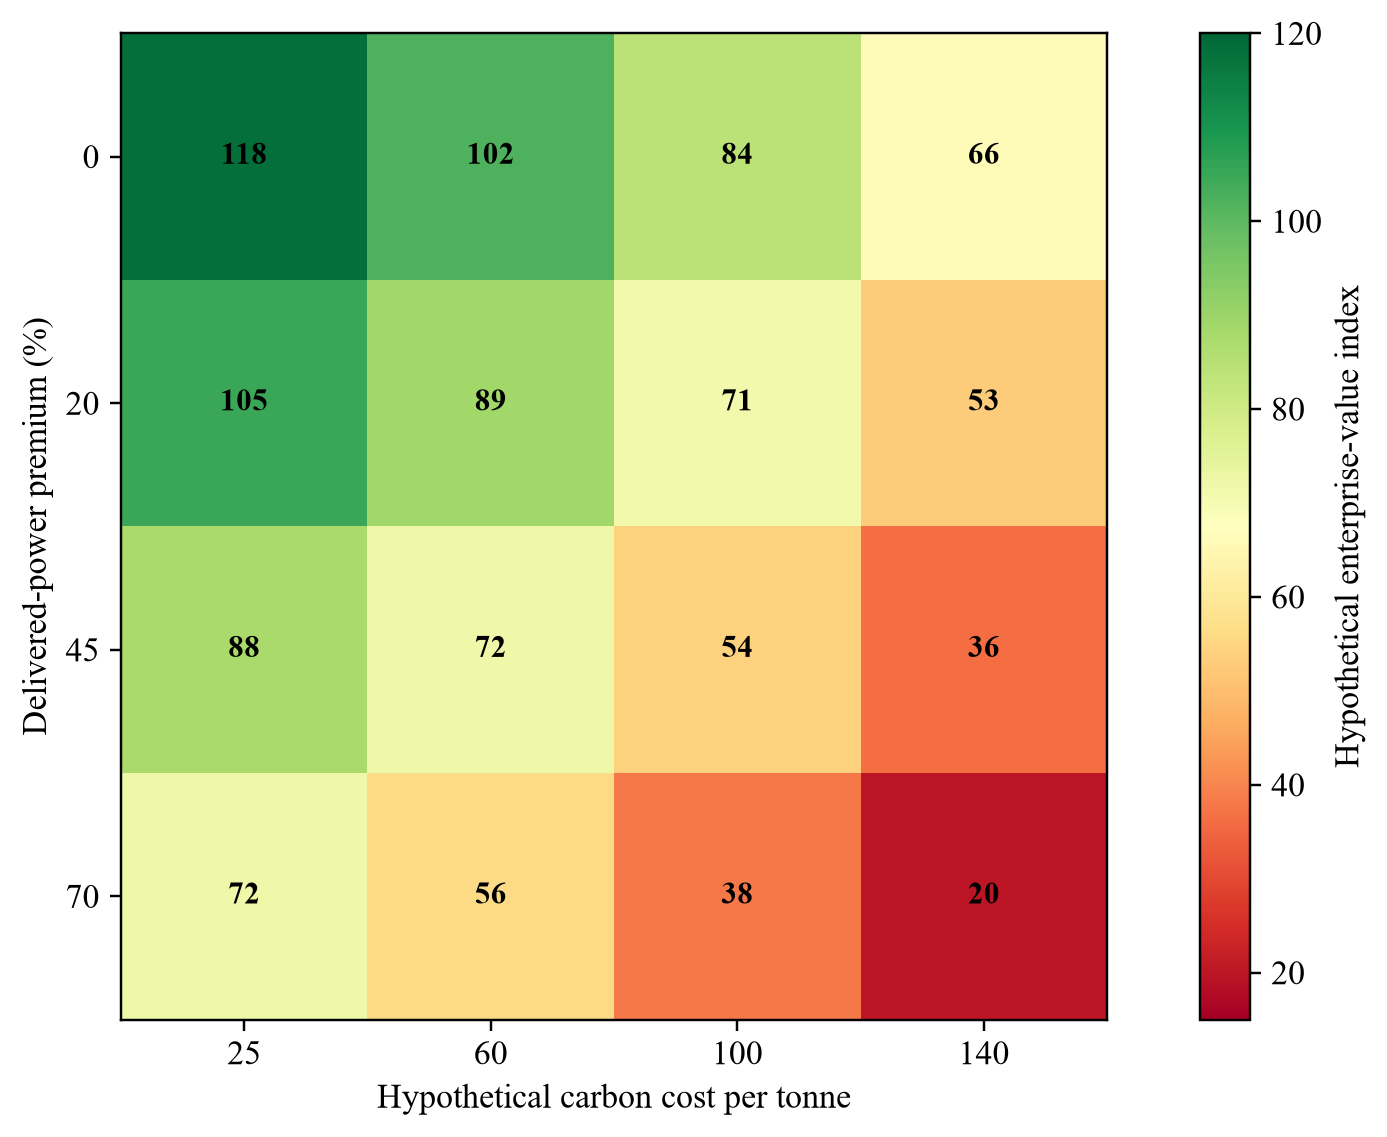
Wholly hypothetical; values describe no identified company or transaction.
Table 2. Hypothetical transition-adjusted valuation bridge
| Valuation item | Hypothetical value units | Evidence required |
|---|---|---|
| Conventional operating value | 120 | normalised production, price and operating cost |
| Net carbon-cost adjustment | -18 | verified emissions, allocation and price path |
| Power-price and grid adjustment | -14 | tariff, hedge, network and load profile |
| Border and customer adjustment | -8 | destination, contract pass-through and demand |
| Approved retrofit net value | 11 | capital, schedule, performance and commercial benefit |
| Closure and remediation | -9 | legal scope, engineering estimate and timing |
| Residual site optionality | 7 | land, permits, grid rights and conversion evidence |
| Transition-adjusted value | 89 | reconciled model output |
Illustrative value units only; the bridge describes no identified plant or transaction.
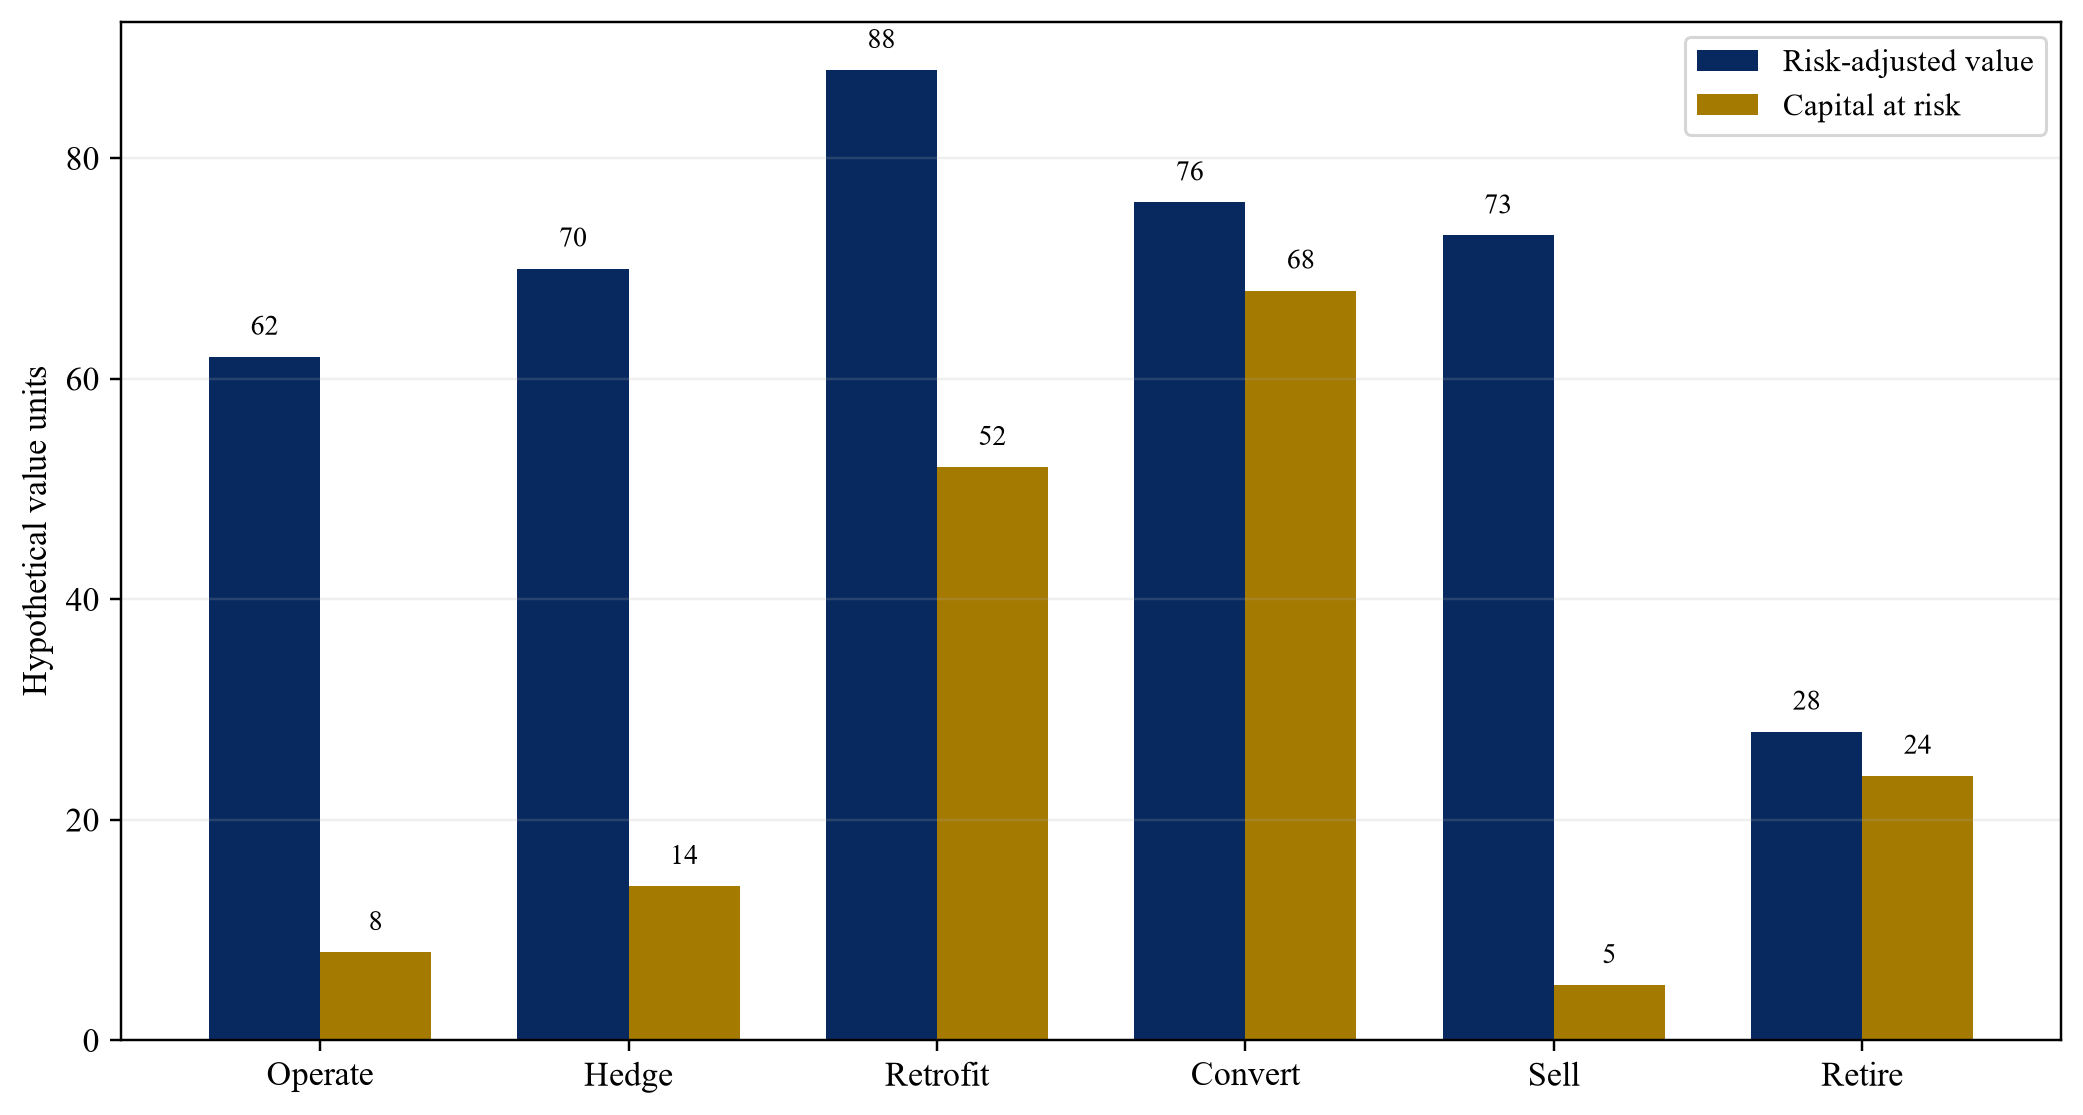
Wholly hypothetical; values describe no identified company or transaction.
Table 3. Strategy gates for an exposed industrial plant
| Gate | Minimum evidence | Decision | Maximum cumulative capital at risk |
|---|---|---|---|
| Exposure screen | plant emissions, energy, policy and margin | continue analysis or stabilise | 0.2% |
| Pathway design | technical options, customers and infrastructure | operate, hedge, retrofit, convert, sell or retire | 1.0% |
| Investment case | verified capex, contracts, permits and funding | select preferred pathway | 4.0% |
| Final approval | executed finance, delivery security and downside coverage | commit capital | 100% |
| Commissioning or transaction | acceptance, transfer and operating readiness | release retained capital | retained capital |
| Post-action review | realised margin, emissions and covenants | optimise, expand or exit | next approved budget |
Proposed governance framework; percentages are hypothetical caps on cumulative capital at risk.
Appendix A Questions for the investment committee
1. Which plant, production lines, shared assets and liabilities are inside the valuation perimeter?
2. Which carbon, electricity and border rules are currently in force?
3. Which policy assumptions remain scenarios and who approved them?
4. What are emissions and delivered-power cost per product and destination?
5. How do free allocation, hedges and customer pass-through change by year?
6. Which carbon and power combinations make the plant uneconomic or breach covenants?
7. Which retrofit options have verified cost, timing, performance and infrastructure?
8. Which customers contractually pay for carbon cost or lower-emissions output?
9. What are the shutdown, remediation and conversion cash costs?
10. How do recoverable amount, transaction value and strategic value reconcile?
11. What is the last responsible decision date for each pathway?
12. Which changes require management action or board reapproval?
References
- European Commission, CBAM definitive regime, accessed 2 October 2026. https://taxation-customs.ec.europa.eu/carbon-border-adjustment-mechanism/cbam-definitive-regime_en
- European Commission, Allocation to industrial installations under the EU ETS, accessed 2 October 2026. https://climate.ec.europa.eu/areas-action/carbon-markets/eu-emissions-trading-system-eu-ets/free-allocation/allocation-industrial-installations_en
- HM Revenue and Customs and HM Treasury, Carbon Border Adjustment Mechanism, updated 2026. https://www.gov.uk/government/publications/introduction-of-carbon-border-adjustment-mechanism/carbon-border-adjustment-mechanism
- International Energy Agency, Electricity 2026: Prices, 2026. https://www.iea.org/reports/electricity-2026/prices
- World Bank, State and Trends of Carbon Pricing 2025, 2025. https://openknowledge.worldbank.org/bitstreams/c65f581d-d94b-4f3f-91fc-c0f3250650df/download
- OECD, Effective Carbon Rates 2025, 13 November 2025. https://www.oecd.org/en/publications/effective-carbon-rates-2025_a5a5d71f-en/full-report.html
- International Energy Agency, Energy Technology Perspectives 2026: Executive Summary, 2026. https://www.iea.org/reports/energy-technology-perspectives-2026/executive-summary
- International Energy Agency, Businesses See Competitive Value of Energy Efficiency, 25 March 2026. https://www.iea.org/commentaries/businesses-see-competitive-value-of-energy-efficiency-but-smaller-firms-struggle-to-access-solutions
- International Energy Agency, Renewables for Industry, 23 December 2025. https://www.iea.org/reports/renewables-for-industry
- IFRS Foundation, Effects of Climate-related Matters on Financial Statements, June 2023. https://www.ifrs.org/content/dam/ifrs/supporting-implementation/documents/effects-of-climate-related-matters-on-financial-statements.pdf
- IFRS Foundation, IAS 36 Impairment of Assets, accessed 2 October 2026. https://www.ifrs.org/issued-standards/list-of-standards/ias-36-impairment-of-assets/
- IFRS Foundation, IAS 36 Supporting Material, accessed 2 October 2026. https://www.ifrs.org/supporting-implementation/supporting-materials-by-ifrs-standards/ias-36/
- International Energy Agency, Can Low-temperature Heat in Factories Be Electrified Competitively?, 9 December 2025. https://www.iea.org/commentaries/can-low-temperature-heat-in-factories-be-electrified-competitively
- UK Government, UK Emissions Trading Scheme: A Policy Overview, updated 2026. https://www.gov.uk/government/publications/uk-emissions-trading-scheme-uk-ets-policy-overview/uk-emissions-trading-scheme-uk-ets-a-policy-overview
About the Author
Authored by Chennakeshav Adya Independent Researcher
Chennakeshav (CK) is a corporate finance and investment banking executive with 25+ years of global experience in deal origination, structuring and execution across M&A, growth capital and corporate strategy. He has led value-creation mandates for founders, corporates and funds — bridging the boardroom view to hands-on execution and close.
His career spans Morgan Stanley, HSBC, Lloyds Banking Group, EWEC, ADQ portfolio companies and Emirates Growth Fund, across TMT, real estate, fintech, deeptech, cleantech, infrastructure and energy. He has partnered with C-suite leaders, private equity and venture funds, sovereign wealth funds and family offices to finance complex fund raises and scale-up ventures, and has led M&A due diligence, post-merger integration and business-transformation initiatives to create value.
At Matchpoint Partners he is Managing Partner, leading the firm's corporate finance, M&A and capital-raising practice. He holds an MBA from London Business School, an engineering degree from VTU and a Master of Laws (LLM, in progress) from UCL London.
An active start-up mentor, CK mentors at Techstars, DIFC FinTech Hive, Startup Grind, Founder Institute and IN5, serves as Entrepreneur Mentor in Residence (EMiR) at London Business School, and judges the Entrepreneurship World Cup.
Matchpoint profile: https://www.matchpoint-partners.com/team/ck-adya.html LinkedIn: https://www.linkedin.com/in/ckadya/
