

1. Define the acquisition decision
The buyer must decide how much value to assign to a GCC adaptation-technology business whose outputs may influence asset design, operations, maintenance, emergency response, insurance, capital allocation and public planning. The valuable asset is a controlled decision and implementation system. A high-resolution hazard map has limited transaction value when the buyer cannot establish its purpose, local calibration, asset connection, action history and financial outcome.
Adaptation analytics serve different decisions. Regional screening can prioritise assets. A heat forecast can change work or cooling schedules. A flood model can guide drainage investment. A water model can rank supply and efficiency measures. A digital twin can test equipment operation. Each use requires distinct evidence and tolerates different error.
The framework tests six propositions. Regional data and rights are transferable. Models are fit for place, asset and horizon. Vulnerability and consequence are explicit. Recommendations enter an authorised engineering workflow. Outcomes are measured against a defensible baseline or scenario. Revenue persists after procurement, concentration, service effort and integration cost. Failure at one layer changes transaction value.
Table 1. Evidence required before GCC adaptation technology receives transaction value
| Evidence layer | Core question | Minimum record | Transaction consequence |
|---|---|---|---|
| Regional hazard | What climate condition matters? | Source, location, date, scale and limitation | Defines screening relevance |
| Asset vulnerability | How can the asset fail or degrade? | Design, condition, threshold and consequence | Defines operational exposure |
| Model | Is the output fit for the decision? | Purpose, version, validation and uncertainty | Supports technical reliance |
| Workflow | Who reviews and acts? | Authority, threshold, action and override | Supports practical use |
| Outcome | What changed relative to baseline? | Service, cost, downtime, safety or capacity | Supports customer value |
| Economics | Does verified use produce scalable cash? | Renewal, effort, margin and collection | Supports transaction value |
Hazard, asset, workflow and commercial evidence should be tested together.
2. Separate hazard, exposure, vulnerability and consequence
Climate risk is not one score. Hazard describes heat, humidity, drought, flood, storm, sea level or another physical condition. Exposure identifies people, equipment, buildings, networks and services in the affected place. Vulnerability describes how exposed assets respond. Consequence adds service interruption, safety, repair, revenue, social impact and recovery.
The inaugural WMO State of the Climate in the Arab Region reports that 2024 was the region's hottest year on record and describes intensifying heat, drought and extreme rainfall. It also notes that the region contains many of the world's most water-scarce countries. These regional findings establish strategic relevance. They do not prove a particular asset's vulnerability or avoided loss.
Diligence should map every product output to these four layers. A heat index should not be presented as equipment failure probability without asset evidence. A flood depth should not be presented as financial loss without damage, service and recovery assumptions. Value should follow the controlled decision chain that the buyer can reproduce.
3. Define the adaptation stack
The adaptation stack begins with observations and scenarios. It adds geospatial processing, hazard models, asset registers, vulnerability functions, decision rules, workflow integration and implementation. Customer value can fail at any interface. Better climate data do not create value when assets are incorrectly located or users cannot act.
The buyer should inventory the target's role. Some firms own regional data pipelines. Others provide models, software, engineering, sensors, implementation or managed services. The commercial and risk profile differs. Licensed satellite data and open climate scenarios can support a proprietary workflow without becoming proprietary assets themselves.
The transaction case should identify which layers are transferable and which depend on founders, partners or customer data. It should record how the stack reaches operating systems and capital plans. A broad platform claim should be decomposed into products, users, decisions and implementation responsibilities.
4. Build the regional data register
GCC adaptation platforms can use meteorological stations, reanalysis, remote sensing, radar, hydrology, groundwater, sea level, terrain, land cover, utility networks, building systems, equipment sensors and incident records. Each source has an owner, licence, spatial scale, update cycle, latency, uncertainty and permitted use. The register should connect material features to source, transformation and production version.
Regional data can be sparse or uneven across countries and hazards. Reanalysis can fill spatial gaps while smoothing local extremes. Satellite products can improve coverage while requiring ground validation. Private asset and incident data may carry confidentiality, residency and change-of-control restrictions.
Diligence should reproduce selected data flows from raw record to customer output. It should test units, time zones, coordinate systems, missingness, station moves, sensor drift and boundary changes. Data rights and refresh costs belong in the transaction model. Geographic coverage should be valued only where the target can support current, lawful and reproducible use.
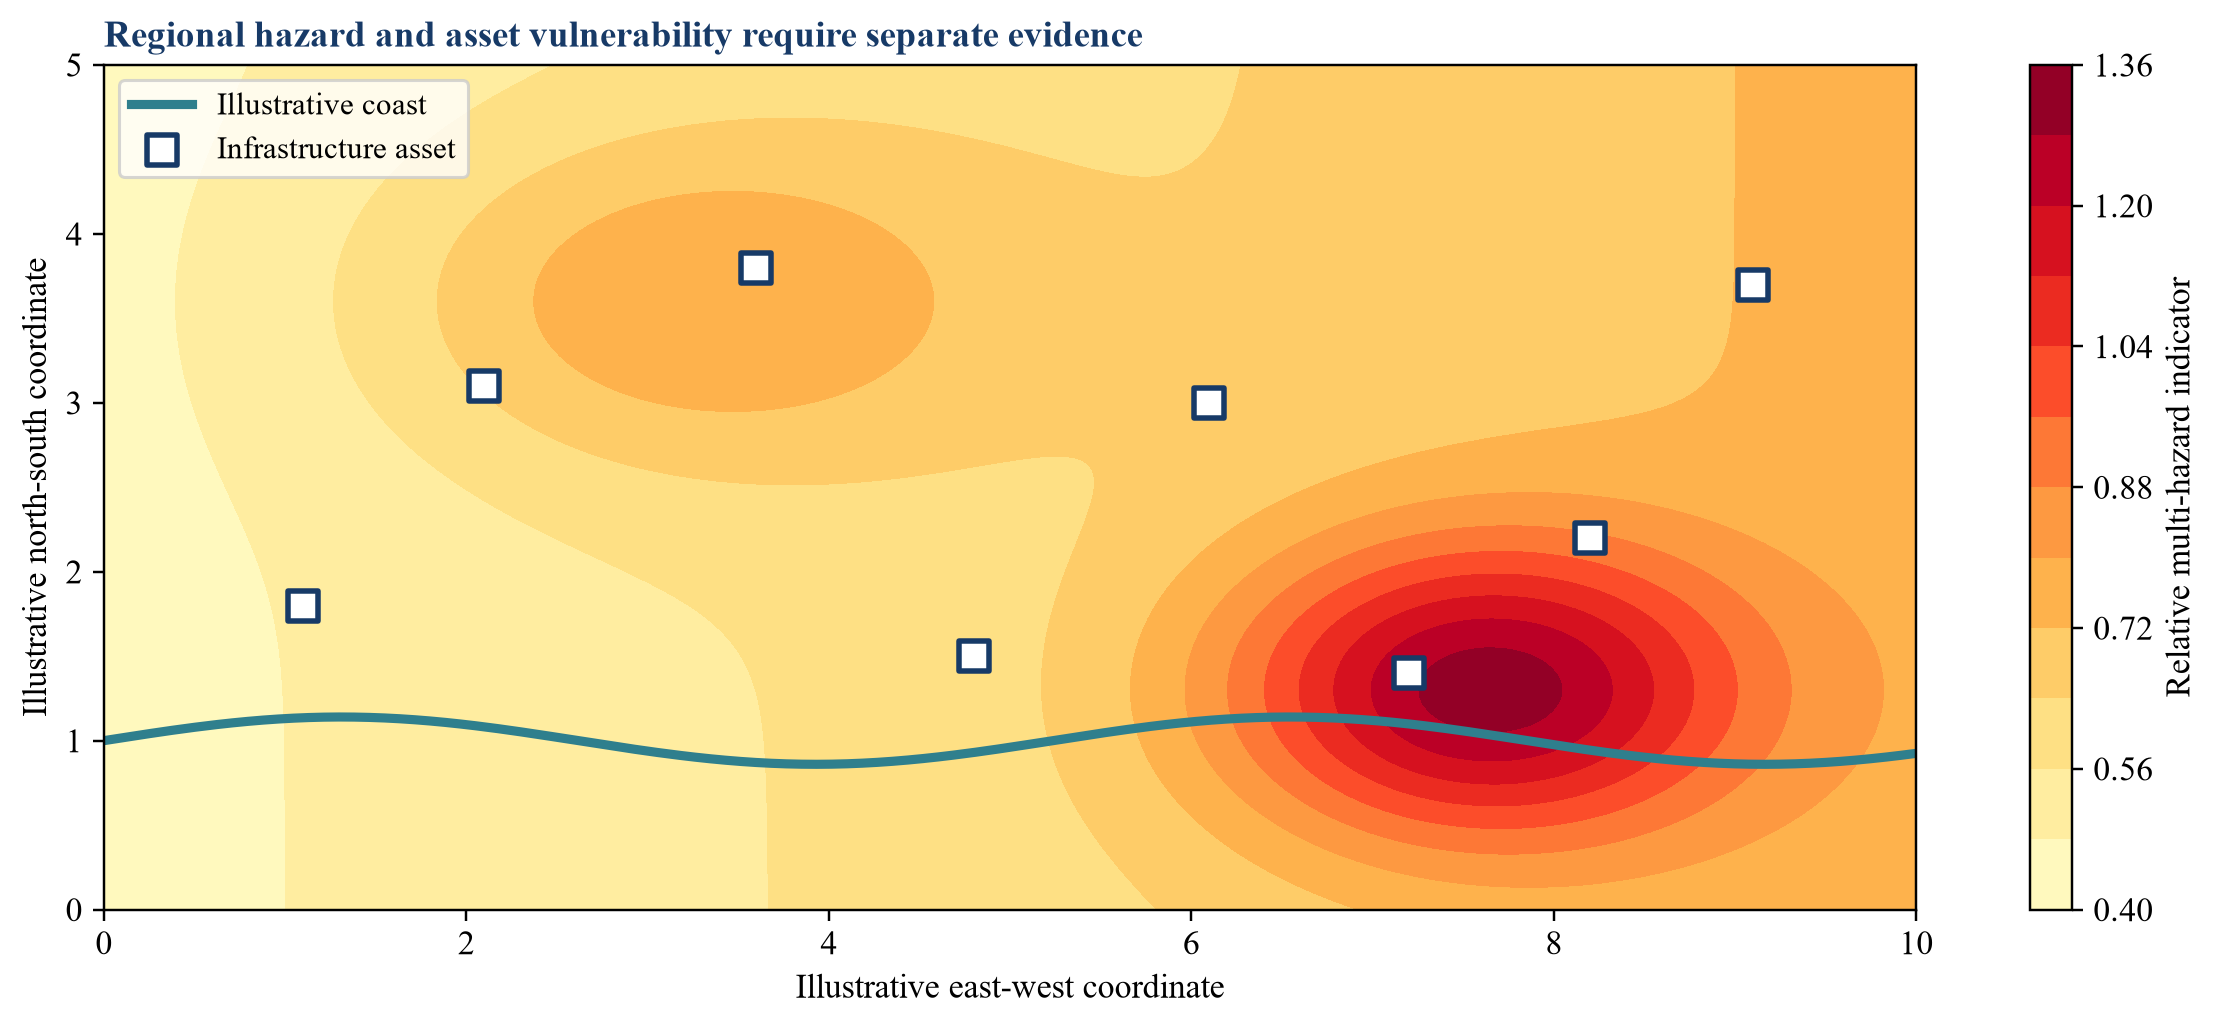
The visual separates regional hazard screening from asset exposure; it is illustrative and not a geographic forecast.
5. Match resolution to the asset decision
Resolution can be mistaken for accuracy. A fine grid creates a precise-looking output even when observations, terrain, drainage or asset condition are represented at coarser scale. Regional screening may tolerate broad units. Substation protection, road drainage and building cooling require local geometry and engineering data.
The target should state the native resolution of every input, model and output. Downscaling should preserve method, validation and limitation. Diligence should test boundary effects and sensitivity to location error. Coastal, urban and mountainous microclimates can differ materially from regional averages.
The buyer should compare model resolution with the decision threshold. A local intervention should not rely solely on a regional scenario. A portfolio ranking can use broader evidence if uncertainty is explicit. Market expansion to a new city or country is a new calibration question rather than automatic proof of portability.
6. Match time horizon to the promise
Adaptation decisions range from hourly operations to multidecade capital design. Weather forecasts can guide work schedules and cooling dispatch. Seasonal outlooks can support readiness. Climate scenarios can test long-lived assets. These outputs are not interchangeable.
The product should state forecast horizon, issue time, cutoff, refresh and uncertainty. It should separate current observation, weather forecast, historical climatology and climate projection. Scenario choice should be visible in capital analysis. A thirty-year asset decision should not appear deterministic because one scenario and one model were selected.
The acquirer should inspect how customers use each horizon and whether contracts promise accuracy, availability or decision support. The model's commercial value depends on alignment with customer planning and renewal cycles. Ongoing updates may support recurring revenue, while one-off scenario studies behave more like professional services.
7. Establish the asset and dependency register
Adaptation value depends on the assets and services at risk. The target should maintain identifiers, location, owner, design standard, age, condition, replacement value, criticality, dependencies and recovery requirements. A site can depend on power, water, telecoms, transport, cooling and labour beyond its boundary.
The register should distinguish customer-provided, observed and inferred attributes. Missing condition data can dominate uncertainty. Digital twins and computer vision can improve estimates, but inferred values should remain identifiable and validated against inspections.
Diligence should test representative assets and cross-system dependencies. A desalination plant may rely on coastal intake, grid power and chemical supply. A data centre may rely on cooling, water, grid and fibre. Transaction value follows the target's ability to connect hazard to real operational dependencies rather than the number of mapped points.
8. Model heat and humidity as operational variables
Heat affects people, buildings, networks, equipment and demand. Humidity changes human heat stress and cooling performance. Solar radiation, wind, urban form and nighttime temperature can also matter. One dry-bulb temperature does not capture every consequence.
The platform should select metrics for the decision. Worker scheduling can require heat-stress measures and applicable occupational controls. Equipment can require component temperature and derating curves. Buildings can require cooling load, indoor conditions and envelope performance. Power systems can require demand and capacity analysis.
The IEA identifies cooling as a major source of future electricity demand and peak load in the Middle East and North Africa. This supports investment relevance. The buyer should still verify customer-specific load, asset thresholds and realised action. A regional cooling trend does not establish one vendor's savings or resilience value.
9. Model water security as a system
GCC water security can involve desalination, groundwater, recycled water, storage, distribution, demand and power. Heat and drought can raise demand. Marine conditions can affect intake and treatment. Power interruptions can affect production and pumping. The platform should represent the system rather than a single scarcity score.
WRI Aqueduct can support basin screening, while local supply and infrastructure evidence determine operational exposure. The UAE's climate reporting links adaptation with energy and water demand-side management. Diligence should identify source, capacity, storage, redundancy, quality, energy intensity and contractual priority.
The buyer should test whether the product changes operations, maintenance or investment. Avoided shortage and efficiency savings require different evidence. The valuation should separate measured cash savings, released capacity and scenario resilience. It should prevent a litre of reduced demand from being counted again as avoided outage value without a clear causal link.
10. Model intense rainfall and urban flood
Arid environments can experience severe rainfall and flash flooding. Flood risk depends on intensity, duration, terrain, drainage, soil, development, debris and maintenance. Historical averages can underrepresent changing extremes and rapid urbanisation.
The target should document rainfall inputs, hydrological method, terrain, drainage representation, calibration events and limits. Remote sensing and computer vision can update land cover or detect standing water. Those capabilities require ground validation and incident linkage.
Diligence should compare predicted depth or disruption with observed events and customer actions. A flood map can guide screening, while asset-level investment requires local surveys and engineering. The buyer should inspect false alarms, missed events and model changes after severe rainfall. Value follows improved readiness, design or recovery rather than map coverage alone.
11. Address coastal and marine exposure
Coastal infrastructure can face sea-level change, storm surge, waves, erosion, saline intrusion and warmer marine conditions. Ports, power and desalination assets can be exposed through direct inundation and operational dependencies. Coastal development also changes drainage and ecological buffers.
The platform should combine scenario, elevation, asset and engineering evidence. Vertical datum, subsidence and protection standards matter. A small elevation error can materially change a threshold result. Marine intake and discharge analysis requires specialised environmental and process evidence.
The acquirer should test whether the target provides screening, design support, monitoring or implementation. Each service has different liability, validation and margin. Long-horizon scenarios should remain scenarios. Transaction value should follow contracted decisions and transferable capability rather than the nominal value of all assets near a coastline.
12. Establish a model inventory
The target may use weather prediction, downscaling, hydrology, optimisation, digital twins, remote sensing, computer vision, anomaly detection and generative interfaces. It may rely on third-party climate models, geospatial data, engineering software and cloud services. The inventory should identify every production model, owner, purpose, version, customer deployment and dependency.
The NIST AI Risk Management Framework provides a practical structure through Govern, Map, Measure and Manage. Materiality should reflect the consequence of a wrong output. A dashboard ranking and an automated control recommendation require different assurance.
Rules, spreadsheets and engineer adjustments that materially change output belong in the inventory. Diligence should compare source control, model registry and production traffic. A complete inventory is a precondition for evaluating intellectual property, validation coverage, technical debt and integration cost.
13. Test development data and regional portability
Model performance depends on the relationship between development data and production use. GCC cities and assets differ in coastal influence, urban form, terrain, infrastructure, standards and maintenance. A large dataset can remain narrow if most labels come from one country, customer or event.
The target should document inclusion, exclusion, missing data, label construction and leakage controls. Randomly splitting nearby locations can leak common weather and infrastructure characteristics. Whole-city, whole-asset and temporal holdouts can provide stronger evidence.
Diligence should compare production customers with development and validation populations. Expansion across GCC countries is a new validation question when data, regulation or asset design differ. Market opportunity should remain separate from demonstrated portability. Local implementation partners can create value, while dependence and contractual transferability must be assessed.
14. Require independent validation
Validation should be independent of development in authority and evidence, with rigor proportionate to use. It should assess conceptual soundness, data, implementation, performance, limitations and monitoring. A single accuracy score does not establish fitness for an infrastructure decision.
Validation should use relevant events, seasons, assets and geographies. Rare extremes create small samples and unstable estimates. Engineering stress tests, scenario ranges and expert review may complement statistical testing. The target should disclose what remains unvalidated.
The buyer should reproduce headline metrics and inspect negative results. Validation records should show findings, severity, owners, closure and accepted limitations. Price should reflect validated use rather than the broadest marketing claim.
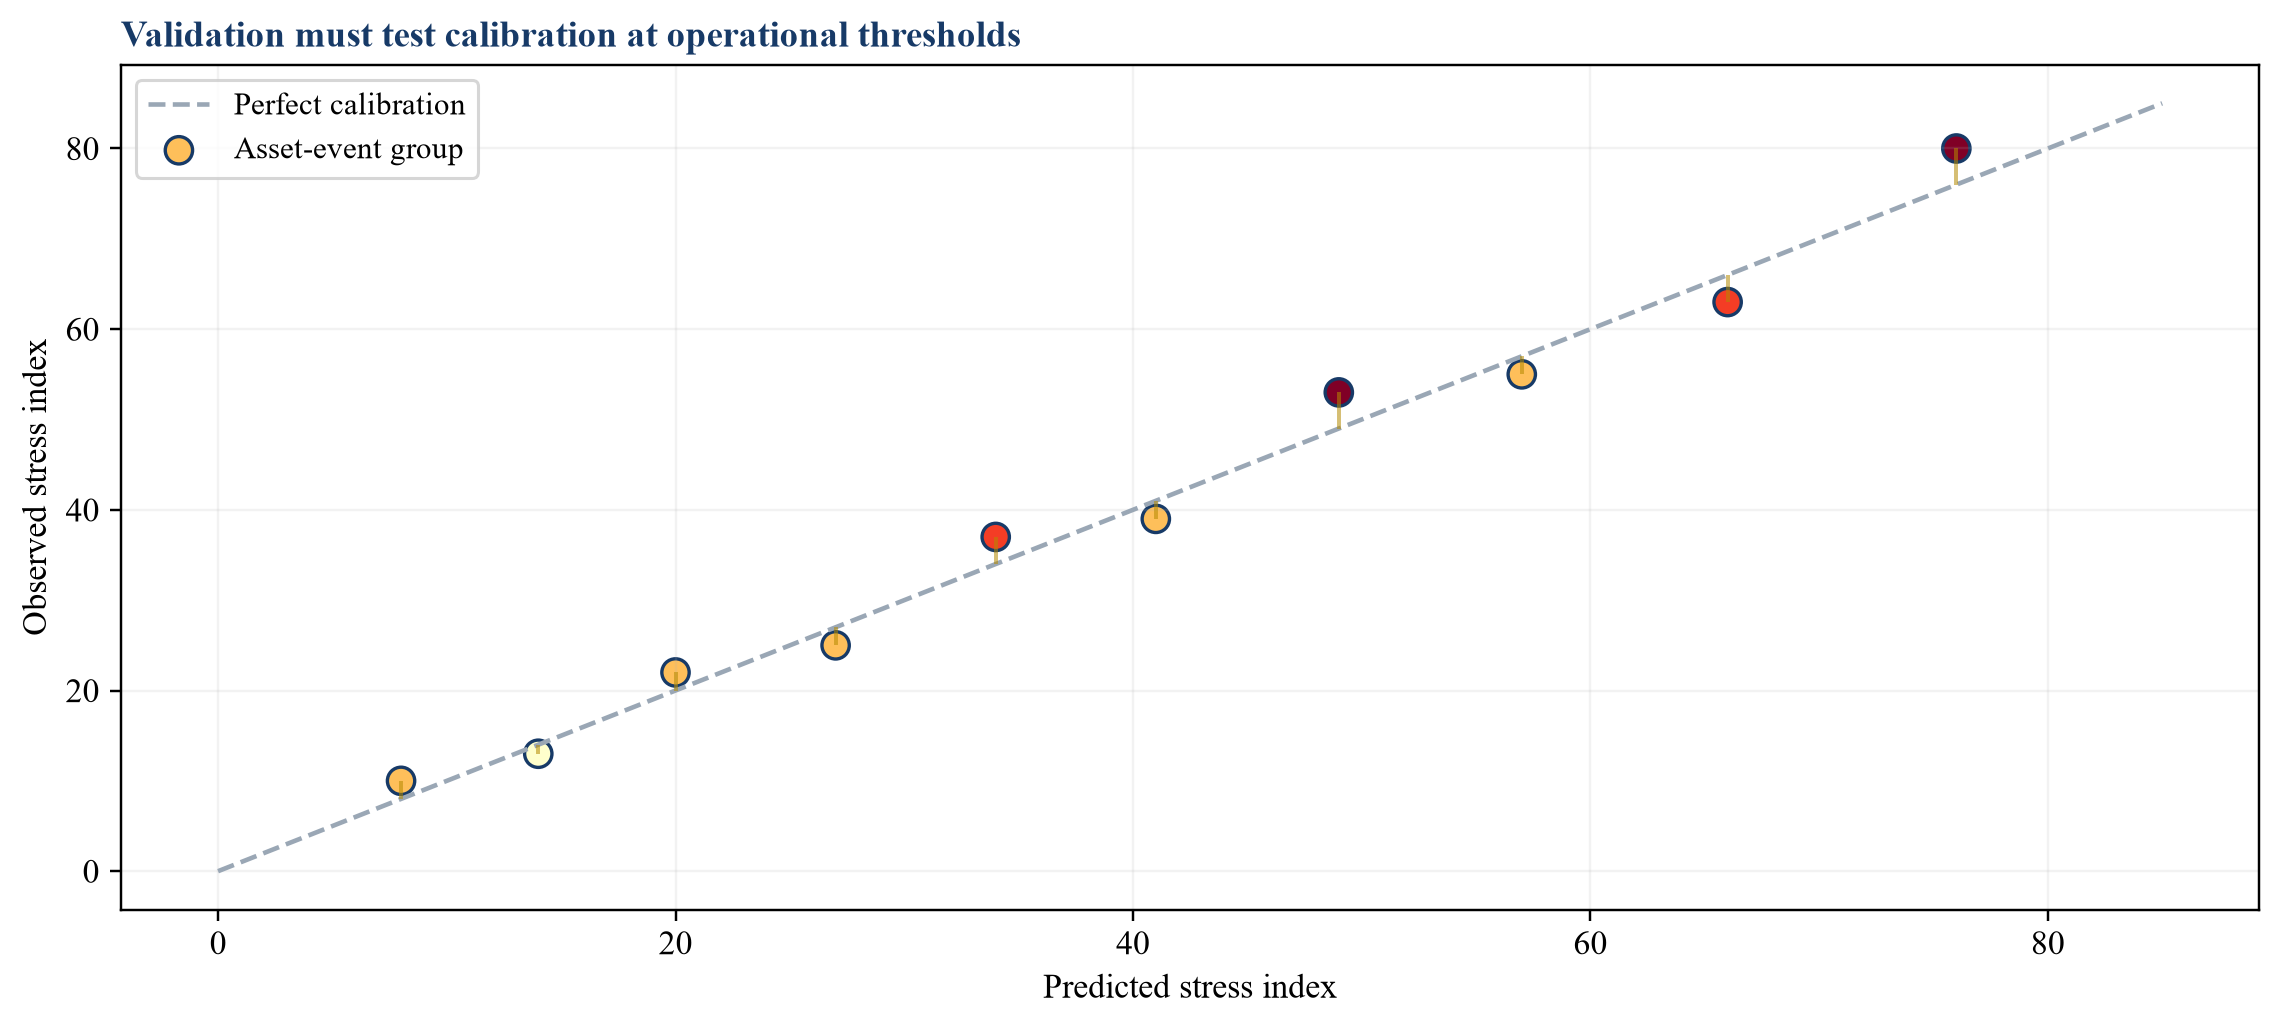
Values are hypothetical; validation should cover relevant assets, events and operating thresholds.
15. Quantify uncertainty and compound risk
Climate, asset and operational models contain inherent variability and knowledge uncertainty. Scenario choice, sparse observations, model form, asset condition and human response contribute uncertainty. A point estimate can conceal the range that matters to a capital decision.
Compound events require special care. Heat can coincide with high electricity demand. Flood can interrupt power, transport and telecoms together. Drought can raise water and cooling constraints. Dependencies can amplify consequences beyond one asset model.
The platform should provide uncertainty appropriate to use and avoid multiplying weak probabilities without validation. Diligence should inspect scenario ranges, sensitivity, dependence assumptions and tail treatment. The buyer should value decision usefulness under uncertainty rather than precision in a single output.
16. Monitor drift and regional change
Models can drift as climate, urbanisation, assets, maintenance, operating practice and data providers change. New construction can alter runoff and heat. Equipment upgrades can change vulnerability. Monitoring must separate input drift, model performance and policy change.
The target should define thresholds, review frequency, escalation, recalibration and retirement. Monitoring should cover missingness, station health, feature distributions, forecast residuals, alerts, overrides, incidents and outcomes. Severe-event learning should enter governance without allowing one event to drive uncontrolled changes.
The buyer should inspect change history and customer communication. Stable portfolio performance can conceal deterioration in a critical segment. Ongoing monitoring cost belongs in margin forecasts. A model requiring substantial engineer review can remain valuable, with economics different from automated software.
17. Control third-party data and model dependencies
Adaptation platforms often combine public climate scenarios, commercial weather, satellite imagery, engineering software, customer systems and cloud services. The buyer inherits continuity and licence dependencies. Contracts should be reviewed for assignment, change of control, field of use, audit, service level, derived data and termination.
The target should archive versions sufficient to reproduce decisions. A provider's methodology change can alter hazard scores and customer capital priorities. Black-box components can constrain explanation and validation.
Diligence should identify substitution cost and concentration. It should test outages, delayed feeds and schema changes. Valuation should separate proprietary capability from licensed inputs and customer configuration. Reported gross margin can decline when data providers reprice or customers require additional assurance.
18. Apply proportionate AI governance
AI governance should reflect consequence. A model that ranks inspection priorities differs from one that controls cooling or recommends infrastructure investment. The vendor should document purpose, data, development, performance, limitations, monitoring, security, human oversight and change.
Generative interfaces can improve access to technical records while introducing hallucination, retrieval and authority risks. They should not create engineering instructions without controlled sources and review. Marketing descriptions should align with the actual technology and evidence.
The acquirer should test whether the target can answer customer, regulator and insurer diligence consistently. Governance assembled separately for every tender creates service cost and inconsistency. Reusable evidence can support faster procurement and renewal. Governance readiness is therefore both a control and an operating capability.
19. Preserve engineering authority and overrides
Infrastructure decisions require clear authority. A model may recommend inspection, maintenance, operating limits or capital action. Engineers, operators and public authorities retain responsibility under applicable standards and law. The product should present source, uncertainty and limitation in a form that supports review.
Overrides are valuable evidence when they capture user, date, reason and outcome. High override rates can signal poor fit or stale configuration. Very low rates can signal automation bias or weak logging. The target should analyse both patterns.
The buyer should inspect permissions, escalation and audit trails. It should sample accepted and rejected recommendations and compare later evidence. Human review should not become an undocumented repair layer. The transaction model should include the engineering and local expertise required for responsible scale.
20. Connect prediction to operational workflow
The central commercial test is whether the model changes an authorised action. Relevant actions include dispatch, maintenance, work scheduling, load management, inspection, emergency preparation and service restoration. Each action should have an owner, threshold and completion record.
An alert has limited value when the customer cannot act because of procurement, staffing, regulation or asset constraints. The target should measure alert-to-review, review-to-action and action-to-outcome conversion. Repeatedly deferred recommendations should be visible.
The acquirer should build an outcome ledger linking model version, asset, decision, action, cost and result. It should distinguish model contribution from routine maintenance and other programmes. Customer value should follow completed actions and measured outcomes, with scenario value reported separately.
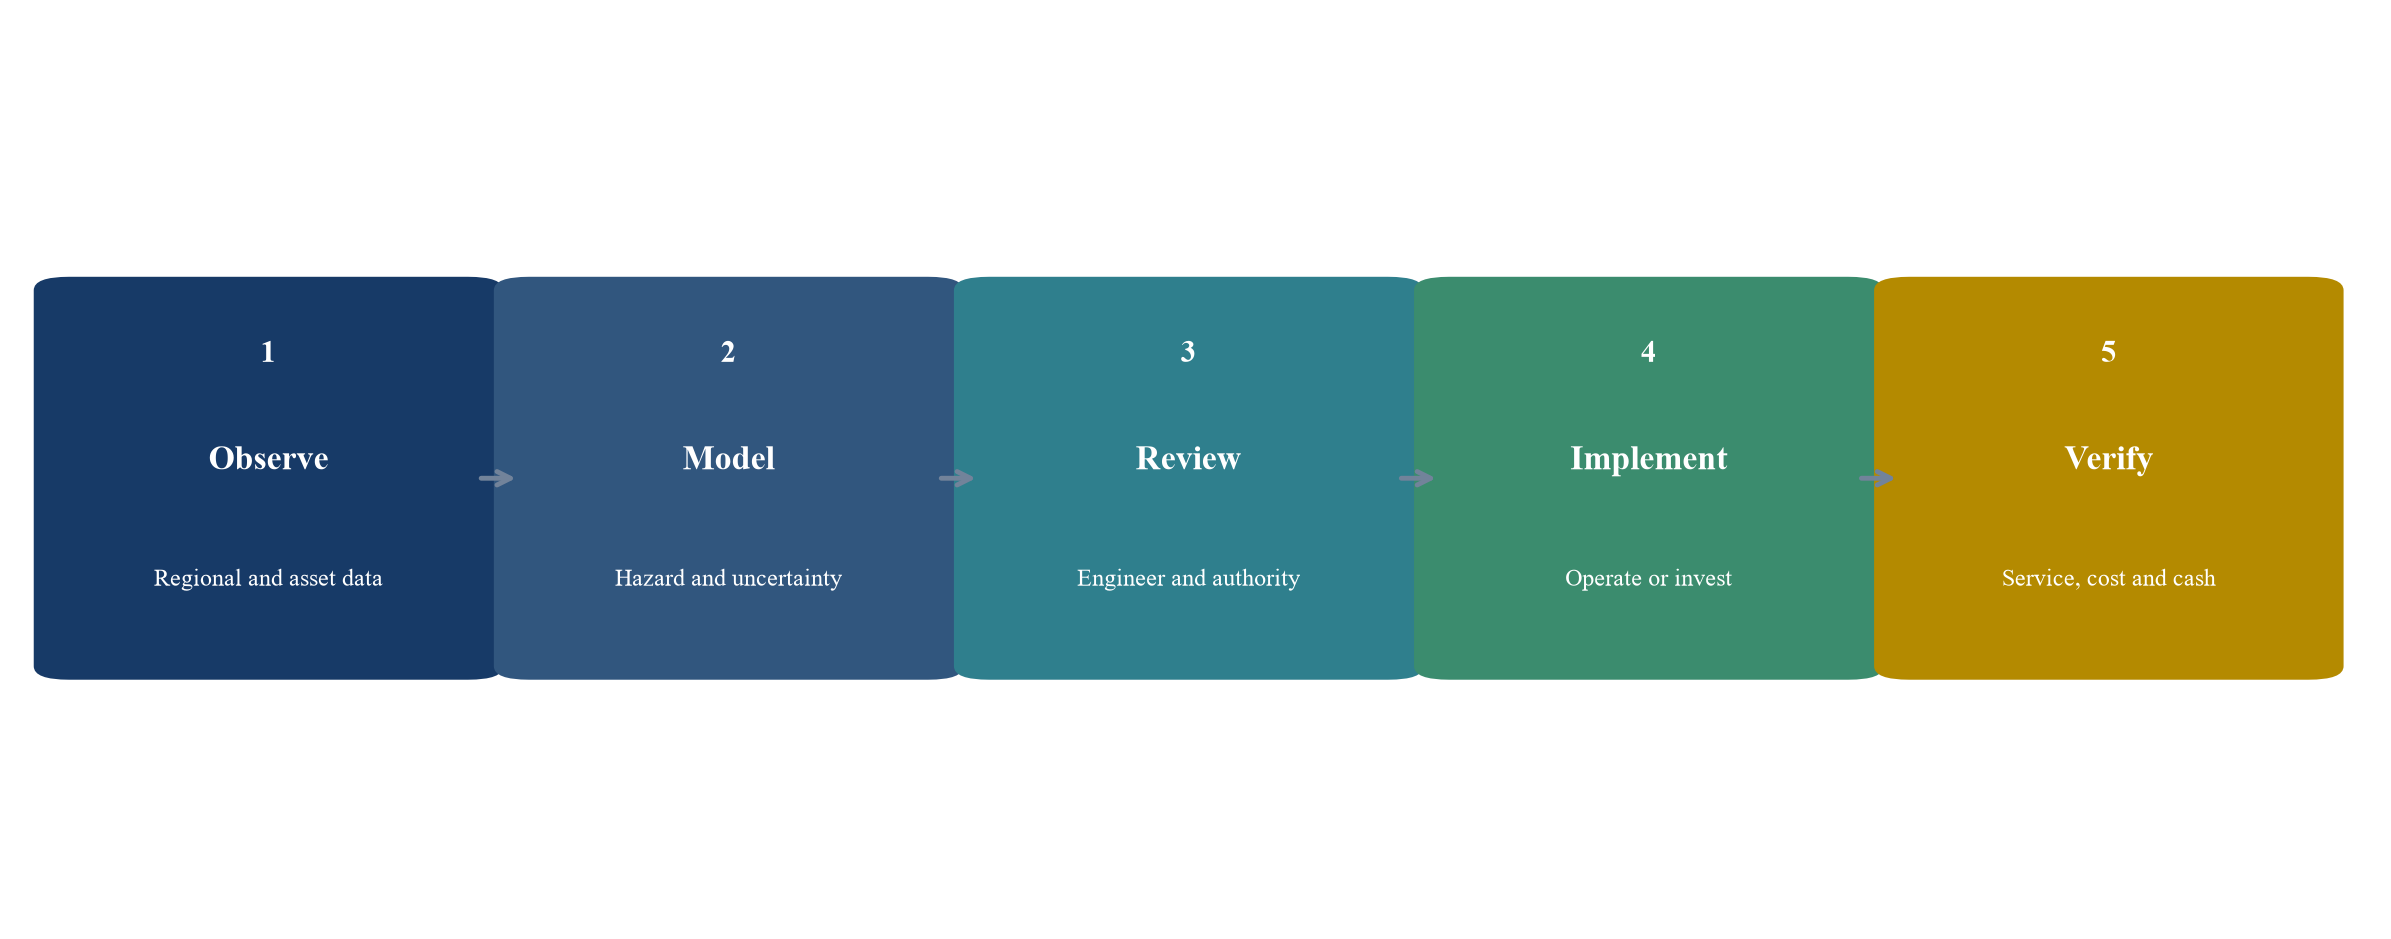
A governed workflow records model, engineering authority, implementation and outcome.
21. Measure heat-adaptation outcomes
Heat adaptation can include shading, envelope improvement, cooling optimisation, equipment derating, maintenance, work-rest regimes and emergency response. Outcome measures can include indoor conditions, equipment trips, worker exposure, electricity demand, downtime and service quality.
The baseline should account for weather, occupancy, production and operating state. A cooler period should not be credited to the model. Energy savings should be measured without compromising thermal safety or product quality. Avoided failure requires a defined probability and consequence rather than an unobserved claim.
The buyer should inspect adverse events and trade-offs. Pre-cooling can shift peak demand. More cooling can increase water or energy use. Verified value is the net operational and financial outcome within safety and service constraints.
22. Measure water-adaptation outcomes
Water adaptation can include demand reduction, leak control, storage, reuse, source diversification and contingency planning. Outcomes should distinguish observed savings, released capacity, improved reliability and avoided shortage.
The target should establish facility water balances, true cost and action records. It should adjust for production, weather and quality. Reuse benefits should include treatment, energy, residuals, maintenance and permit effects. Resilience scenarios should state probability, duration and service assumptions.
The acquirer should prevent double counting between efficiency, capacity and avoided interruption. A reduced withdrawal can support several benefits, but each financial claim needs its own causal pathway. Customer value should reconcile with operating records and cash where observable.
23. Measure flood and continuity outcomes
Flood adaptation can include drainage maintenance, barriers, equipment elevation, route planning, emergency procedures and recovery resources. Outcome evidence can include reduced water ingress, protected equipment, service continuity and faster recovery.
Rare events make direct validation difficult. The target can combine observed incidents, engineering tests, scenario exercises and near-miss records. Each source should remain identifiable. An avoided-loss estimate should not be presented as realised savings.
Diligence should test whether recommendations were implemented and maintained. Temporary barriers, blocked drains and changed development can alter performance. The buyer should assess the recurring role of monitoring and workflow, because one-time capital projects may reduce software renewal demand.
24. Rank adaptation options and pathways
Adaptation is a sequence of decisions under uncertainty. Customers can monitor, maintain, operate differently, retrofit, add redundancy, relocate or redesign. A pathway can stage measures as thresholds are reached rather than fund every option immediately.
The platform should compare cost, lead time, service effect, useful life, dependency and residual risk. It should show assumptions and prevent a model score from becoming an automatic capital recommendation. Options that perform across several scenarios can have strategic value even without one precise forecast.
The buyer should inspect how recommendations enter capital governance. It should compare proposed and approved projects, procurement time and realised outcome. Implementation capability can be a source of value when local engineering, permitting and supplier coordination are transferable.
25. Test avoided-loss and resilience claims
Avoided loss is counterfactual. It depends on event probability, asset response, service consequence and adaptation effectiveness. Management can overstate value by applying a severe event to every asset or treating gross asset value as loss.
The target should define event set, horizon, vulnerability, downtime, recovery and discounting. It should separate expected annual loss, tail stress and strategic service obligations. Public infrastructure can create social value that does not appear as vendor customer cash.
The acquirer should reproduce material claims and test sensitivity. It should identify insured, retained and contractual losses. Transaction value should rely on customer willingness to pay and realised cash, with avoided loss supporting the decision case rather than becoming revenue automatically.
26. Assess implementation capability
Regional data and models create limited value without implementation. Capability can include asset surveys, integration, engineering, project management, commissioning, training and managed monitoring. These services can deepen customer outcomes and change scaling economics.
The buyer should map staff credentials, partner roles, country coverage, subcontractors and quality controls. Founder relationships and public-sector access may not transfer automatically. Local procurement and language capability can be material.
Implementation should be measured through schedule, cost, acceptance, defects and outcomes. The transaction model should separate recurring software, recurring managed service and project revenue. A high-touch delivery model can be attractive when pricing and capacity support margin and cash conversion.
27. Analyse procurement and customer concentration
GCC adaptation customers can include governments, utilities, sovereign-related entities, infrastructure operators and industrial groups. Procurement can involve pilots, tenders, frameworks, local-content requirements, security review and long payment cycles. Reported bookings may not convert promptly to cash.
Cohort analysis should cover contract, order, acceptance, invoice, collection, renewal and expansion. Customer and country concentration should be measured at parent level. A large portfolio of assets within one authority remains one commercial exposure.
The buyer should distinguish relationship strength from transferable contract value. Change-of-control, assignment, data residency and local presence can affect continuity. Working-capital needs and bid costs belong in valuation. Pipeline should not be treated as contracted revenue.
28. Build the valuation bridge
The hypothetical target has 68 customers, USD 21.2 million of annual recurring revenue, 412 monitored assets and USD 38 billion of customer-reported asset value. Management proposes USD 16.5 million of annual customer value and USD 9.6 million of buyer revenue and synergy. These figures are illustrative management assumptions only.
Evidence gates retain 37 customers and 176 assets with governed data, validated models, authorised actions and measured outcomes. The customer-value case falls to USD 6.8 million after attribution, implementation and persistence adjustments. The buyer revenue-and-synergy case falls to USD 4.1 million after procurement, concentration, delivery cost and cash conversion.
The bridge prevents regional coverage and gross asset value from entering value without evidence. The buyer can then apply its selected valuation method, discount rate and transaction structure to retained cash flows.
Table 2. Hypothetical customer-value ledger
| Proposed value component | Management case | Evidence retained | Principal adjustment |
|---|---|---|---|
| Heat and energy operations | USD 5.2m | USD 2.4m | Baseline, weather and persistence |
| Water operations | USD 3.8m | USD 1.7m | Balance, attribution and transferred cost |
| Flood and continuity | USD 4.5m | USD 1.5m | Probability, implementation and recovery |
| Planning and compliance | USD 3.0m | USD 1.2m | Defined decision and realised effort |
| Total annual customer value | USD 16.5m | USD 6.8m | Governed evidence gates |
Every number is an illustrative management assumption, not observed company data.
Table 3. Hypothetical buyer revenue and synergy bridge
| Component | Management case | Evidence-adjusted case | Evidence gate |
|---|---|---|---|
| Recurring revenue retained | 5.8 | 2.8 | Use, renewal, concentration and cash |
| Cross-sell | 2.0 | 0.6 | Validated need and procurement |
| Delivery synergy | 1.2 | 0.4 | Demonstrated process and capacity |
| Data and platform synergy | 0.6 | 0.3 | Transferable rights and integration |
| Total | 9.6 | 4.1 | No duplication with customer value |
Values are illustrative management assumptions in USD millions.
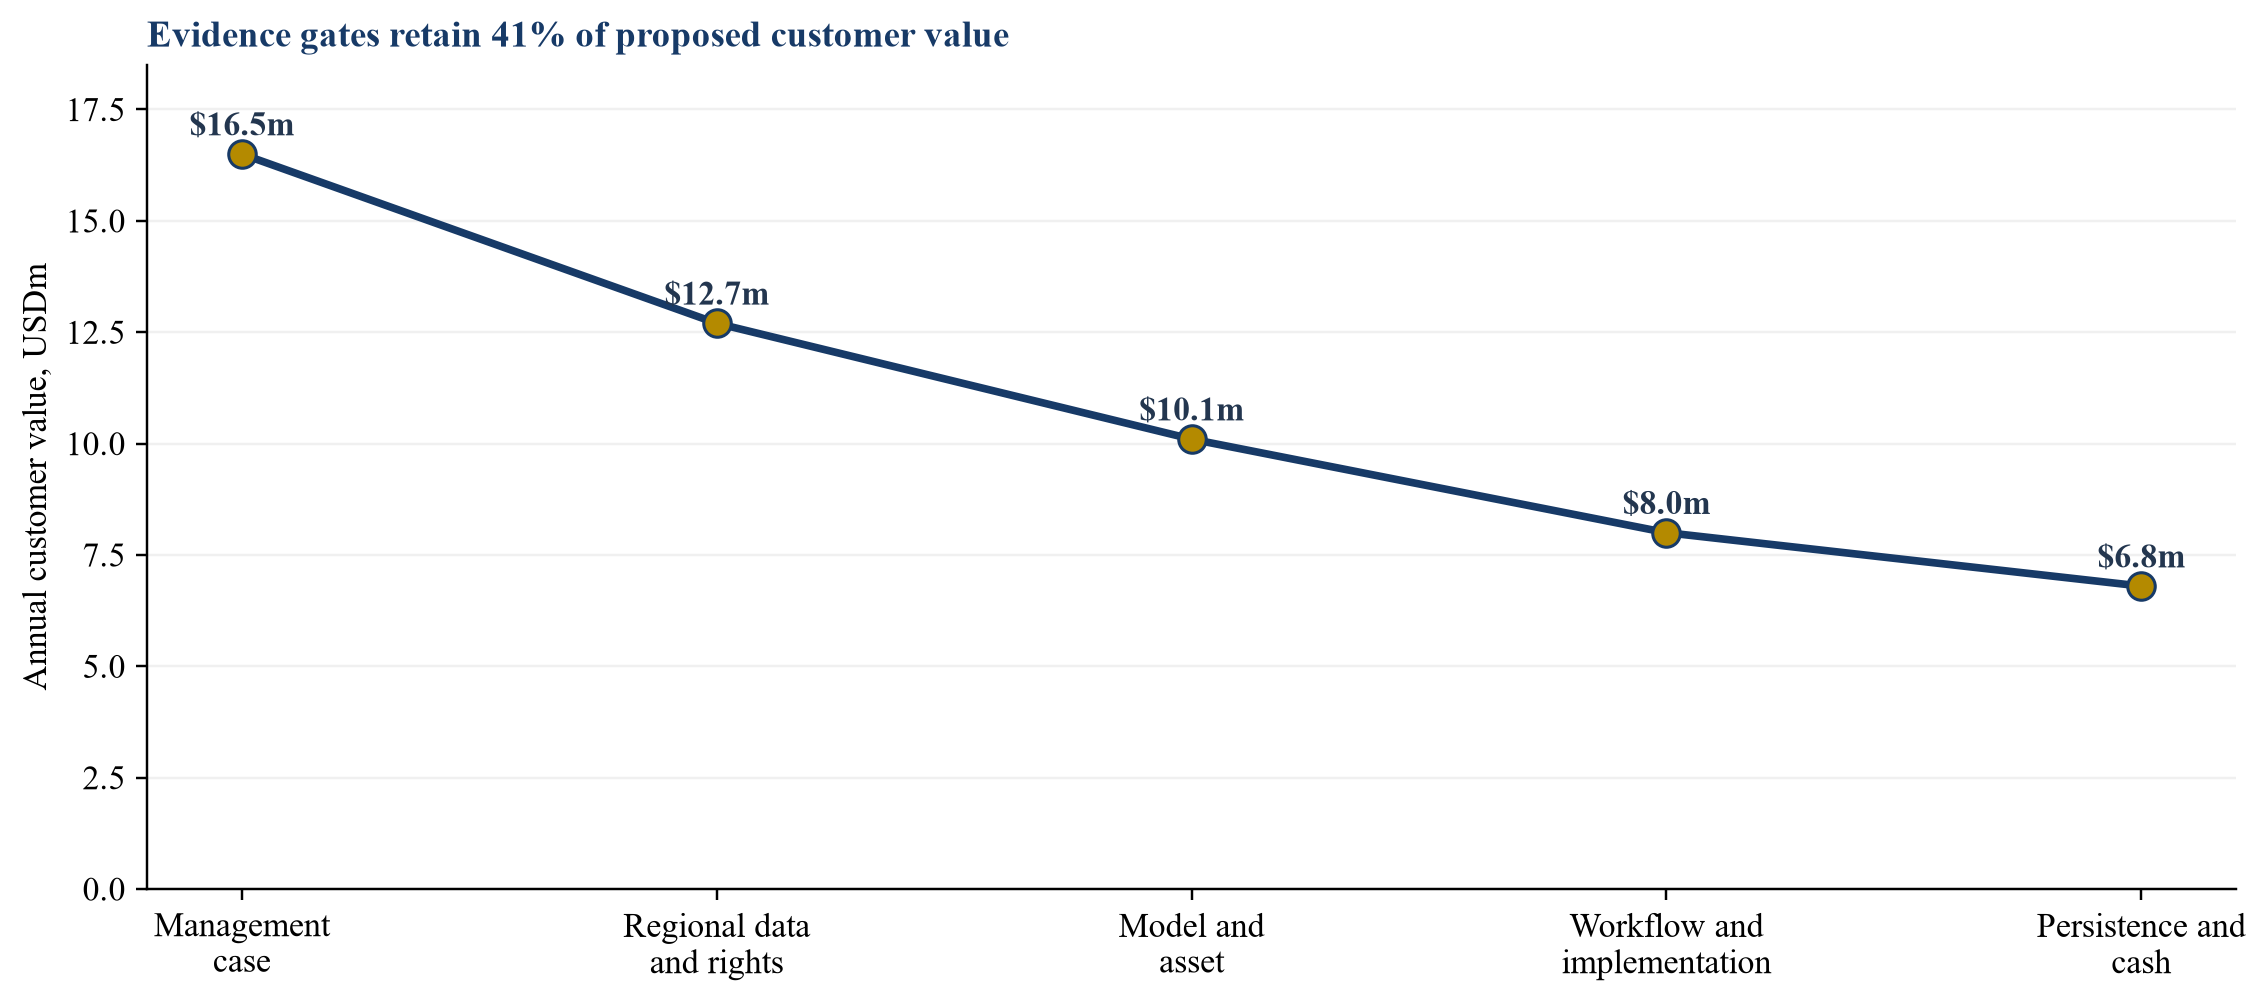
Values in USD millions are illustrative management assumptions.
29. Translate evidence into price and terms
Validated installed capability can support value at signing. Unvalidated countries, hazards and autonomous recommendations can be funded through milestones. Milestones should reference objective outcomes such as completed validation, active assets, renewal, margin or collected cash.
Representations should cover data and model rights, licences, validation, customer use, savings and resilience claims, security, intellectual property and public procurement. Holdbacks or indemnities can address defined exposures. The buyer should reserve integration capital for data, model, workflow and local delivery continuity.
Earn-outs need precise definitions. Extreme events and government procurement sit partly outside management control. Revenue targets should state treatment of project work, pass-through cost, delayed acceptance, customer consolidation and buyer-led cross-sell. Transaction structure should align payment with evidence becoming transferable and durable.
30. Execute diligence and the first one hundred days
The diligence request should include model inventory, data register, licences, validation, monitoring, incidents, asset registers, customer workflows, outcome ledgers, contracts, tenders, cohorts, service hours, security and financial models. Sampling should cover material customers, countries, hazards, recent versions, adverse outcomes and high-touch implementations.
The first thirty days should establish control, freeze production inventories and reconcile customer deployments. Days thirty-one to sixty should reproduce material models and outcomes, close priority validation gaps and confirm rights. Days sixty-one to one hundred should harmonise governance, monitoring, implementation and board reporting.
Management should report governed assets, validation findings, drift, overrides, completed actions, verified outcomes, recurring revenue, project revenue, service effort, concentration and collected cash separately. Unsupported resilience claims should be removed from forecasts. Integration should preserve model versions and decision records before technical consolidation.
Table 4. Diligence gates and first-one-hundred-day ownership
| Workstream | Pre-close evidence | Day-one control | Day-one-hundred outcome |
|---|---|---|---|
| Model | Inventory and validation | Version freeze and owner | Governed model estate |
| Data | Rights, lineage and quality | Access and supplier continuity | Reconciled regional inputs |
| Asset workflow | Decisions, overrides and outcomes | Authority and audit logging | Reproduced customer value |
| Implementation | Partners, projects and acceptance | Delivery continuity | Controlled regional capability |
| Commercial | Cohorts, procurement and cash | Renewal and concentration watch | Validated integration economics |
Evidence owners should be named before close and accountable through integration.
31. Set board and integration controls
Board reporting should distinguish technical performance, asset outcomes and commercial economics. Technical reporting can cover data quality, calibration, drift, validation issues and incidents. Workflow reporting can cover alerts, reviews, overrides, actions and outcomes. Commercial reporting can cover renewal, procurement, concentration, margin, service effort and cash.
One composite resilience score can hide the source of risk. Separate measures should reconcile through the customer, asset and model inventory. Directors should see which models affect consequential decisions, which limitations are accepted and which remediation constrains growth.
Integration should sequence identity, data rights, model versions, asset configurations, decision logs, local partners and customer obligations. Parallel runs may be required for material workflows. Synergy should begin after validated migration. This sequencing preserves customer confidence and decision explainability.
32. Recognise limitations and conclude
This framework does not validate a particular climate model, GCC asset, technology or transaction. Applicable engineering, environmental, safety, data, accounting, procurement and regulatory requirements vary by jurisdiction and use. Current professional advice, local engineering assessment and independent diligence are required.
The hypothetical case does not estimate market demand, avoided loss or transaction value. Regional climate outcomes are affected by emissions, variability, urbanisation, infrastructure, maintenance, policy and human action. A favourable historical result does not establish future performance. Regional reports and scenarios establish context while carrying purpose, scale and uncertainty limitations.
The practical conclusion is that the adaptation stack becomes transaction value through a governed chain. Data must be lawful and locally relevant. Models must be fit for the asset decision. Engineers must retain authority. Recommendations must be implemented and outcomes measured. Customers must continue to pay and convert revenue into cash.
GCC adaptation technology can create material operational and social value. It can improve heat readiness, water security, flood resilience and infrastructure investment. Its limitations must remain visible. The strongest acquisition case connects regional evidence, asset vulnerability, decision, implementation, outcome and cash without converting a hazard score into an observed benefit.
References
- World Meteorological Organization. State of the Climate in the Arab Region 2024, December 2025. https://wmo.int/resources/publication-series/state-of-climate/state-of-climate-arab-region-2024
- World Meteorological Organization. Temperature Increase Is Accelerating in Arab Region, December 2025. https://wmo.int/media/news/temperature-increase-accelerating-arab-region-escalating-impacts
- Intergovernmental Panel on Climate Change. Climate Change 2022: Impacts, Adaptation and Vulnerability. https://www.ipcc.ch/report/ar6/wg2/
- Intergovernmental Panel on Climate Change. AR6 Synthesis Report. https://www.ipcc.ch/report/ar6/syr/
- United Nations Framework Convention on Climate Change. National Adaptation Plans. https://www.unfccc.int/national-adaptation-plans
- United Arab Emirates. Long-Term Strategy 2050, 2023. https://unfccc.int/sites/default/files/resource/UAE_LTLEDS.pdf
- United Arab Emirates. First Biennial Transparency Report, 2025. https://unfccc.int/sites/default/files/resource/UAE%27s%20First%20BTR%20-%20Submission%20Document.pdf
- International Energy Agency. Middle East: Energy System Overview. https://www.iea.org/regions/middle-east
- International Energy Agency. The Future of Electricity in the Middle East and North Africa, 2025. https://www.iea.org/reports/the-future-of-electricity-in-the-middle-east-and-north-africa
- International Energy Agency. World Energy Outlook 2024. https://www.iea.org/reports/world-energy-outlook-2024
- World Resources Institute. Aqueduct Water Risk Atlas. https://www.wri.org/data/aqueduct-water-risk-atlas
- World Resources Institute. Aqueduct Water Risk Indicators. https://www.wri.org/aqueduct/help-center/water-risk-indicators
- International Organization for Standardization. ISO 14090:2019 Adaptation to Climate Change. https://www.iso.org/standard/68507.html
- International Organization for Standardization. ISO 14091:2021 Climate Change Adaptation, Vulnerability, Impacts and Risk Assessment. https://www.iso.org/standard/68508.html
- International Organization for Standardization. ISO 22301:2019 Security and Resilience, Business Continuity Management Systems. https://www.iso.org/standard/75106.html
- National Institute of Standards and Technology. Artificial Intelligence Risk Management Framework. https://www.nist.gov/itl/ai-risk-management-framework
- National Institute of Standards and Technology. AI RMF Playbook. https://www.nist.gov/itl/ai-risk-management-framework/nist-ai-rmf-playbook
- Taskforce on Nature-related Financial Disclosures. Recommendations of the TNFD, September 2023. https://tnfd.global/recommendations-of-the-tnfd/
- IFRS Foundation. IFRS S2 Climate-related Disclosures. https://www.ifrs.org/issued-standards/ifrs-sustainability-standards-navigator/ifrs-s2-climate-related-disclosures/
- IFRS Foundation. IFRS 3 Business Combinations. https://www.ifrs.org/issued-standards/list-of-standards/ifrs-3-business-combinations/
- IFRS Foundation. IFRS 13 Fair Value Measurement. https://www.ifrs.org/issued-standards/list-of-standards/ifrs-13-fair-value-measurement/
- IFRS Foundation. IFRS 15 Revenue from Contracts with Customers. https://www.ifrs.org/issued-standards/list-of-standards/ifrs-15-revenue-from-contracts-with-customers/
- IFRS Foundation. IAS 38 Intangible Assets. https://www.ifrs.org/issued-standards/list-of-standards/ias-38-intangible-assets/
About the Author
Chennakeshav (CK) is a corporate finance and investment banking executive with 25+ years of global experience in deal origination, structuring and execution across M&A, growth capital and corporate strategy. He has led value-creation mandates for founders, corporates and funds — bridging the boardroom view to hands-on execution and close.
His career spans Morgan Stanley, HSBC, Lloyds Banking Group, EWEC, ADQ portfolio companies and Emirates Growth Fund, across TMT, real estate, fintech, deeptech, cleantech, infrastructure and energy. He has partnered with C-suite leaders, private equity and venture funds, sovereign wealth funds and family offices to finance complex fund raises and scale-up ventures, and has led M&A due diligence, post-merger integration and business-transformation initiatives to create value.
At Matchpoint Partners he is Managing Partner, leading the firm's corporate finance, M&A and capital-raising practice. He holds an MBA from London Business School, an engineering degree from VTU and a Master of Laws (LLM, in progress) from UCL London.
An active start-up mentor, CK mentors at Techstars, DIFC FinTech Hive, Startup Grind, Founder Institute and IN5, serves as Entrepreneur Mentor in Residence (EMiR) at London Business School, and judges the Entrepreneurship World Cup.
https://www.linkedin.com/in/ckadya/
https://www.matchpoint-partners.com/team/ck-adya.html
This paper is part of a continuing series on the structure of private and alternative markets. The views expressed are the author's own. The paper is for information only, describes market structure in general terms, and does not constitute investment, legal, tax or regulatory advice or a recommendation in respect of any security, vehicle or counterparty.
