

1. Define the acquisition decision
The buyer must decide how much value to assign to a wildfire-analytics business whose outputs may influence pricing, eligibility, capacity, inspection, mitigation, claims readiness, reinsurance and portfolio management. The valuable asset is a controlled decision system. A visually persuasive risk map has limited transaction value when the buyer cannot establish its purpose, permitted use, validation, change history and effect on insurance outcomes.
Wildfire analytics serve several time horizons. A seasonal outlook can guide operational preparedness. A long-term hazard surface can support accumulation management. A parcel score can influence underwriting or inspection. A mitigation model can recognise changed building or vegetation conditions. The required data, validation and governance differ across these uses.
The framework tests six propositions. The decision and user are defined. The model is fit for the relevant scale and horizon. Data and intellectual-property rights are transferable. Validation and change controls are reproducible. Customer and regulatory workflows permit continued use. Revenue persists after concentration, service effort and integration cost. Failure at any layer reduces the amount, timing or certainty of transaction value.
Table 1. Evidence required before wildfire analytics receive transaction value
| Evidence layer | Core question | Minimum record | Transaction consequence |
|---|---|---|---|
| Decision | What authorised action uses the output? | User, threshold, authority and action | Defines practical value |
| Hazard model | Is the output fit for scale, horizon and peril? | Purpose, version, inputs and limitations | Supports technical validity |
| Validation | Does performance persist outside development data? | Independent tests, errors and drift | Supports reliance |
| Regulation and conduct | Is use permitted, explainable and fair? | Filing, approval, notices and review | Supports market access |
| Distribution | Which channels convert output into decisions? | Contract, integration and concentration | Supports revenue persistence |
| Economics | Does observed use produce scalable cash? | Renewal, effort, margin and collection | Supports transaction value |
The decision, model, workflow and commercial layers should be tested together.
2. Separate hazard, exposure, vulnerability and loss
Wildfire risk is not one variable. Hazard describes the probability and intensity of fire. Exposure describes people, structures and values in affected locations. Vulnerability describes how exposed assets respond. Financial loss adds policy terms, limits, deductibles, inflation, demand surge and claims behaviour. An analytics platform may model one layer well and imply authority over the others.
The USDA Forest Service describes quantitative wildfire risk through hazard, exposure, effects and valued resources. Its Wildfire Hazard Potential product also warns that the dataset is for long-term strategic planning and is not a seasonal forecast. Such purpose statements are commercially important. A dataset that supports community planning may not support parcel-level insurance selection without additional calibration and validation.
Diligence should inventory every output and map it to these layers. A hazard score should not be presented as expected insured loss unless exposure, vulnerability and policy conditions are incorporated. The buyer should identify where third-party models, customer data or manual assumptions complete the chain. Value should follow the controlled product actually delivered.
3. Define the insurance workflow
An insurer can use wildfire analytics in product design, territory strategy, underwriting, pricing, inspections, mitigation, aggregation, reinsurance, capital, claims preparation and customer communication. Brokers and managing general agents can use the same output to route submissions, explain requirements or manage delegated authority. Public bodies can use it for mitigation planning and market oversight.
Each workflow requires an authorised user and an action. An underwriter may order an inspection when a score exceeds a threshold. A portfolio team may limit aggregate exposure within a fireshed. A claims team may prioritise post-event imagery. The model creates value when it changes such a decision with appropriate governance.
The buyer should trace a sample of predictions into source systems, decision logs and outcomes. Dashboard views and API calls do not establish use. The trace should show who received the output, what rule or judgement applied, whether an override occurred and what followed. This evidence supports both customer value and defensible revenue attribution.
4. Build the hazard data register
Wildfire models can draw on weather, drought, fuel moisture, vegetation, topography, ignition history, fire perimeters, suppression, utilities, structures, access, building materials, mitigation and satellite observations. Each source has a spatial resolution, update cycle, licence, uncertainty and permitted use. The register should connect every material feature to source, owner, vintage, transformation and model version.
Public data can be strategically valuable when the target creates reliable ingestion, refinement, validation and workflow. Public availability does not give unrestricted rights to every derivative or redistribution. Commercial satellite, property and claims data may carry field-of-use limits, change-of-control clauses or customer-specific restrictions.
The acquirer should test completeness and lineage rather than count datasets. It should reproduce selected inputs for high-risk, low-risk and recently changed locations. Missing tiles, stale vegetation, address mismatches and silent imputation can materially alter output. Data rights and refresh cost belong in the transaction model.
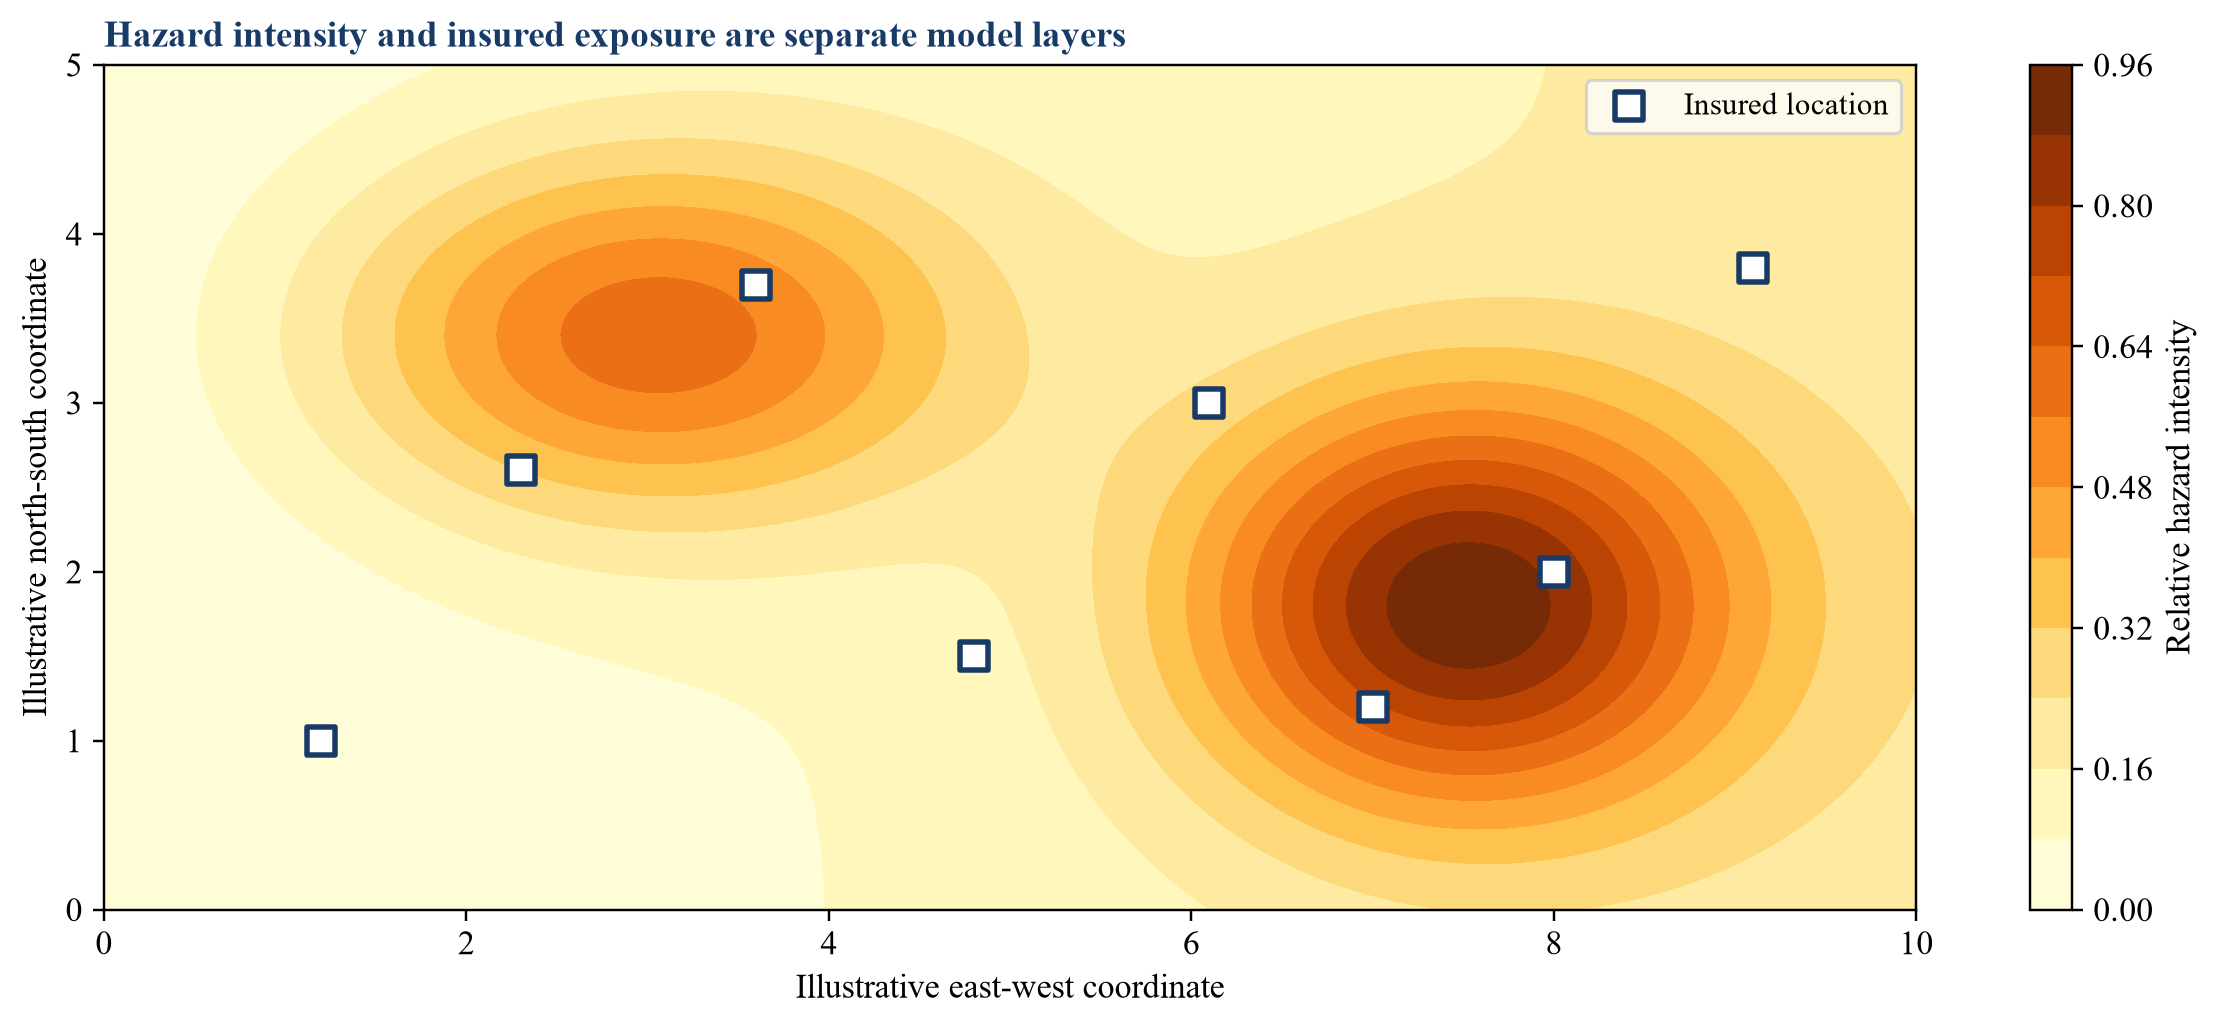
The visual separates a continuous hazard surface from discrete insured locations; it is illustrative and not a geographic forecast.
5. Match spatial scale to decision scale
Resolution can be confused with accuracy. A fine grid or parcel polygon creates a precise-looking output even when fuels, construction, access or mitigation are represented at coarser scale. The USDA Forest Service notes that Wildfire Risk to Communities data are best used in aggregate and are not locally calibrated for individual homes. Such limitations should travel with derived features.
Parcel underwriting may require geocoding, structure attributes, defensible-space observations and local fire behaviour. Portfolio management can use broader units when aggregation error is understood. Community mitigation can use fireshed or tract-level information. One model can support several uses only when the target validates each use separately.
Diligence should test boundary effects, geocoder confidence and sensitivity to small coordinate changes. Adjacent properties can receive different scores because of grid, parcel or administrative boundaries. The product should explain meaningful discontinuities and prevent users from interpreting artificial precision as observed property condition.
6. Match temporal horizon to the promise
Wildfire analytics can estimate current conditions, daily fire danger, seasonal potential, annual loss or long-run hazard. Weather and fuel moisture can change quickly. Vegetation treatment and construction change more slowly. Climate scenarios operate over much longer horizons. A product should state which horizon it addresses and avoid combining them into an unexplained score.
USGS fire-danger forecasting combines forecast weather and satellite observations to depict risk of large-fire activity. The Forest Service's Wildfire Hazard Potential instead supports strategic planning and does not include current weather or fuel moisture. These official distinctions illustrate why model purpose must be explicit.
The buyer should inspect forecast windows, data cutoff, refresh latency and customer service levels. It should separate nowcasts from climatology and identify how forecasts become underwriting variables. Long-term climate adjustments require scenario governance. Commercial value depends on whether the horizon matches the customer's decision and renewal cycle.
7. Establish a model inventory
The target may use fire-spread simulation, statistical learning, computer vision, remote sensing, geospatial rules, vulnerability curves, loss models and ensemble methods. It may also depend on third-party property, weather or catastrophe models. The inventory should identify every production model, component, owner, purpose, version, upstream dependency and customer deployment.
The 2026 interagency model-risk guidance emphasises a risk-based approach tailored to model use and materiality. Although directed to covered banking organisations, its principles of development, validation, governance and controls provide a useful diligence reference. NIST's AI Risk Management Framework similarly organises work through Govern, Map, Measure and Manage.
A model inventory should include rules and spreadsheets that materially change output. It should identify shadow versions used by analysts and customer-specific forks. The acquirer should compare source control, model registry and production traffic. A clean inventory is a precondition for evaluating intellectual property, technical debt and change-of-control risk.
8. Test development data and target population
Model performance depends on the relationship between development data and the population where it is used. Wildfire events are sparse, spatially dependent and shaped by changing climate, development, suppression and reporting. A large training dataset can still be narrow in geography, structure type or event severity.
The target should document inclusion, exclusion, class balance, missing data, label construction and leakage controls. Loss labels may reflect insurance penetration, policy terms and claims practices rather than physical damage alone. Fire perimeters and destroyed-structure records can contain different spatial and temporal errors.
Diligence should compare the production portfolio with development and validation populations. It should examine performance by geography, construction, vegetation, urban interface and event type. Expansion into a new state or country is a new validation question. Market opportunity should not be valued as proven model portability.
9. Validate outside the development process
Validation should be independent of model development in authority and evidence, with rigor proportionate to use. It should evaluate conceptual soundness, data, implementation, performance, limitations and ongoing monitoring. A single holdout score does not establish fitness for consequential underwriting.
Spatial and temporal validation matter. Randomly splitting nearby properties can leak common fire, weather and landscape characteristics into training and test sets. A more demanding design can hold out geographies, seasons or events. Extreme losses may remain too rare for stable estimates, requiring stress tests and expert review.
The buyer should reproduce headline performance metrics and inspect negative results. Validation records should show issues, severity, owners, closure and accepted limitations. Vendor validation commissioned by management can be useful, while independence and scope should be explicit. Price should reflect the validated use, not the broadest marketing claim.
10. Measure calibration and discrimination
Discrimination tests whether the model ranks higher-risk observations above lower-risk observations. Calibration tests whether predicted probabilities or losses correspond to observed frequencies or severities. A model can rank well and remain badly calibrated. Insurance pricing and capital decisions need both where the output is quantitative.
Performance should be reported over time and relevant segments. Area under a curve can hide errors at the thresholds used in production. The target should show false-negative and false-positive rates around underwriting, inspection or mitigation actions. Financial cost depends on the asymmetry between missed severe risk and unnecessary restriction.
The acquirer should connect metrics to decision thresholds. It should test whether recalibration changes eligibility, rate indication or portfolio concentration. Where predictions are relative scores rather than probabilities, customer documentation should prevent probability interpretations. The valuation should reward reproducible decision performance rather than a single technical metric.
11. Quantify uncertainty
Wildfire outcomes contain aleatory variability and epistemic uncertainty. Weather, ignition and suppression create inherent variability. Limited data, model form, uncertain property attributes and scenario choice create knowledge uncertainty. A point score can conceal both.
The platform should provide uncertainty appropriate to the decision. Portfolio models can use event sets, exceedance curves and sensitivity ranges. Parcel decisions can use confidence, missing-data flags and reason codes. Long-term views can show scenario and method ranges. Uncertainty should influence escalation and human review.
Diligence should inspect whether uncertainty is calculated, communicated and used. A narrow interval produced by an incomplete model can create false confidence. The buyer should test sensitivity to fuel, weather, geocoding, vulnerability and mitigation assumptions. Transaction value should reflect the model's ability to support proportionate decisions under uncertainty.
12. Monitor drift and changing conditions
Wildfire models can drift as vegetation, drought, development, mitigation, building stock, suppression and claims processes change. Data suppliers can change coverage or feature definitions. Customer portfolios can shift geographically. Monitoring must separate input drift, performance drift and policy change.
The target should define thresholds, review frequency, escalation, recalibration and retirement. Monitoring should cover missingness, feature distribution, score distribution, overrides, inspection findings, claims and customer outcomes. Severe-event learning should enter governance without allowing one event to drive uncontrolled changes.
The buyer should inspect the history of model changes and incidents. Stable headline performance may conceal deteriorating segments. It should test whether monitoring reaches owners and customer communications. Ongoing model cost belongs in margin and integration forecasts. A model that requires intensive manual surveillance may still be valuable, with economics different from a self-maintaining software product.
13. Govern model change
Changes to data, features, algorithms, calibration, thresholds and customer rules can affect insurance decisions. The target should classify changes by materiality and require testing, approval, documentation, release control and customer notice. Emergency fixes need equivalent retrospective governance.
California's catastrophe-model framework makes regulatory use a live transaction consideration. A target may have customer acceptance for one model version, filing context or purpose. A material change can trigger re-review, customer validation or revised documentation. The buyer should map model versions to contracts, filings and production decisions.
Code review and automated tests are necessary but incomplete. Change records should explain expected outcome, affected population, validation evidence and rollback. The acquirer should test whether commercial pressure bypassed controls. Earn-out measures should avoid rewarding rapid deployment that transfers unresolved model risk to customers.
14. Control third-party models and data
Wildfire platforms often combine licensed catastrophe models, geocoders, satellite data, property attributes, weather feeds and cloud services. The buyer inherits performance and continuity dependencies beyond the target's direct control. Contracts should be reviewed for assignment, change of control, audit, service levels, data reuse and termination.
NAIC work on third-party data and models reflects regulatory interest in information needed to evaluate insurer use. The target should support customers with model documentation, limitations, testing and incident information without breaching vendor restrictions. Black-box dependencies can constrain that support.
Diligence should identify substitution cost and operational concentration. It should test outages, late feeds and vendor-version changes. The valuation should separate proprietary capability from licensed inputs and customer configuration. A high gross margin can fall when a provider reprices, withdraws rights or requires additional verification.
15. Apply AI governance to insurance use
The NAIC Model Bulletin expects insurers using AI-supported decisions to maintain a written programme for responsible use and compliance with applicable insurance law. IAIS guidance connects AI supervision to governance, risk management, data, transparency, fairness, cybersecurity and third-party reliance. These expectations can influence customer diligence and product design.
The vendor should map each AI component to its decision impact and provide documentation proportionate to risk. It should record training data, performance, limitations, monitoring, human oversight and change. Marketing descriptions should align with actual technology; a rules engine, statistical model and generative assistant create different risks.
The acquirer should test whether the target can answer customer and regulator information requests efficiently. Governance that exists only in sales questionnaires creates recurring service cost and inconsistency. Reusable evidence can support faster onboarding, renewals and market expansion. Compliance readiness is therefore both a control and an operating capability.
16. Preserve human authority and overrides
Consequential insurance decisions require clear authority. A model may recommend inspection, referral, mitigation or capacity action. The insurer remains responsible for the decision and applicable conduct obligations. The platform should show reason codes, data quality and limitations in a form that supports review.
Overrides are valuable evidence when they capture reason, user, date and outcome. High override rates can indicate poor fit, outdated thresholds or workflow resistance. Very low rates can indicate automation bias or weak review. The target should analyse both patterns without treating every override as error.
The buyer should inspect permissions, escalation and audit logs. It should sample adverse and favourable overrides and compare later evidence. Human review should not become an undocumented repair layer. The transaction model should include the staffing and workflow required for responsible use at greater scale.
17. Connect predictions to underwriting outcomes
The central commercial test is whether predictions improve authorised underwriting outcomes. Relevant measures can include referral precision, inspection yield, mitigation completion, quote turnaround, bind rate, retention, loss ratio and concentration. Each measure requires a defined population, comparison and observation period.
Attribution is difficult because underwriting also reflects price, appetite, distribution, competition and macroeconomic conditions. The target should avoid claiming that the model caused every favourable change. Controlled pilots, phased rollouts, matched comparisons and threshold analysis can provide stronger evidence than before-and-after averages.
The acquirer should build an outcome ledger linking model version, customer, decision, action and result. It should distinguish physical-risk improvement from selection or price effects. A model can reduce expected loss by declining business, while damaging growth or availability. Customer value should reflect the objective actually achieved and its sustainability within regulatory and conduct constraints.
Table 2. Wildfire analytics outcome ledger
| Workflow | Model action | Observable outcome | Key confounder |
|---|---|---|---|
| Submission triage | Route or prioritise | Turnaround and placement | Channel mix |
| Underwriting | Refer, inspect or restrict | Bind, retention and loss | Appetite and price |
| Mitigation | Recommend or verify | Completed risk reduction | Customer selection |
| Portfolio | Limit or diversify | Accumulation and tail loss | Market availability |
| Claims readiness | Pre-position resources | Response time and severity | Event conditions |
Each outcome needs a defined population, counterfactual and observation period.
18. Recognise mitigation without overstating effect
Mitigation can include defensible space, roof and vent improvements, vegetation treatment, access, water supply and community action. Analytics can identify priorities and verify some changes through imagery or inspection. The effect on loss depends on fire intensity, surrounding conditions, maintenance and interacting measures.
The platform should distinguish observed property attributes, inferred attributes and recommended actions. It should retain date, evidence and verifier. Mitigation decay matters; vegetation regrows and property conditions change. A one-time image should not support an indefinite credit.
California's regulatory approach expressly connects catastrophe modelling with recognised wildfire-safety actions. The buyer should map target capability to current filing and customer requirements. It should test whether mitigation factors are empirically supported, appropriately conservative and explained. Value arises when verified changes alter a governed decision and are sustained, rather than from the number of recommendations generated.
19. Address fairness and customer conduct
Wildfire risk is geographically concentrated and can correlate with income, age, rurality and other characteristics. Model outputs can affect availability, price and property value. Even when a model does not use protected attributes, data and geography can create differential effects that require legal and conduct review.
The target should support customers with outcome testing, reason codes, data correction and complaint handling. The NAIC Model Bulletin reminds insurers that AI-supported decisions remain subject to applicable insurance law. IAIS guidance similarly emphasises fair treatment, transparency and accountability.
Diligence should inspect adverse-action explanations where applicable, customer notices, disputes and correction workflows. It should test whether consumers can challenge incorrect property data. Fairness analysis should be linked to the deployed decision and jurisdiction, not reduced to one universal metric. Conduct defects can create remediation cost, customer loss and restrictions on use.
20. Map regulatory acceptance
Regulatory acceptance is a product-state, use-case and version question. California's December 2024 catastrophe-modelling regulation created a pathway for forward-looking models in residential and commercial property ratemaking, accompanied by transparency and coverage commitments. The Department has continued model review and public-model work. Other jurisdictions have different filing and disclosure requirements.
The target should maintain a regulatory-use matrix showing customer, jurisdiction, purpose, model, filing status, conditions and renewal. Informal customer comfort should not be presented as approval. A filing that references a model can also impose documentation and change-management obligations.
The buyer should review regulator questions, actuarial support, objections and commitments. It should identify versions embedded in approved rates or rules. Expansion value should be staged until relevant acceptance is evidenced. Regulatory capability can be valuable when documentation, testing and response processes are reusable across customers.
21. Analyse distribution channels
Wildfire analytics can reach insurance decisions through carriers, reinsurers, brokers, managing general agents, delegated administrators, inspection networks, property platforms and public programmes. Each channel has different authority, economics and integration. A broker tool can influence submission quality without controlling underwriting. A managing general agent may embed the model in delegated rules.
The buyer should map end user, contracting party, payer and decision owner. Revenue can appear diversified across intermediaries while depending on a small number of carrier appetites or data providers. Channel conflict can arise if the target sells similar risk intelligence to both capacity providers and distributors.
Contracts should define use, responsibility, audit, data rights and downstream access. Diligence should test renewal by channel and measure implementation effort. Distribution value is strongest when the model is embedded in repeatable workflow, produces documented outcomes and remains portable across capacity relationships.
22. Test delegated authority and controls
Managing general agents and delegated underwriters can use wildfire analytics within binding authority. The capacity provider needs evidence that rules, referrals and aggregations operate as agreed. The target can support this control environment, but it should not blur the allocation of underwriting responsibility.
The product should version rules, authority limits, thresholds and exceptions. It should record who bound the risk, which model version applied and whether required referral occurred. Portfolio views should reconcile to policy and bordereaux data. Customer-specific code outside governed release processes creates control risk.
The acquirer should inspect audit findings, breaches, remediation and capacity-provider reporting. It should evaluate whether the software reduces monitoring cost or simply adds another reconciliation. Revenue attached to one delegated programme should be stress-tested for capacity withdrawal. The transaction model should reflect concentration and reimplementation risk.
23. Use claims feedback carefully
Claims and damage data can improve vulnerability and loss models. They can also encode policy terms, claims practices, insurance penetration and event response. A non-claim does not prove no damage. Paid loss is not a pure physical-loss label. Closed claims may develop over time.
The target should document how claims data are cleaned, matched, adjusted and segmented. It should preserve event, policy, coverage, limit, deductible, valuation and development. Customer data use requires contractual rights and confidentiality controls. Combining customer datasets may be restricted even after de-identification.
The buyer should reproduce selected feedback pipelines and test leakage. It should examine whether model performance is measured against physical damage, claim occurrence, severity or paid loss. Each outcome supports different decisions. Claimed learning advantages should be valued only where rights, quality, representativeness and production use are evidenced.
24. Secure geospatial and customer data
Wildfire platforms can hold precise property locations, building attributes, customer portfolios, underwriting rules and claims information. These data can be commercially sensitive and, depending on jurisdiction and context, personal. Security and privacy controls should cover ingestion, storage, model development, customer tenancy, APIs and exports.
The target should maintain data classification, least privilege, encryption, logging, retention and incident response. Geospatial exports and model APIs can create extraction risk. Development environments should not receive production customer data without controlled need and masking. Third-party imagery and property data can carry additional contractual safeguards.
Diligence should review penetration tests, incidents, customer questionnaires and remediation. It should test tenant isolation and privileged access. Security cost should be included in scale economics. A buyer that combines the platform with broader insurance data should conduct a fresh privacy and threat assessment before integration.
25. Evaluate software and delivery economics
Wildfire analytics revenue can combine licences, API usage, implementation, data, modelling studies, regulatory support and managed services. Annual recurring revenue may contain substantial recurring analyst work. Gross margin should be reconstructed by product, channel and customer cohort.
The target should measure compute, data licences, geospatial processing, support, validation, regulatory response and customer-specific configuration. Event periods can create usage spikes and service demands. Enterprise contracts may include minimums or caps that disconnect usage from revenue.
The buyer should distinguish reusable product from bespoke model work. Services can deepen customer adoption and produce valuable learning, while scalability and margin differ from software. The transaction model should include supplier repricing, cloud cost, validation and insurance-domain talent. Collected cash and renewal by cohort provide stronger evidence than contracted recurring revenue alone.
26. Assess retention and switching
Switching cost can arise from integrations, portfolio history, calibrated thresholds, regulatory filings, trained users and accumulated claims feedback. These features support value only when customers use them and can lawfully continue after the transaction. Lock-in created by inaccessible data or undocumented configuration can increase conduct and integration risk.
Diligence should analyse gross and net retention, price changes, downsells, implementation age and channel. It should identify customers retained through bundled consulting or founder relationships. Reference calls should explore decision use, alternatives, validation, regulatory support and willingness to renew.
The buyer should test whether model changes threaten comparability or filings. Customers may retain a vendor because replacing an approved model is costly, yet renewal can still fail at the next rate cycle. Retention assumptions should align with contract, workflow and regulatory evidence.
27. Build the valuation bridge
IFRS 13 requires fair value to reflect market-participant assumptions. IFRS 3 and IAS 38 frame recognition and measurement of acquired identifiable intangible assets. IFRS 15 requires analysis of the promises in customer contracts. Wildfire scores, public data and customer claims do not automatically become owned assets or revenue.
The valuation should separate software, proprietary models, data rights, customer relationships, contracts and workforce capability. It should distinguish installed recurring revenue, validated workflow expansion, jurisdictional expansion and research pipeline. Each layer has different probability, investment and time to cash.
Buyer synergy should include data licences, model validation, regulatory filings, customer consent, integration and specialist retention. Claims savings or capacity gains require evidence and an allocation method. A large protection gap or rising hazard does not establish accessible revenue for the target.
Table 3. Hypothetical evidence bridge for wildfire-analytics value
| Stage | Annual customer value | Buyer revenue and synergy | Principal adjustment |
|---|---|---|---|
| Management case | 10.5 | 7.2 | Full reported population |
| Data and model-purpose gate | 8.2 | 6.0 | Rights, scale and horizon |
| Validation and governance gate | 6.7 | 4.9 | Performance, drift and controls |
| Workflow and regulatory gate | 5.6 | 3.9 | Decision use and market access |
| Persistence and cash conversion | 4.8 | 3.1 | Concentration, effort and collection |
Values in USD millions are illustrative management assumptions.
28. Construct a hypothetical acquisition
Consider a wholly hypothetical platform with 94 insurer, broker, managing-general-agent and public-sector customers; USD 18.6 million of annual recurring revenue; 22 million scored locations; and 8.4 million underwriting or portfolio decisions. Management assumes USD 10.5 million of annual customer value and USD 7.2 million of buyer revenue and synergy.
Data-rights and model-purpose testing retains 71 customers and 6.3 million decisions. Validation and governance review retains 61 customers and 4.8 million decisions. Workflow and regulatory review retains 53 customers and 3.9 million decisions linked to authorised actions and observable outcomes.
After distribution concentration, delivery-cost and cash adjustments, the framework retains USD 4.8 million of customer value and USD 3.1 million of buyer revenue and synergy. Every amount is hypothetical and demonstrates method only. The adjustment assigns different probability and timing to each evidence state. It does not state that excluded customers or decisions have no value.
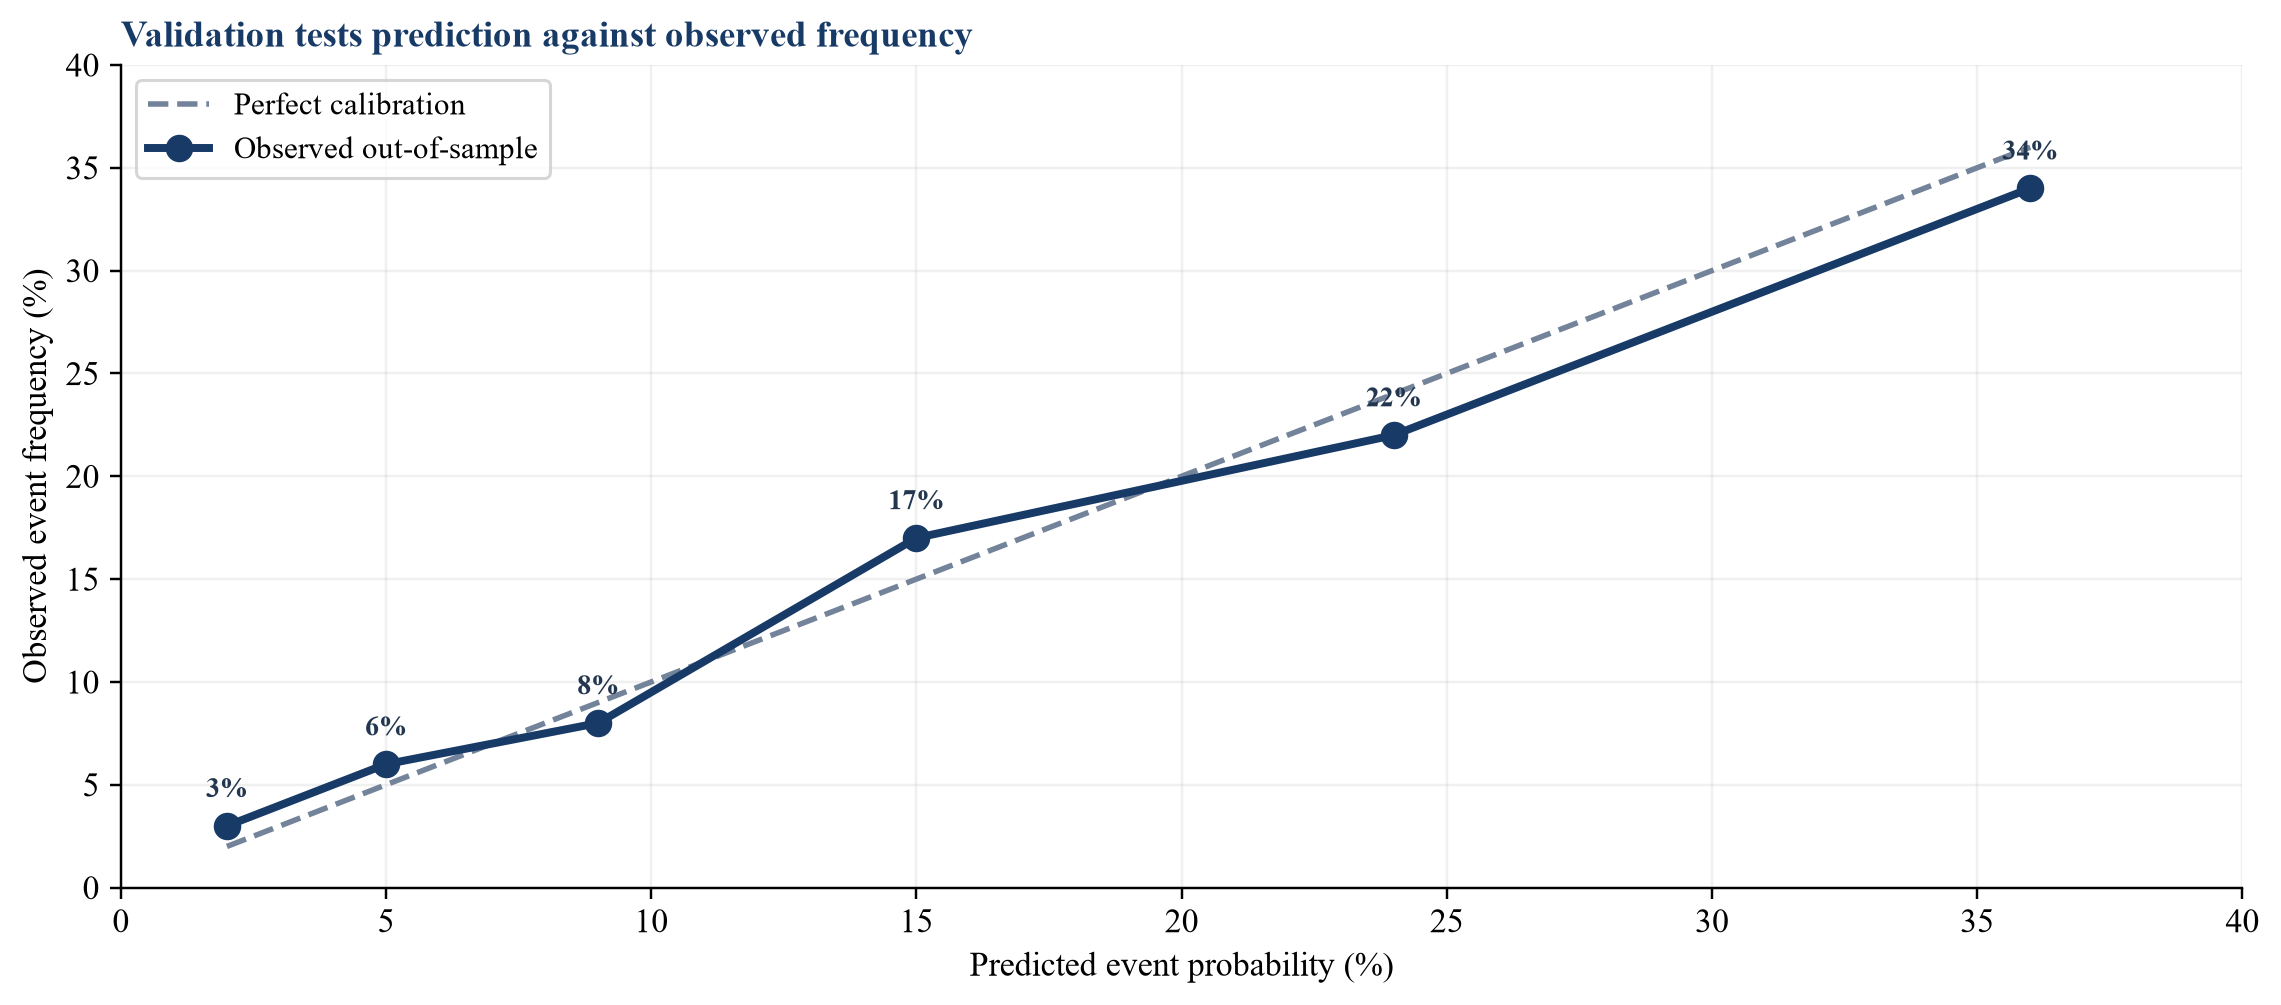
Values are hypothetical; calibration should be tested on relevant out-of-sample populations.
29. Translate evidence into price and terms
Validated installed capability can support value at signing. Unvalidated geographies, proposed model automation and future regulatory acceptance can be funded through milestones. Milestones should reference objective outcomes such as completed validation, approved use, renewal, gross margin or collected cash.
Representations should cover model and data rights, documentation, customer use, filings, claims, security, intellectual property and regulatory correspondence. Holdbacks or indemnities can address defined exposures. The buyer should reserve integration capital for data, model, workflow and filing continuity.
Earn-outs need precise definitions. Wildfire events and regulatory timing sit partly outside management control. Revenue targets should state the treatment of catastrophe-driven usage, customer loss after buyer integration, capacity withdrawal and price changes. Governance should provide access to records and a dispute process. Transaction structure should align payment with evidence becoming usable and durable.
30. Execute diligence and the first one hundred days
The diligence request should include model inventory, data register, licences, source code, validation, monitoring, incidents, customer rules, regulatory submissions, outcomes, contracts, cohorts, service hours, security and financial models. Sampling should cover high-volume customers, high-risk geographies, recent versions, severe events and adverse decisions.
The first thirty days should establish control, freeze production inventories and reconcile customer deployments. Days thirty-one to sixty should reproduce material models and outcomes, close priority validation gaps and confirm regulatory obligations. Days sixty-one to one hundred should harmonise governance, customer evidence, monitoring, distribution controls and board reporting.
Management should report governed decisions, validation findings, drift, overrides, customer outcomes, recurring revenue, service effort, concentration and collected cash separately. Unsupported outcome claims should be removed from forecasts. Integration should preserve model versions and filing evidence before technical consolidation.
Table 4. Diligence gates and first-one-hundred-day ownership
| Workstream | Pre-close evidence | Day-one control | Day-one-hundred outcome |
|---|---|---|---|
| Model | Inventory and validation | Version freeze and owner | Governed model estate |
| Data | Rights, lineage and quality | Access and supplier continuity | Reconciled production inputs |
| Insurance workflow | Rules, overrides and outcomes | Authority and audit logging | Reproduced customer decisions |
| Regulation | Filings and correspondence | Obligation register | Controlled change process |
| Commercial | Cohorts, effort and cash | Renewal and concentration watch | Validated integration economics |
Evidence owners should be named before close and accountable through integration.
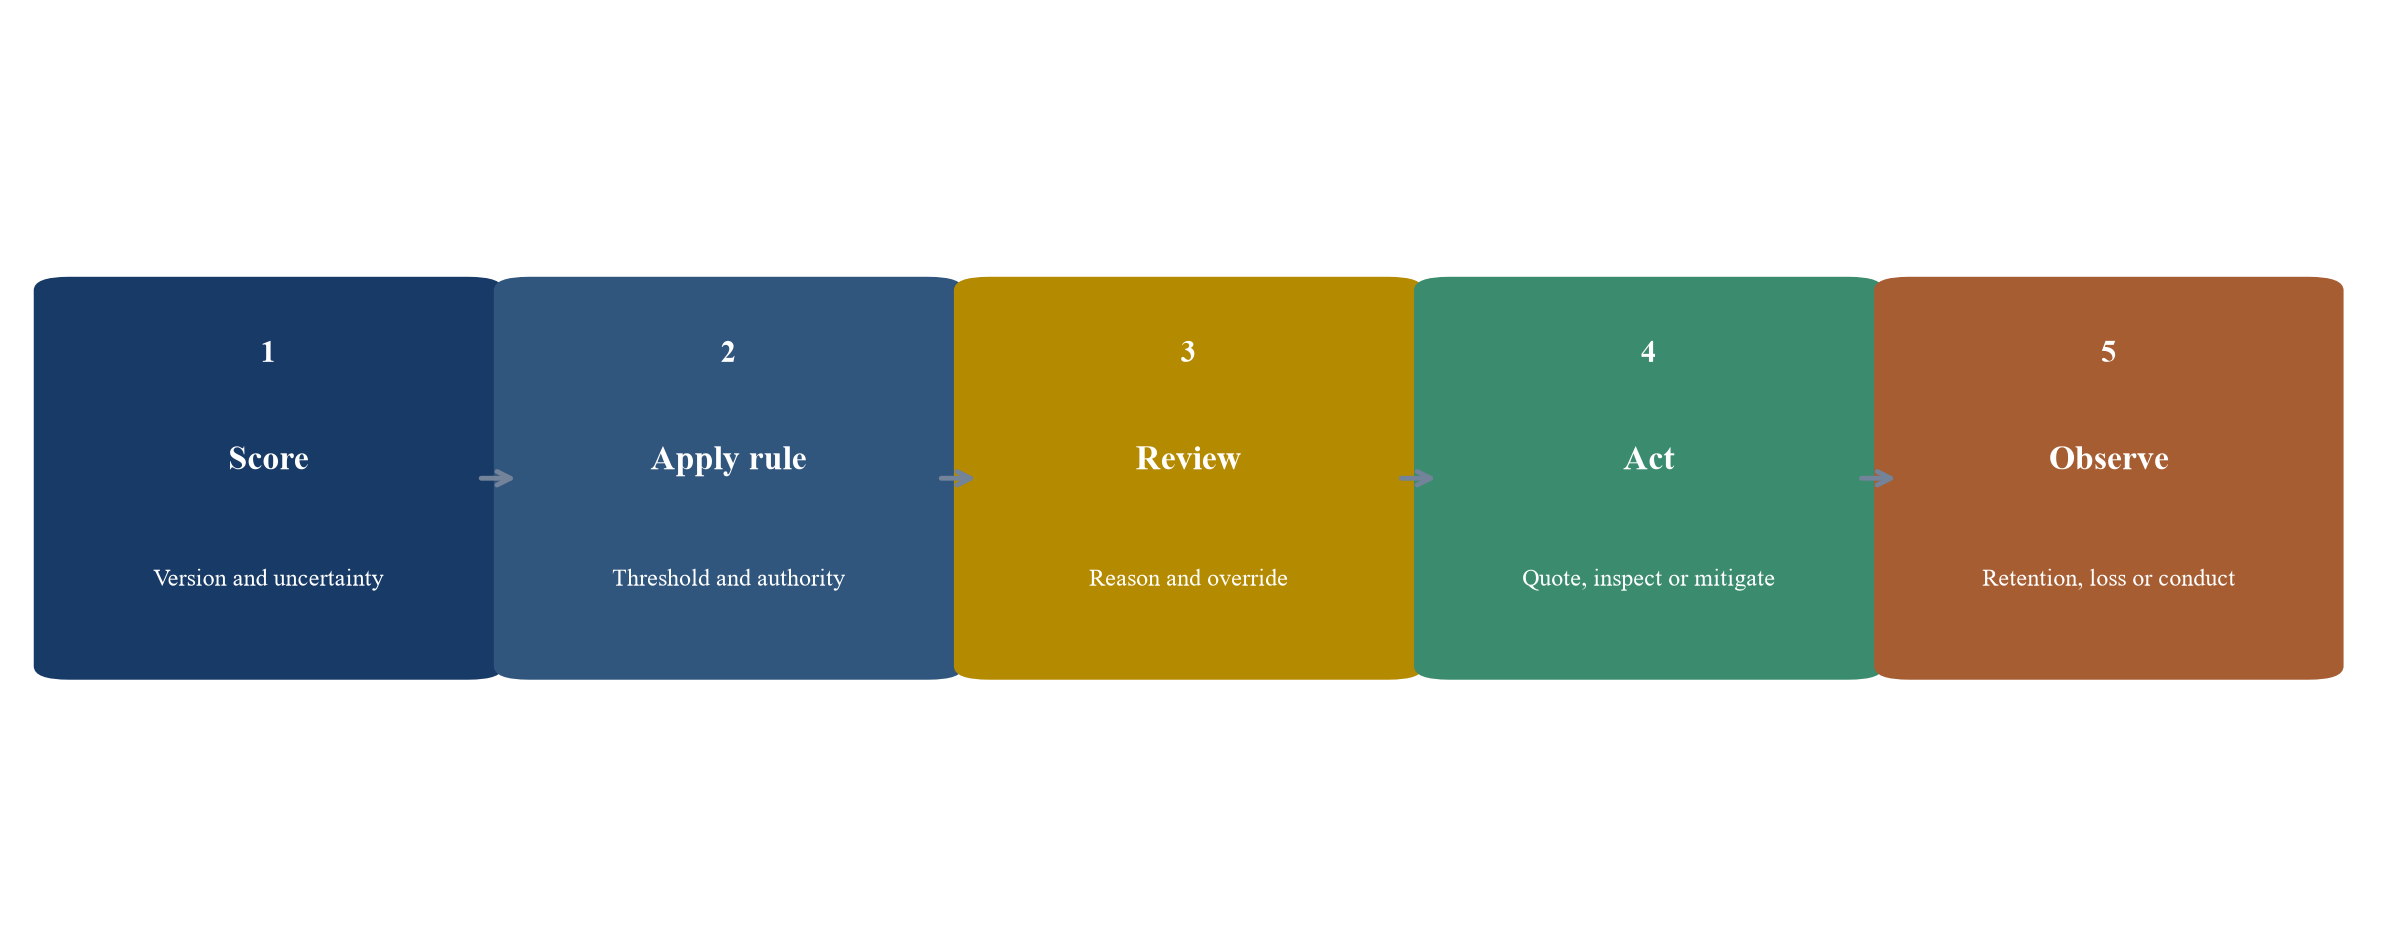
A governed customer workflow records model, authority, override and outcome.
31. Set board and integration controls
Board reporting should distinguish technical performance, insurance outcomes and commercial economics. Technical reporting can cover data quality, calibration, drift, validation issues and incidents. Workflow reporting can cover referrals, overrides, inspections, mitigation and complaints. Commercial reporting can cover renewal, concentration, margin, service effort and cash.
One composite model-health score can hide the source of risk. Separate measures should reconcile through the customer and model inventory. Directors should see which models affect consequential decisions, which limitations are accepted and which remediation constrains growth. Product expansion should require evidence proportionate to use.
Integration should sequence identity, data rights, model versions, customer rules, decision logs and regulatory evidence. Parallel runs may be required for material workflows. Synergy should begin after validated migration. This sequencing preserves comparability, customer confidence and the ability to explain decisions made before and after closing.
32. Recognise limitations and conclude
This framework does not validate a particular wildfire model, insurer, product or transaction. Applicable insurance, data, consumer, accounting and regulatory requirements vary by jurisdiction and use. Current professional advice and independent diligence are required.
The hypothetical case does not estimate market demand, loss reduction or transaction value. Wildfire outcomes are infrequent, spatially dependent and affected by climate, development, mitigation, suppression, policy and claims practice. A favourable historical result does not establish future performance. Public hazard data can support analysis while carrying purpose and scale limitations.
The practical conclusion is that a fire forecast becomes transaction value through a governed chain. The model must be fit for the decision, validated against relevant populations, monitored as conditions change, used with clear authority, accepted within the applicable regulatory context and connected to an outcome for which customers continue to pay. Buyers should price the evidence state they can reproduce today and stage uncertain expansion.
Wildfire analytics can create significant public and commercial value. They can direct scarce inspection and mitigation resources, improve accumulation visibility and support more informed insurance decisions. Their limits must remain visible. The strongest acquisition case connects prediction, decision, outcome and cash without converting a model estimate into an observed fact.
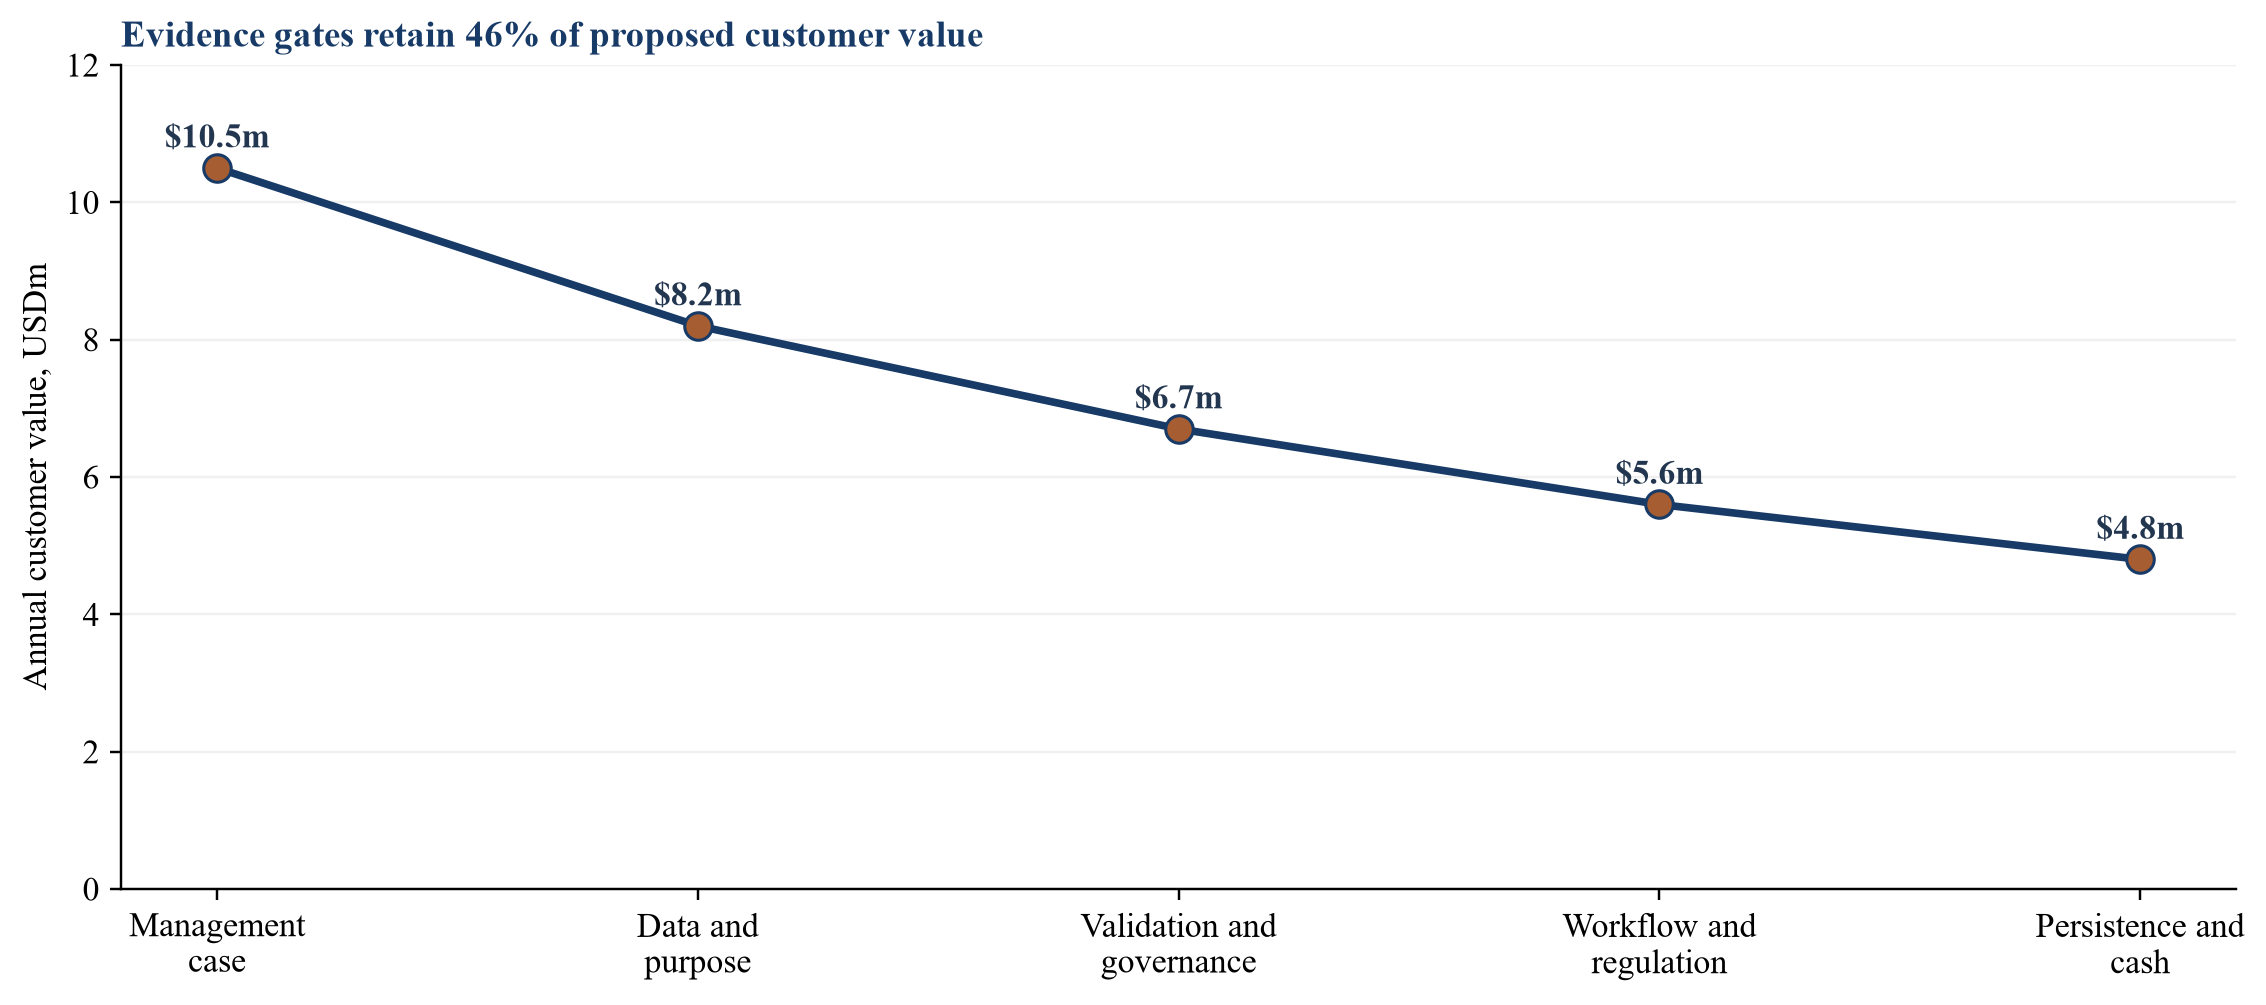
Values in USD millions are illustrative management assumptions.
References
- California Department of Insurance. Catastrophe Modeling and Ratemaking Regulation, December 2024. https://www.insurance.ca.gov/0400-news/0100-press-releases/2024/release062-2024.cfm
- California Department of Insurance. Review of Wildfire Catastrophe Models, August 2025. https://www.insurance.ca.gov/0400-news/0100-press-releases/2025/release055-2025.cfm
- California Department of Insurance. California Public Wildfire Catastrophe Model. https://www.insurance.ca.gov/01-consumers/180-climate-change/public-wildfire-model.cfm
- National Association of Insurance Commissioners. Artificial Intelligence. https://content.naic.org/insurance-topics/artificial-intelligence
- National Association of Insurance Commissioners. Model Bulletin on the Use of Artificial Intelligence Systems by Insurers. https://content.naic.org/sites/default/files/cmte-h-big-data-artificial-intelligence-wg-map-ai-model-bulletin.pdf
- International Association of Insurance Supervisors. Application Paper on the Supervision of Artificial Intelligence, July 2025. https://www.iais.org/uploads/2025/07/Application-Paper-on-the-supervision-of-artificial-intelligence.pdf
- International Association of Insurance Supervisors. Application Paper on the Supervision of Climate-related Risks in the Insurance Sector, April 2025. https://www.iais.org/publications/application-papers/
- USDA Forest Service. Wildfire Risk to Communities. https://research.fs.usda.gov/firelab/products/dataandtools/wildfire-risk-communities
- USDA Forest Service. Wildfire Hazard Potential. https://research.fs.usda.gov/firelab/products/dataandtools/wildfire-hazard-potential
- USDA Forest Service. Quantitative Wildfire Risk Assessment. https://data.fs.usda.gov/geodata/rastergateway/qwra/index.php
- USDA Forest Service. Wildfire Risk to Communities Data Viewer, May 2026. https://research.fs.usda.gov/firelab/products/dataandtools/wildfire-risk-communities-data-viewer
- Federal Emergency Management Agency. National Risk Index Technical Documentation, December 2025. https://www.fema.gov/sites/default/files/documents/fema_national-risk-index_technical-documentation.pdf
- U.S. Geological Survey. Fire Danger Forecast. https://www.usgs.gov/fire-danger-forecast
- U.S. Geological Survey. Artificial Intelligence in the Ecosystems Mission Area, July 2025. https://www.usgs.gov/mission-areas/ecosystems/science/artificial-intelligence-usgs-ecosystems-mission-area
- National Institute of Standards and Technology. Artificial Intelligence Risk Management Framework. https://www.nist.gov/itl/ai-risk-management-framework
- National Institute of Standards and Technology. AI RMF Playbook. https://www.nist.gov/itl/ai-risk-management-framework/nist-ai-rmf-playbook
- Board of Governors of the Federal Reserve System. Revised Guidance on Model Risk Management, April 2026. https://www.federalreserve.gov/supervisionreg/srletters/SR2602.htm
- IFRS Foundation. IFRS 3 Business Combinations. https://www.ifrs.org/issued-standards/list-of-standards/ifrs-3-business-combinations/
- IFRS Foundation. IFRS 13 Fair Value Measurement. https://www.ifrs.org/issued-standards/list-of-standards/ifrs-13-fair-value-measurement/
- IFRS Foundation. IFRS 15 Revenue from Contracts with Customers. https://www.ifrs.org/issued-standards/list-of-standards/ifrs-15-revenue-from-contracts-with-customers/
- IFRS Foundation. IAS 38 Intangible Assets. https://www.ifrs.org/issued-standards/list-of-standards/ias-38-intangible-assets/
About the Author
Chennakeshav (CK) is a corporate finance and investment banking executive with 25+ years of global experience in deal origination, structuring and execution across M&A, growth capital and corporate strategy. He has led value-creation mandates for founders, corporates and funds — bridging the boardroom view to hands-on execution and close.
His career spans Morgan Stanley, HSBC, Lloyds Banking Group, EWEC, ADQ portfolio companies and Emirates Growth Fund, across TMT, real estate, fintech, deeptech, cleantech, infrastructure and energy. He has partnered with C-suite leaders, private equity and venture funds, sovereign wealth funds and family offices to finance complex fund raises and scale-up ventures, and has led M&A due diligence, post-merger integration and business-transformation initiatives to create value.
At Matchpoint Partners he is Managing Partner, leading the firm's corporate finance, M&A and capital-raising practice. He holds an MBA from London Business School, an engineering degree from VTU and a Master of Laws (LLM, in progress) from UCL London.
An active start-up mentor, CK mentors at Techstars, DIFC FinTech Hive, Startup Grind, Founder Institute and IN5, serves as Entrepreneur Mentor in Residence (EMiR) at London Business School, and judges the Entrepreneurship World Cup.
https://www.linkedin.com/in/ckadya/
https://www.matchpoint-partners.com/team/ck-adya.html
This paper is part of a continuing series on the structure of private and alternative markets. The views expressed are the author's own. The paper is for information only, describes market structure in general terms, and does not constitute investment, legal, tax or regulatory advice or a recommendation in respect of any security, vehicle or counterparty.
