
1. Define the acquisition decision
The buyer must decide how much value to assign to a water-risk AI business whose outputs may influence production scheduling, cooling, cleaning, treatment, reuse, procurement, maintenance, capital allocation and site strategy. The asset is a controlled industrial decision system. A persuasive map or forecast has limited transaction value when the buyer cannot establish its purpose, permitted use, facility connection, action history and financial outcome.
Water analytics operate across different decisions. Basin screening can prioritise diligence. A short-term drought or supply forecast can support contingency planning. A plant water balance can identify losses. A process model can change operating parameters. A capital model can rank treatment or reuse investments. The evidence required for each purpose differs.
The acquisition framework tests six propositions. The decision and accountable user are defined. Data rights and measurement systems are transferable. The model is fit for the relevant place and horizon. Recommendations enter an authorised workflow. Savings or avoided losses are measured against a defensible baseline. Revenue persists after concentration, service effort and integration cost. Failure at one layer changes the amount, timing or certainty of transaction value.
Table 1. Evidence required before industrial water-risk AI receives transaction value
| Evidence layer | Core question | Minimum record | Transaction consequence |
|---|---|---|---|
| Basin context | What external water condition matters? | Indicator, source, date, scale and limitation | Defines screening relevance |
| Facility dependence | How does the site obtain and use water? | Source, volume, quality, process and discharge | Defines operational exposure |
| Model | Is the output fit for its decision? | Purpose, version, inputs, validation and uncertainty | Supports technical reliance |
| Workflow | Who reviews and acts? | Threshold, authority, action and override | Supports practical use |
| Outcome | What changed relative to baseline? | Metered volume, cost, production and conditions | Supports customer value |
| Economics | Does verified use produce scalable cash? | Renewal, effort, margin and collection | Supports transaction value |
Basin, facility, workflow and commercial evidence should be tested together.
2. Separate basin risk, facility dependence and process use
Water risk is not one variable. Basin conditions describe competition, variability, drought, flood, quality and governance. Facility dependence describes source, entitlement, storage, treatment and discharge. Process use describes where water enters production and what quality or continuity the process requires. Financial consequence adds production margin, downtime, energy, chemicals, effluent, compliance and capital.
WRI Aqueduct combines physical quantity, physical quality, regulatory and reputational indicators. WRI also states that overall water risk cannot be directly measured and that the Atlas is a prioritisation tool requiring local investigation. This limitation is commercially important. A high basin score does not prove that a particular site will lose supply, and a low score does not prove operational resilience.
Diligence should map every output to its layer. A basin indicator should not be presented as plant savings. A plant consumption anomaly should not be presented as avoided business interruption without operational evidence. Transaction value should follow the controlled product actually used and the outcome it can support.
3. Define the customer workflow
Industrial customers can use water-risk AI in site selection, sourcing, production planning, leak detection, process control, cleaning, cooling, treatment, reuse, maintenance, capital planning and supplier management. Each workflow requires an authorised user and an action. A plant manager may adjust a rinse cycle. A utilities engineer may investigate a balance variance. A treasury or strategy team may fund storage or reuse after scenario analysis.
The buyer should trace representative forecasts and recommendations through source systems, approvals and outcomes. A dashboard view or alert does not establish action. The trace should identify the model version, input vintage, threshold, recipient, review, override, work order, operating change and later measurement. Where a recommendation was rejected, the reason should be retained.
The workflow must fit industrial control boundaries. Recommendations that could affect product quality, safety, emissions or equipment integrity require defined engineering review. The vendor may support decisions while the operator retains authority. A reproducible workflow creates value because it connects analytics to accountable action.
4. Build the water data register
Water-risk platforms can use utility meters, abstraction meters, flow sensors, tank levels, pressure, quality measurements, laboratory results, production counts, weather, river flow, groundwater, permits, tariffs and supplier data. Each source has an owner, unit, frequency, accuracy, calibration record, licence and retention period. The data register should connect every material model feature to its source, transformation and production version.
Public data can be valuable, but public availability does not guarantee completeness, local accuracy or unrestricted redistribution. WRI Aqueduct is a screening resource rather than a real-time operational dataset. National hydrological and meteorological agencies can offer more current observations, while station coverage, maintenance and revision policies vary. Plant sensors can provide detail while suffering drift, fouling, outages and timestamp errors.
Diligence should reproduce selected data flows from raw record to customer output. It should test units, time zones, missingness, interpolation, sensor changes and site identifiers. Data quality should be evaluated at the decision threshold, because small errors can change an alert or savings claim.
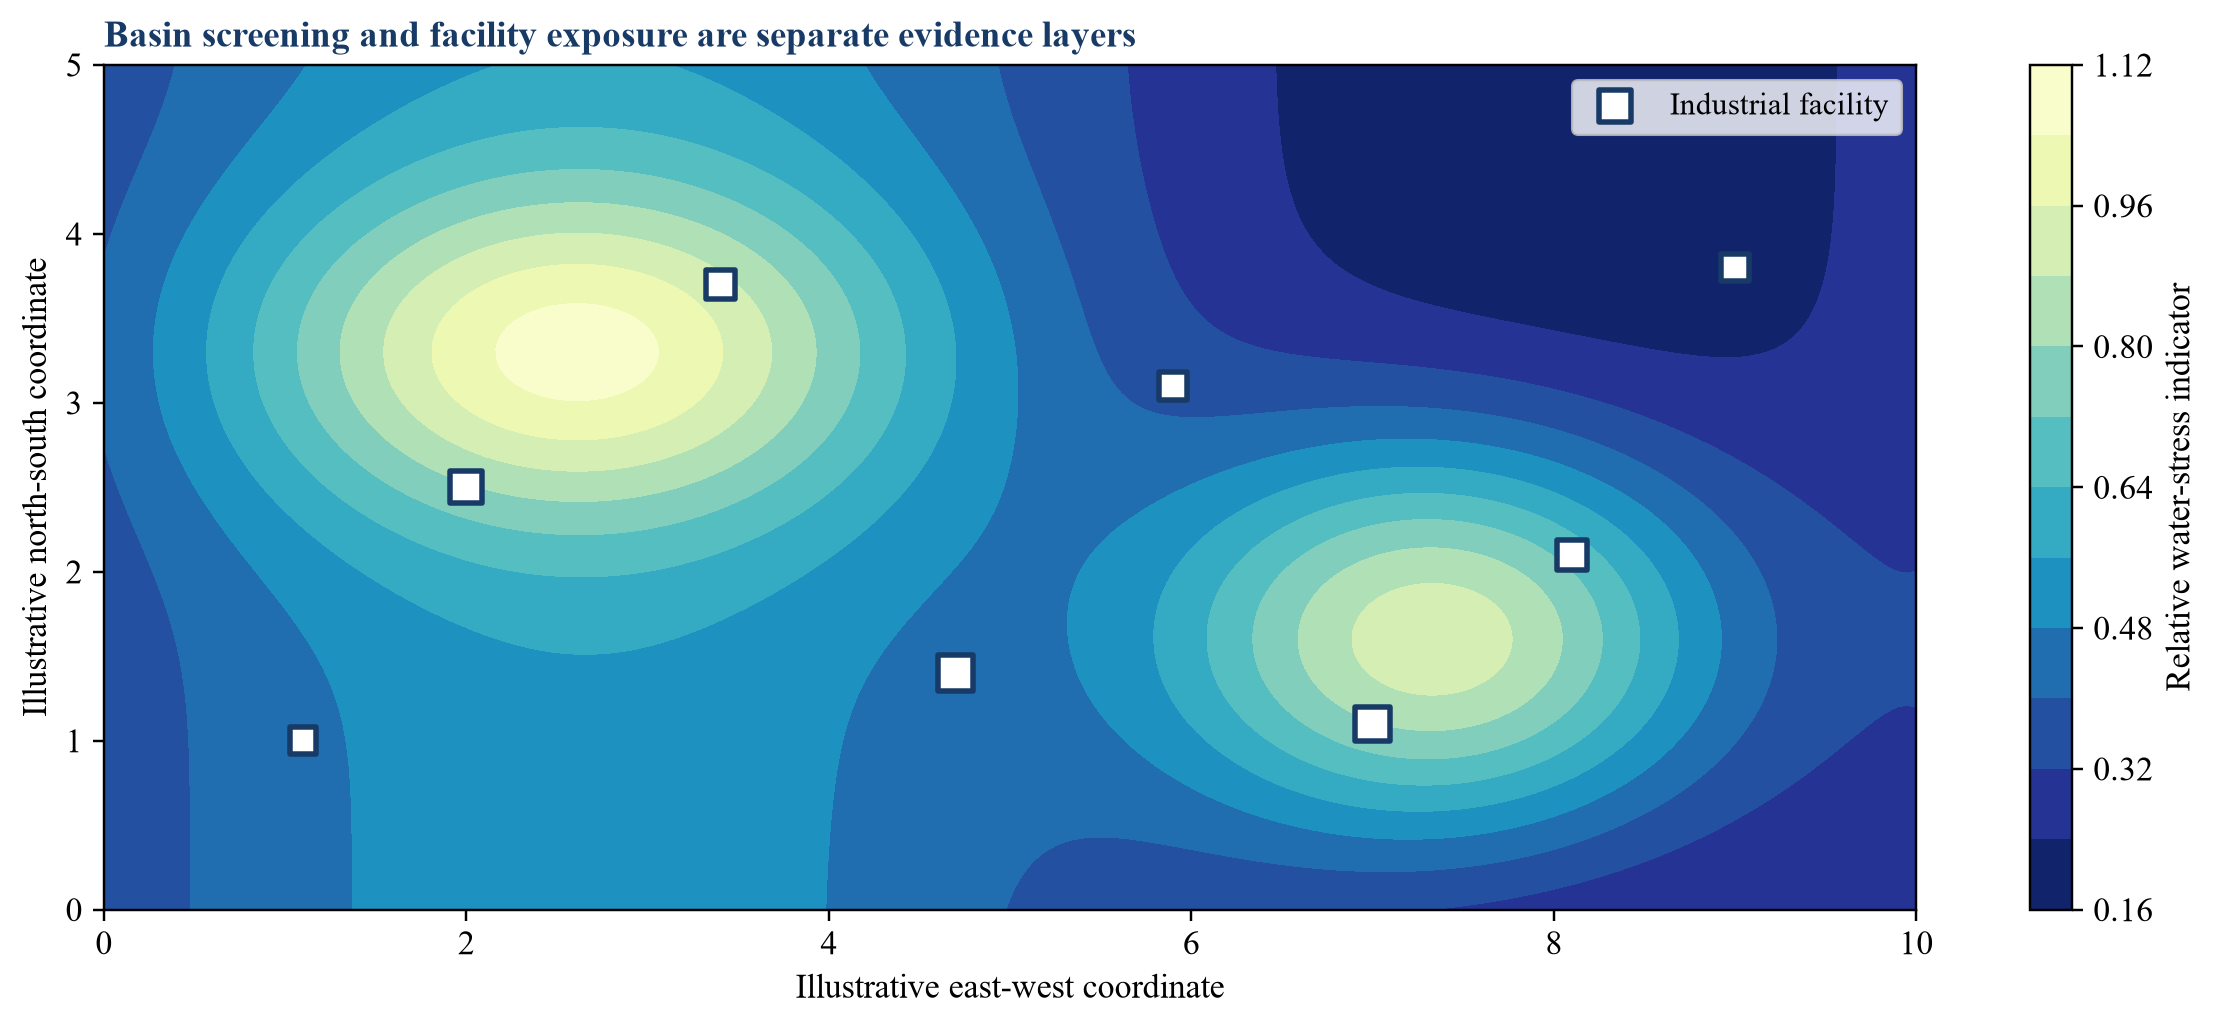
The visual separates a regional screening surface from facility locations; it is illustrative and not a geographic forecast.
5. Establish basin and local hazard context
Basin screening should identify the relevant catchment, aquifer, utility system and competing users. The analysis should record baseline water stress, seasonal variability, drought, flood, quality, governance and projected change. WRI Aqueduct can support comparative screening, while site decisions require local hydrology, infrastructure, permits, operator records and current professional assessment.
Spatial scale matters. A basin average can conceal a constrained sub-catchment, an isolated utility zone or a site with dedicated storage. Administrative boundaries can differ from hydrological boundaries. Groundwater and surface water can respond differently. The platform should explain geocoding, boundary assignment and how a site with several sources is represented.
Temporal scale also matters. Long-run climate scenarios cannot substitute for near-term supply information. Seasonal outlooks cannot establish a thirty-year asset case. Diligence should test the relationship between forecast horizon and customer decision, including update frequency, cutoff dates and latency. Valuation should distinguish a screening product from an operating product.
6. Reconstruct the facility water balance
A facility water balance reconciles inflows, storage change, process use, reuse, evaporation, product incorporation and discharge. ISO 46001 treats measurement, monitoring, documentation and continual improvement as core elements of water-efficiency management. A credible AI product should operate within this control system rather than substitute a prediction for the underlying balance.
The buyer should obtain diagrams, meter lists, calibration records, maintenance history and reconciliations. It should test whether reported withdrawals equal the sum of measured and estimated uses within an accepted tolerance. Unmetered branches and shared services should be disclosed. A model can infer missing flows, but inferred values must remain identifiable.
Balance error can create false savings. A replaced meter, changed product mix or altered discharge estimate can reduce reported consumption without reducing physical use. The target should retain revisions and prevent retroactive baseline changes without approval. Transaction value should follow sites with governed balances and repeatable measurement.
7. Calculate the true cost of water
The purchase price of water is only one component of economic value. The U.S. Department of Energy's Better Plants resources encourage facilities to calculate the true cost of water, including acquisition, pumping, treatment, heating or cooling, chemicals, wastewater and handling. Production interruption, quality failure and compliance exposure can be larger than the tariff.
The target should define a cost tree for each site and process. Direct costs can use invoices, energy meters, chemical consumption and labour. Avoided capital should include timing and capacity assumptions. Avoided downtime should use contribution margin and credible outage duration. A scarcity premium should not be inserted without a defined scenario and probability.
The buyer should separate accounting savings, cash savings, capacity release and avoided risk. These categories support different valuation treatment. A reduction in energy and chemicals can be observed quickly. A lower probability of future disruption is scenario-dependent. The evidence ledger should preserve that distinction.
8. Establish a model inventory
The target may use time-series forecasting, anomaly detection, optimisation, computer vision, digital twins, geospatial models, language models and rules. It may rely on third-party weather, satellite, hydrological, enterprise or industrial-control systems. The inventory should identify every production model, owner, purpose, version, customer deployment, upstream dependency and downstream decision.
The NIST AI Risk Management Framework organises work through Govern, Map, Measure and Manage. Those functions provide a practical diligence structure even when the target is outside a regulated financial institution. The buyer should map materiality to the consequence of a wrong recommendation, including production loss, product quality, worker safety and environmental compliance.
Rules, spreadsheets and operator adjustments that materially change an output belong in the inventory. Diligence should compare source control, model registry, deployment records and production traffic. A complete inventory is a precondition for evaluating intellectual property, validation coverage, technical debt and integration cost.
9. Test development data and the target population
Model performance depends on the relationship between development data and the facilities where it is sold. Industrial sites differ by process, climate, water source, operating schedule, instrumentation and maintenance. A large dataset can remain narrow if most observations come from one customer, sector or sensor design.
The target should document inclusion, exclusion, missing data, label construction, normalisation and leakage controls. Training on future production information or post-event maintenance records can make a model appear more accurate than it is in use. Site-level splits are often more demanding than random observation splits because adjacent observations share operating conditions.
Diligence should compare production customers with development and validation populations. Expansion from food processing to semiconductors, or from temperate utility supply to arid groundwater, is a new validation question. Market opportunity should remain separate from demonstrated portability.
10. Require independent validation
Validation should be independent of model development in authority and evidence, with rigor proportionate to use. It should assess conceptual soundness, data, implementation, performance, limitations and monitoring. A single holdout score does not establish fitness for a plant-control or capital decision.
Validation should use relevant time periods and whole-site holdouts. It should test high-demand seasons, shutdowns, meter failures and operational changes. Where the model recommends an intervention, validation should test the recommendation and the outcome pathway rather than prediction error alone.
The buyer should reproduce headline metrics and inspect negative results. Validation records should show findings, severity, owners, closure and accepted limitations. Customer-funded pilots can provide evidence, while independence, sample selection and commercial incentives should be explicit. Price should reflect validated use rather than the broadest marketing claim.
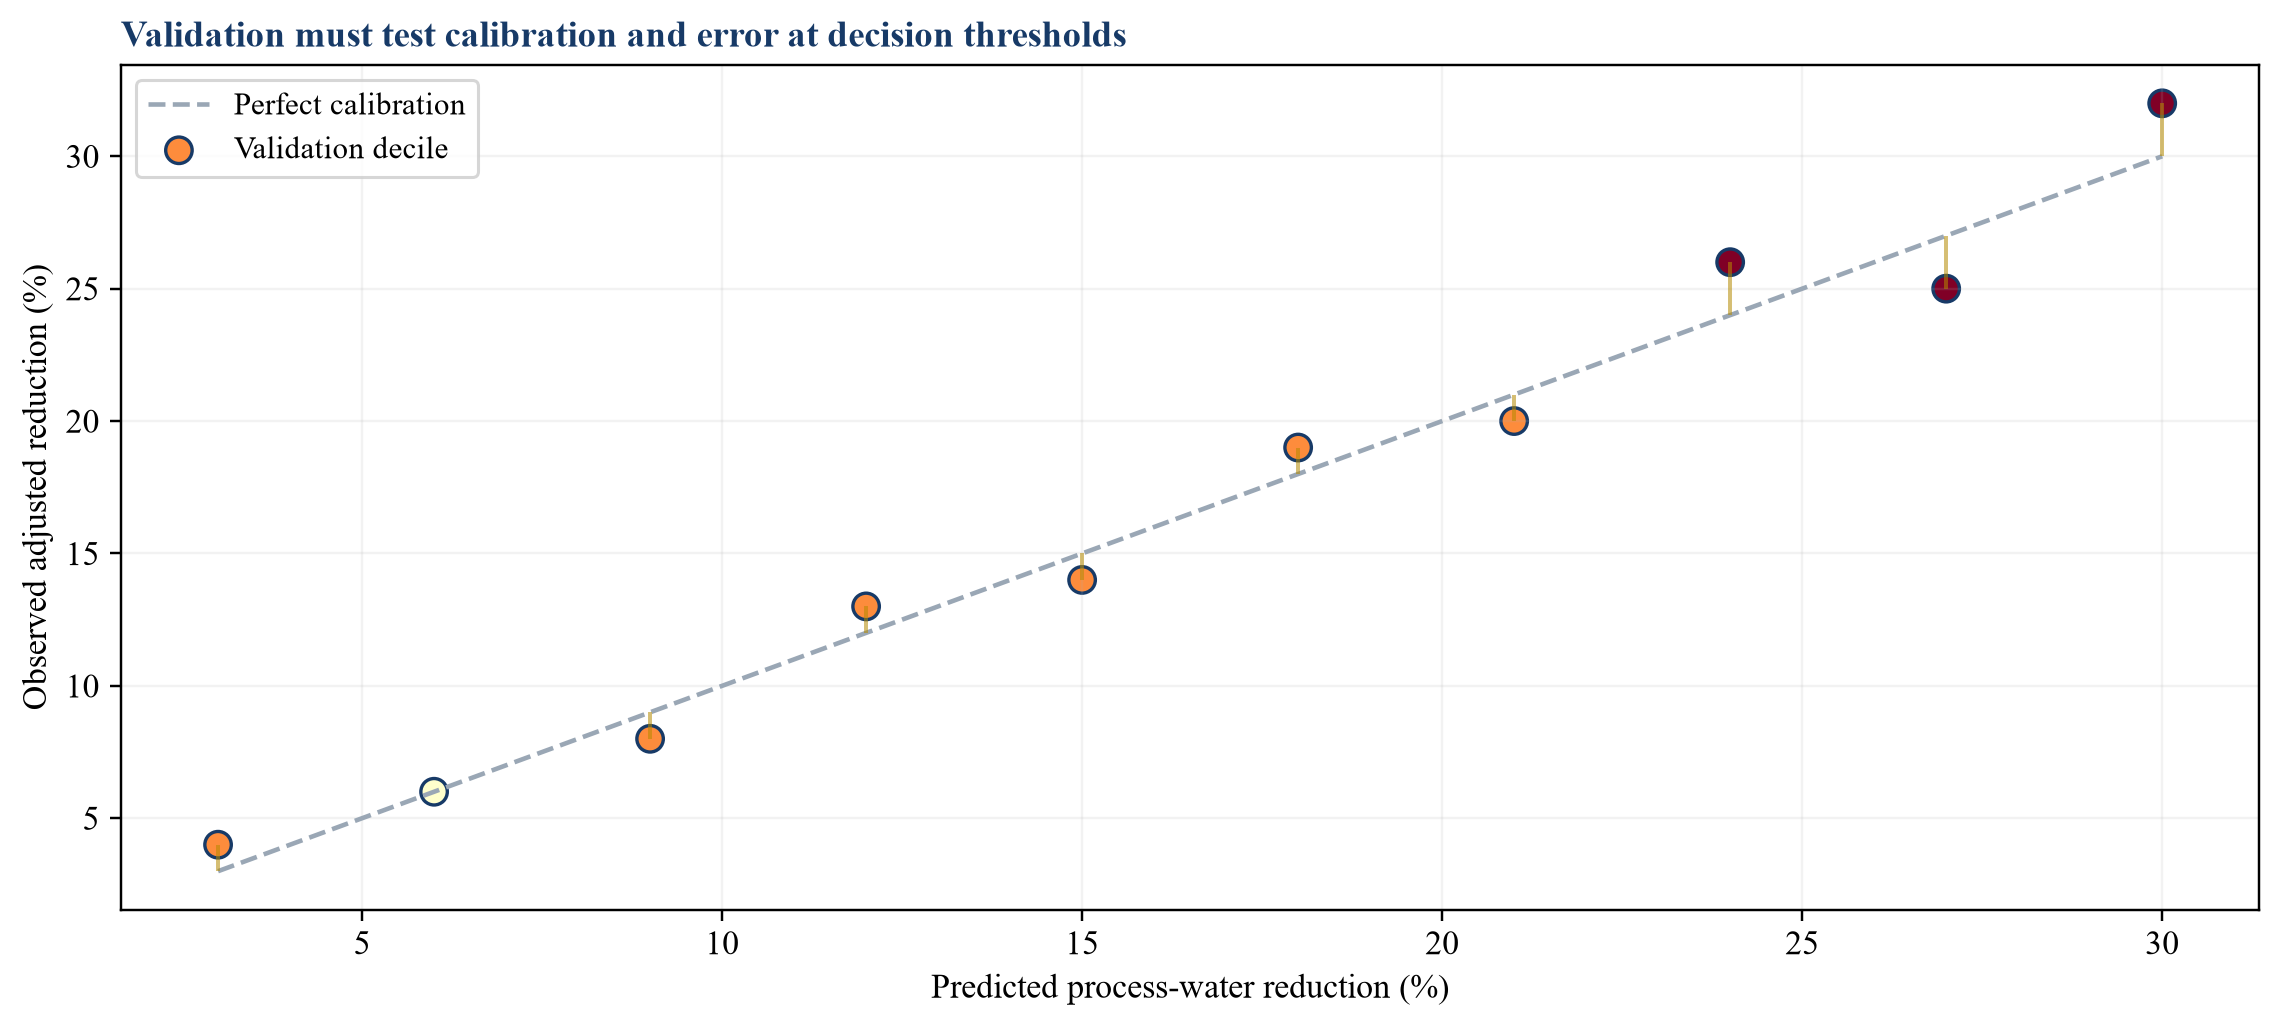
Values are hypothetical; calibration and error should be assessed at production thresholds and relevant sites.
11. Measure calibration, error and operational consequence
Forecast error should be evaluated in the units used by the decision: flow, volume, quality, pressure, demand, cost or downtime. Percentage error can appear favourable at high-volume sites while masking consequential peak errors. Aggregate accuracy can conceal systematic bias for a sector, water source or operating state.
The target should report bias, absolute error, interval coverage, false alarms and missed events over time and relevant segments. Threshold analysis should show what happens when an alert triggers investigation or an optimiser recommends a setpoint. The financial consequence of a missed shortage differs from the cost of an unnecessary inspection.
The acquirer should connect error metrics to service levels and customer outcomes. It should test whether recalibration changes actions, savings or contract commitments. Where the output is a relative risk score, product documentation should prevent customers from interpreting it as a probability. Valuation should reward reproducible decision performance.
12. Quantify uncertainty and scenario dependence
Water outcomes contain inherent variability and knowledge uncertainty. Rainfall, demand and infrastructure failure create variability. Sparse sensors, uncertain basin models, future climate pathways and customer behaviour create knowledge uncertainty. A point forecast can conceal both.
The platform should provide uncertainty appropriate to the use. Short-term demand forecasts can include prediction intervals. Drought planning can use several hydrological and operating scenarios. Capital analysis can show sensitivities to tariff, production, reuse yield and outage duration. Missing-data flags and model-confidence indicators should influence escalation.
Diligence should inspect whether uncertainty is calculated, communicated and used. A narrow interval from an incomplete model can create false confidence. The buyer should test sensitivity to weather, meter accuracy, process schedule, product mix and intervention persistence. Transaction value should follow the model's ability to support proportionate decisions under uncertainty.
13. Monitor drift and change
Models can drift as climate, production, recipes, equipment, tariffs, permits, sensors and operators change. Data suppliers can alter station coverage or feature definitions. A customer can reconfigure a process without updating the model. Monitoring must separate input drift, performance drift and policy change.
The target should define thresholds, review frequency, escalation, recalibration and retirement. Monitoring should cover missingness, sensor health, feature distributions, residuals, alerts, overrides, work orders and later outcomes. Planned shutdowns and maintenance require separate treatment because they change normal operating patterns.
The buyer should inspect the history of changes and incidents. Stable portfolio accuracy may conceal deterioration at important sites. Monitoring records should reach responsible owners and customer communications. Ongoing model and data cost belongs in margin forecasts. A high-touch model can remain valuable, with economics different from a self-maintaining software product.
14. Control third-party data and models
Water-risk platforms often combine public basin data, utility information, satellite observations, weather feeds, cloud services and customer operational data. The buyer inherits dependencies beyond the target's control. Contracts should be reviewed for assignment, change of control, audit, service levels, data reuse, derived data and termination.
The target should support customers with documentation about sources, transformations, limitations and incidents without breaching vendor restrictions. A black-box hydrology or optimisation component can constrain explanation and validation. Public-source changes can also break reproducibility when versions are not archived.
Diligence should identify substitution cost and operational concentration. It should test outages, delayed feeds and changed schemas. Valuation should separate proprietary capability from licensed inputs and customer configuration. Gross margin can decline when a provider reprices or customers require additional verification.
15. Apply proportionate AI governance
AI governance should reflect the consequence of use. A model that prioritises a leak survey has a different risk profile from a model that autonomously alters process conditions. The NIST framework supports risk-based governance, while industrial safety, environmental and quality systems define additional boundaries at each customer.
The vendor should document purpose, data, development, performance, limitations, monitoring, security, human oversight and change. Marketing descriptions should align with the actual technology. A rules engine, statistical forecast, optimiser and generative assistant create different risks. Generative output should not become an operating instruction without controlled retrieval, review and authority.
The acquirer should test whether the target can answer customer diligence efficiently. Governance assembled separately for each sale creates cost and inconsistency. Reusable evidence can support faster onboarding and renewal. Governance readiness is therefore both a control and an operating capability.
16. Preserve human authority and overrides
Industrial decisions require clear authority. A model may recommend inspection, setpoint change, maintenance, storage or curtailment. The operator remains responsible for safety, quality, environmental and production decisions. The product should present evidence, uncertainty and limitations in a form that supports review.
Overrides are valuable evidence when they capture user, time, reason and outcome. High override rates can signal poor model fit, stale configuration or workflow resistance. Very low rates can signal automation bias or weak logging. The target should analyse both without treating every override as an error.
The buyer should inspect permissions, escalation and audit logs. It should sample accepted and rejected recommendations and compare later evidence. Human review should not become an undocumented repair layer. The transaction model should include the staffing and workflow required for responsible use at greater scale.
17. Connect predictions to operational action
The core commercial test is whether the model changes an authorised action. Relevant actions include investigating a leak, repairing a valve, changing a cleaning sequence, adjusting cooling, shifting production, treating water differently or funding reuse. Each action should have a work order, responsible owner and completion evidence.
An alert alone has little value when customers cannot act because of production, labour, capital or safety constraints. The target should measure alert-to-review, review-to-action and action-to-outcome conversion. It should identify recurring recommendations that customers repeatedly defer.
The acquirer should build an outcome ledger linking model version, site, recommendation, authority, action, cost and result. Attribution should account for planned maintenance and other programmes. Customer value should follow completed actions and measured outcomes, with scenario value reported separately.
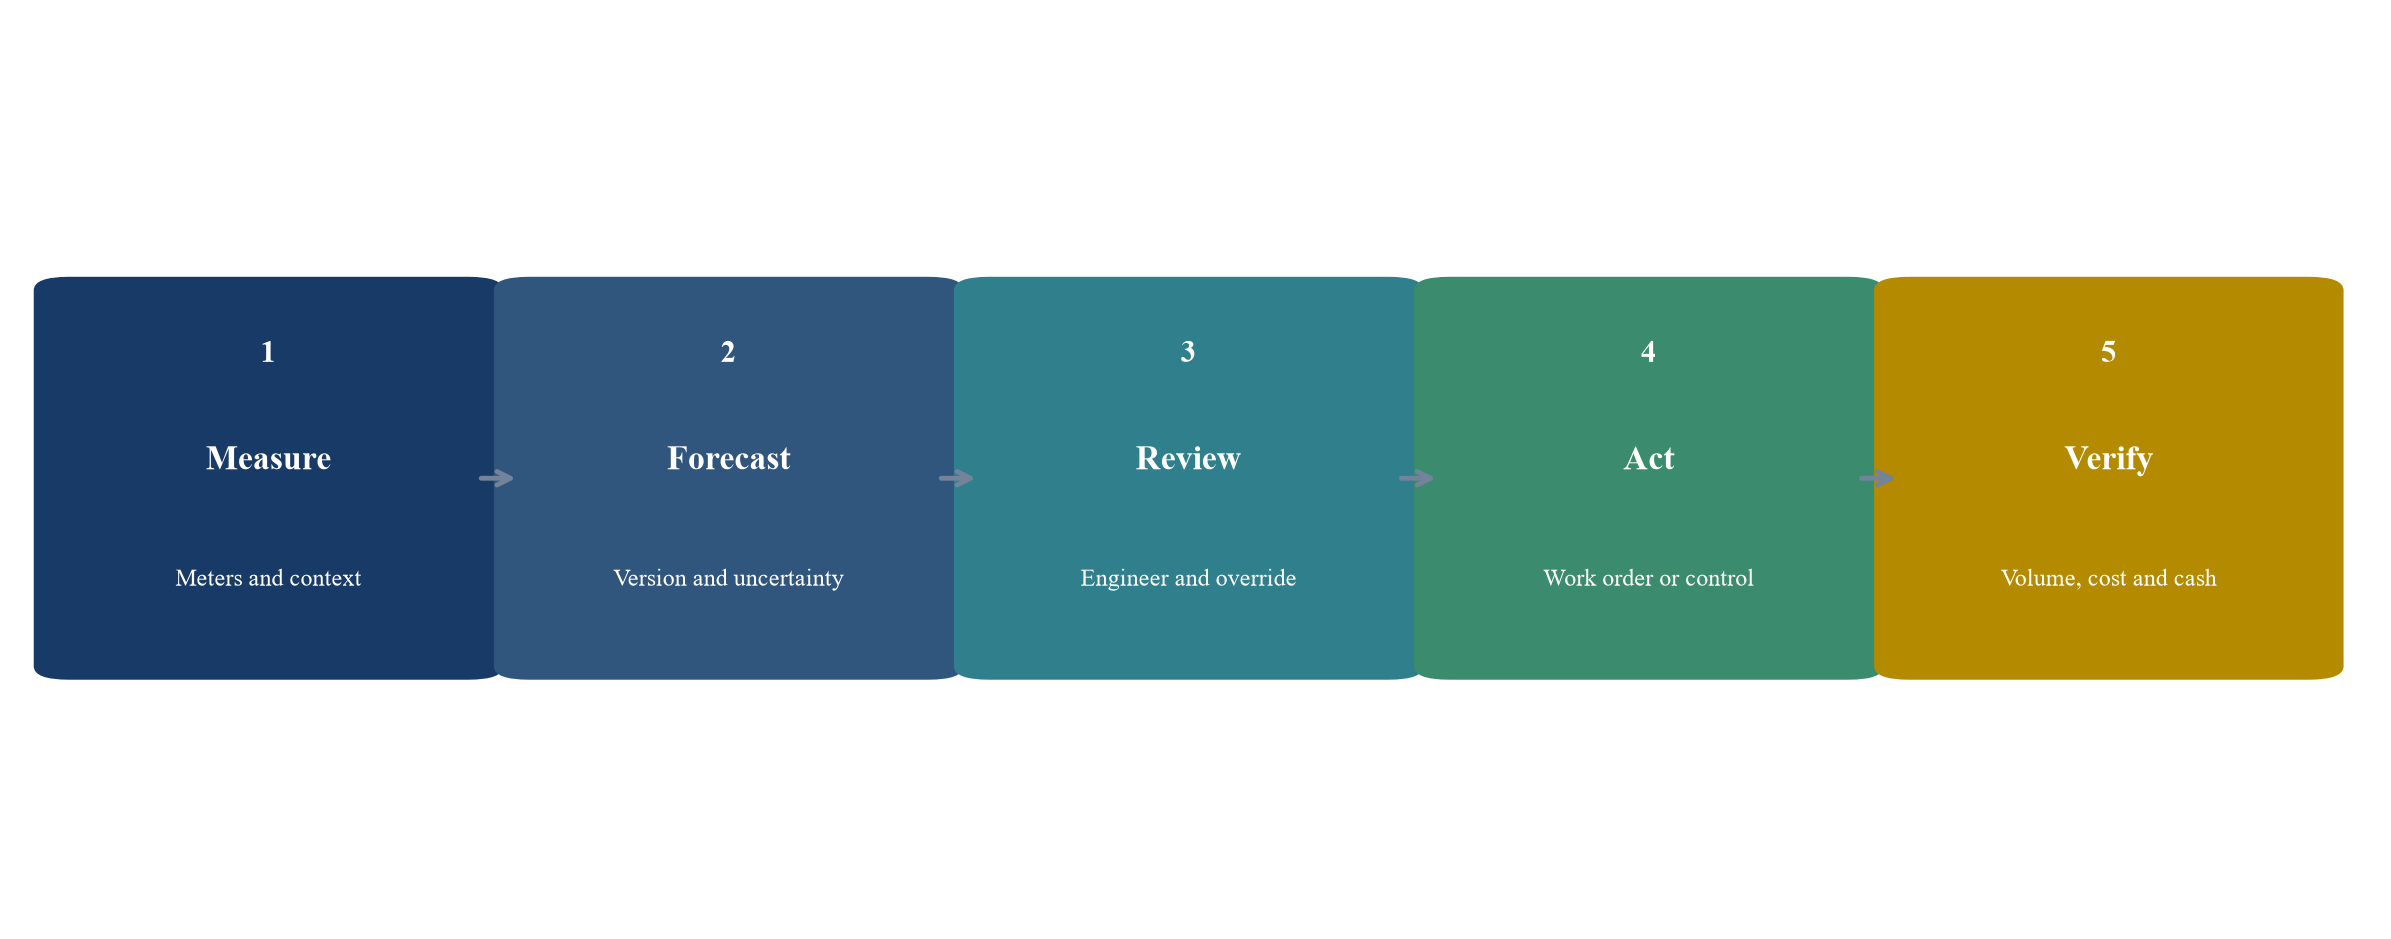
A governed workflow records model, authority, action and measurement.
18. Establish the savings baseline
Savings require a credible counterfactual. The baseline should define the pre-intervention period, operating conditions, production, weather, water quality, maintenance and exclusions. A simple comparison with the prior month can be misleading when output or product mix changes.
The target should predefine baseline rules and retain source data. Suitable methods can include normalised intensity, matched operating periods, engineering calculations or controlled pilots. The method should be proportionate to the claim. Large or contractually guaranteed savings require stronger measurement and verification.
The buyer should test whether management selected favourable periods, removed adverse observations or revised baselines after results were known. Savings should be reported as gross physical reduction, net of transferred use and rebound. Financial value should reconcile with invoices, energy, chemicals, treatment and wastewater where applicable.
19. Adjust for production mix, weather and operating state
Industrial water use changes with throughput, product, batch size, cleaning frequency, temperature, humidity and equipment state. A facility can reduce total water because production fell while intensity worsened. It can increase total water while improving intensity because output rose. Both measures should be visible.
The model should define normalisation variables before outcome assessment. Production measures need consistent units and quality. Weather adjustments should match the affected process, such as cooling demand. Startups, shutdowns, changeovers and maintenance should be treated separately.
Diligence should reproduce adjusted and unadjusted results. It should test sensitivity to the selected model and reference period. Where product mix is complex, a range may be more credible than a single saving. Customer contracts and case studies should use the same definitions as internal valuation evidence.
20. Address water quality and effluent
Quantity optimisation can damage value when quality or effluent consequences are ignored. Lower rinse volume can affect product quality. Higher cycles of concentration can increase scaling or corrosion. Reuse can concentrate contaminants. Reduced discharge can change permit compliance or treatment efficiency.
The data model should include relevant quality parameters, limits, sampling method and laboratory controls. Recommendations should respect equipment, product and permit boundaries. An AI model should not infer compliance from sparse surrogate measurements without validation.
The acquirer should inspect adverse events, customer complaints and corrective actions. It should test whether reported water savings shifted cost to chemicals, energy, maintenance or waste disposal. Verified value is net value across the process, not litres saved in isolation.
21. Evaluate reuse, recycling and substitution
ISO 46001 frames water efficiency around reduce, replace and reuse. Reuse can reduce withdrawals and discharge while requiring treatment, storage, monitoring and capital. The relevant question is whether the application tolerates the available quality with controlled risk.
The platform can add value by matching sources and uses, forecasting quality, optimising treatment and scheduling storage. The buyer should test the engineering basis, validation and actual adoption. A recommendation engine cannot turn an infeasible reuse pathway into an operational saving.
Economics should include capital, energy, chemicals, membranes, residuals, maintenance, downtime and permit implications. Benefits can include supply resilience and capacity release as well as cash. These categories should remain separate so valuation does not count the same benefit twice.
22. Capture the energy-water nexus
Water procurement, pumping, heating, cooling, treatment and discharge consume energy. Energy generation and industrial cooling consume water. An intervention can improve one resource while worsening the other. The target should calculate both physical and financial effects.
Energy savings should use metered consumption or defensible engineering estimates. Emissions effects depend on energy source and time. Treatment intensity can rise when lower-quality sources are used. Desalination, advanced treatment and thermal systems can materially change the cost curve.
The buyer should require an integrated resource ledger for material recommendations. Customer value should include observable energy and water effects, with emissions or resilience scenarios shown separately. This prevents litres, kilowatt-hours and avoided emissions from being converted into duplicate financial value.
23. Map permits, entitlements, tariffs and contracts
Facility water access can depend on abstraction licences, utility contracts, discharge permits, quality limits and curtailment rules. Rights can be site-specific, time-limited or conditional. Tariffs can include fixed charges, blocks, wastewater factors and penalties. A generic cost model can miss these terms.
Diligence should build an obligation register for material customer use cases. The platform should preserve effective dates and jurisdiction. Recommendations that alter abstraction, discharge or reuse may require approval. The vendor should avoid presenting legal conclusions and should support customer review with traceable data.
Commercial value can increase where the system reduces reporting burden or improves compliance evidence. Such value should be measured through labour, error and audit outcomes rather than assumed. Regulatory change can create demand while also increasing product and support cost.
24. Test supply-chain and catchment claims
Many industrial water impacts occur in suppliers or shared catchments. Customer disclosures may therefore combine direct operations with value-chain estimates. The Alliance for Water Stewardship Standard emphasises site and catchment understanding, stakeholder engagement and continual improvement. The target should state which boundary its model covers.
Supplier screening can prioritise engagement but rarely proves operational exposure without supplier data. Commodity location, irrigation method and local governance can be uncertain. The platform should disclose estimation, confidence and update cycle.
The acquirer should test whether customers buy supply-chain insight, operational action or disclosure support. These are distinct products with different renewal drivers. Value should follow documented use, not the theoretical size of a customer's global footprint.
25. Assess stewardship and customer conduct
Water is a shared resource. Facility efficiency can coexist with worsening catchment outcomes if total abstraction grows or impacts shift to other users. Stewardship frameworks therefore consider context, stakeholders, governance, quality and ecosystems as well as internal efficiency.
The platform should help customers distinguish site savings from catchment benefit. Claims such as water positive, replenished or resilient require defined boundaries, methods and evidence. Community or ecological projects should not be netted against operational risk without a transparent framework.
The buyer should inspect marketing, assurance, complaints and corrections. Overstated claims create reputational and contractual exposure. Credible limitations and traceable evidence can strengthen customer trust and renewal.
26. Measure delivery economics
Water-risk AI can appear to be software while depending on site surveys, sensor integration, engineering, data cleaning and customer success. These services can create defensibility and outcomes, but they change margin and scaling. The target should allocate labour and third-party cost by customer and phase.
Implementation, recurring monitoring and bespoke analysis should be separated. Capitalised development and customer-specific work should be reviewed. Gross margin should include cloud, data, support, calibration and field services. Reported annual recurring revenue should exclude non-recurring implementation unless contract structure clearly supports recurring treatment.
The buyer should compare contracted scope with actual effort. A high-renewal customer can still destroy value if engineering hours grow. Integration plans should preserve expertise while standardising repeatable evidence. Delivery leverage is part of the acquired capability and should be measured, not assumed.
27. Test retention, switching and expansion
Retention can arise from validated models, plant integrations, historical baselines, operating workflows and trusted experts. It can also arise from deferred replacement or contractual friction. The buyer should distinguish these sources.
Cohort analysis should cover gross and net retention, price, sites, modules, service effort, collection and churn reasons. Expansion into additional sites can look attractive while concentrating exposure to one corporate customer. Customer-specific models can increase switching cost and maintenance burden simultaneously.
The target should show that customers continue to use outputs and renew after initial efficiency opportunities are captured. Ongoing value may come from monitoring, drift, new processes, risk planning or capital decisions. Revenue persistence should be supported by use and outcomes rather than contract duration alone.
28. Build the valuation bridge
The hypothetical target has 86 customers, USD 17.4 million of annual recurring revenue, 148 sites and 96 billion litres of reported withdrawals. Management proposes USD 12.0 million of annual customer value and USD 7.8 million of buyer revenue and synergy. These figures are illustrative management assumptions only.
Evidence gates retain 49 customers and 72 sites with governed balances, validated models, authorised actions and measured outcomes. The customer-value case falls to USD 5.2 million after baseline, attribution, persistence and delivery adjustments. The buyer revenue-and-synergy case falls to USD 3.4 million after renewal, concentration, integration cost and cash conversion.
The bridge is a decision tool rather than a valuation opinion. It prevents hazard coverage, reported withdrawals and proposed savings from entering value without evidence. The buyer can then apply its selected valuation method, discount rate and transaction structure to the retained cash flows.
Table 2. Hypothetical operational-value ledger
| Proposed value component | Management case | Evidence retained | Principal adjustment |
|---|---|---|---|
| Water and treatment savings | USD 5.0m | USD 2.5m | Baseline, attribution and persistence |
| Energy and chemical savings | USD 2.4m | USD 1.1m | Metering and transferred cost |
| Avoided interruption | USD 3.1m | USD 0.9m | Probability and duration |
| Compliance and labour | USD 1.5m | USD 0.7m | Defined tasks and realised hours |
| Total annual customer value | USD 12.0m | USD 5.2m | Governed evidence gates |
Every number is an illustrative management assumption, not observed company data.
Table 3. Hypothetical buyer revenue and synergy bridge
| Component | Management case | Evidence-adjusted case | Evidence gate |
|---|---|---|---|
| Recurring revenue retained | 4.8 | 2.4 | Use, renewal, concentration and cash |
| Cross-sell | 1.6 | 0.5 | Validated customer need and capacity |
| Delivery synergy | 0.9 | 0.3 | Demonstrated process and timing |
| Data and platform synergy | 0.5 | 0.2 | Transferable rights and integration |
| Total | 7.8 | 3.4 | No duplication with customer value |
Values are illustrative management assumptions in USD millions.
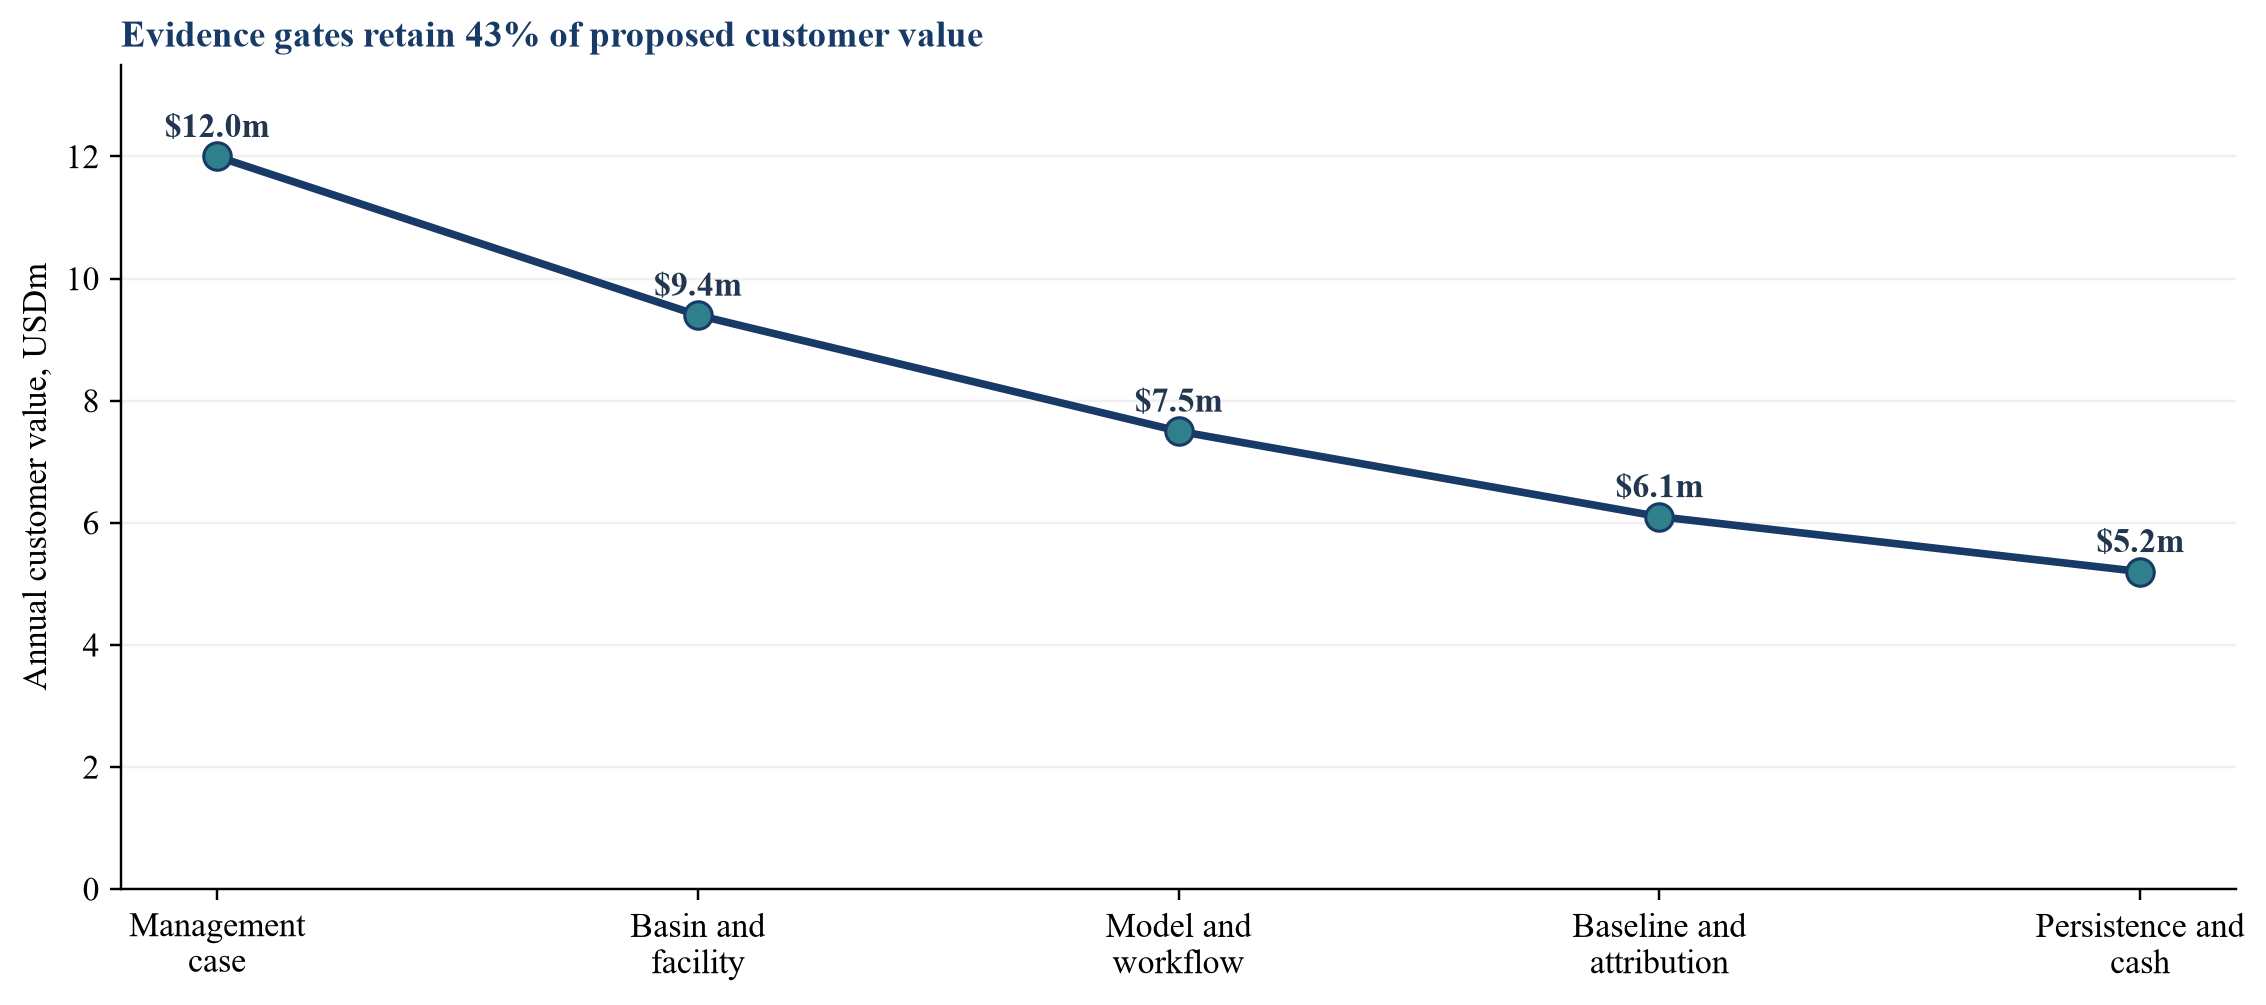
Values in USD millions are illustrative management assumptions.
29. Translate evidence into price and terms
Validated installed capability can support value at signing. Unvalidated sectors, proposed autonomous control and future regulatory acceptance can be funded through milestones. Milestones should reference objective outcomes such as completed validation, active sites, renewal, gross margin or collected cash.
Representations should cover data and model rights, sensor and software licences, documentation, savings claims, customer use, permits, security, intellectual property and disputes. Holdbacks or indemnities can address defined exposures. The buyer should reserve integration capital for metering, data, model, workflow and customer continuity.
Earn-outs need precise definitions. Drought, production cycles and capital approvals sit partly outside management control. Revenue targets should state treatment of implementation, pass-through hardware, customer curtailment, acquisitions and price changes. Governance should provide access to records and a dispute process. Transaction structure should align payment with evidence becoming usable and durable.
30. Execute diligence and the first one hundred days
The diligence request should include model inventory, data register, licences, water balances, sensor records, validation, monitoring, incidents, customer workflows, outcome ledgers, contracts, cohorts, service hours, security and financial models. Sampling should cover high-value customers, water-stressed sites, recent model versions, adverse outcomes and high-touch deployments.
The first thirty days should establish control, freeze production inventories and reconcile customer deployments. Days thirty-one to sixty should reproduce material models, baselines and savings, close priority validation gaps and confirm rights. Days sixty-one to one hundred should harmonise governance, monitoring, customer evidence, delivery controls and board reporting.
Management should report governed sites, validation findings, drift, overrides, completed actions, verified savings, recurring revenue, service effort, concentration and collected cash separately. Unsupported outcome claims should be removed from forecasts. Integration should preserve model versions and measurement evidence before technical consolidation.
Table 4. Diligence gates and first-one-hundred-day ownership
| Workstream | Pre-close evidence | Day-one control | Day-one-hundred outcome |
|---|---|---|---|
| Model | Inventory and validation | Version freeze and owner | Governed model estate |
| Data | Rights, balances and sensor quality | Access and supplier continuity | Reconciled production inputs |
| Workflow | Actions, overrides and outcomes | Authority and audit logging | Reproduced customer value |
| Water context | Sources, permits and basin evidence | Obligation register | Controlled decision boundaries |
| Commercial | Cohorts, effort and cash | Renewal and concentration watch | Validated integration economics |
Evidence owners should be named before close and accountable through integration.
31. Set board and integration controls
Board reporting should distinguish technical performance, operational outcomes and commercial economics. Technical reporting can cover data quality, calibration, drift, validation issues and incidents. Workflow reporting can cover alerts, reviews, overrides, actions and verified savings. Commercial reporting can cover renewal, concentration, margin, service effort and cash.
One composite water-value score can hide the source of risk. Separate measures should reconcile through the customer, site and model inventory. Directors should see which models affect consequential decisions, which limitations are accepted and which remediation constrains growth. Product expansion should require evidence proportionate to use.
Integration should sequence identity, data rights, model versions, site configuration, customer workflows and outcome records. Parallel runs may be required for material processes. Synergy should begin after validated migration. This sequencing preserves customer confidence and the ability to explain decisions before and after closing.
32. Recognise limitations and conclude
This framework does not validate a particular water model, industrial facility, technology or transaction. Applicable water, environmental, safety, data, accounting and regulatory requirements vary by jurisdiction and use. Current professional advice, engineering assessment and independent diligence are required.
The hypothetical case does not estimate market demand, water savings or transaction value. Water outcomes are affected by climate, infrastructure, production, maintenance, quality, regulation and human action. A favourable historical result does not establish future performance. Public basin data can support screening while carrying purpose, scale and update limitations.
The practical conclusion is that water-risk AI becomes transaction value through a governed chain. The model must be fit for the decision, grounded in facility data, validated against relevant operations, used with clear authority and connected to a measured outcome for which customers continue to pay. Buyers should price the evidence state they can reproduce and stage uncertain expansion.
Industrial water analytics can create material operational and social value. They can direct maintenance, improve efficiency, support reuse and strengthen resilience. Their limitations must remain visible. The strongest acquisition case connects basin context, measurement, prediction, action, outcome and cash without converting a risk score into an observed saving.
References
- World Resources Institute. Aqueduct Water Risk Atlas. https://www.wri.org/data/aqueduct-water-risk-atlas
- World Resources Institute. Aqueduct 4.0 Current and Future Water Risks Country Rankings, August 2023. https://www.wri.org/data/aqueduct-40-country-rankings
- World Resources Institute. Water Risk Indicators. https://www.wri.org/aqueduct/help-center/water-risk-indicators
- World Resources Institute. How to Use the Analysis Features in the Water Risk Atlas. https://www.wri.org/aqueduct/help-center/how-use-analysis-features-water-risk-atlas
- World Resources Institute. Aqueduct Frequently Asked Questions. https://www.wri.org/aqueduct/faq
- International Organization for Standardization. ISO 46001:2019 Water Efficiency Management Systems. https://www.iso.org/standard/68286.html
- International Organization for Standardization. ISO 14046:2014 Environmental Management, Water Footprint. https://www.iso.org/standard/43263.html
- Alliance for Water Stewardship. The AWS Standard 2.0. https://a4ws.org/the-aws-standard-2-0/
- U.S. Department of Energy Better Plants. Water. https://betterbuildingssolutioncenter.energy.gov/better-plants/water
- U.S. Department of Energy Better Plants. Industrial Water Savings Network. https://betterbuildingssolutioncenter.energy.gov/better-plants/industrial-water-savings-network
- U.S. Department of Energy. Plant Water Profiler Tool. https://betterbuildingssolutioncenter.energy.gov/better-plants/software-tools
- Global Reporting Initiative. GRI 303: Water and Effluents 2018. https://www.globalreporting.org/standards/media/1909/gri-303-water-and-effluents-2018.pdf
- Taskforce on Nature-related Financial Disclosures. Recommendations of the TNFD, September 2023. https://tnfd.global/recommendations-of-the-tnfd/
- United Nations. Sustainable Development Goal 6: Clean Water and Sanitation. https://sdgs.un.org/goals/goal6
- UN-Water. Progress on Change in Water-Use Efficiency, 2024 Update. https://www.unwater.org/publications/progress-change-water-use-efficiency-2024-update
- U.S. Geological Survey. National Water Information System. https://waterdata.usgs.gov/nwis
- National Oceanic and Atmospheric Administration. National Integrated Drought Information System. https://www.drought.gov/
- National Institute of Standards and Technology. Artificial Intelligence Risk Management Framework. https://www.nist.gov/itl/ai-risk-management-framework
- National Institute of Standards and Technology. AI RMF Playbook. https://www.nist.gov/itl/ai-risk-management-framework/nist-ai-rmf-playbook
- IFRS Foundation. IFRS 3 Business Combinations. https://www.ifrs.org/issued-standards/list-of-standards/ifrs-3-business-combinations/
- IFRS Foundation. IFRS 13 Fair Value Measurement. https://www.ifrs.org/issued-standards/list-of-standards/ifrs-13-fair-value-measurement/
- IFRS Foundation. IFRS 15 Revenue from Contracts with Customers. https://www.ifrs.org/issued-standards/list-of-standards/ifrs-15-revenue-from-contracts-with-customers/
- IFRS Foundation. IAS 38 Intangible Assets. https://www.ifrs.org/issued-standards/list-of-standards/ias-38-intangible-assets/
About the Author
Chennakeshav (CK) is a corporate finance and investment banking executive with 25+ years of global experience in deal origination, structuring and execution across M&A, growth capital and corporate strategy. He has led value-creation mandates for founders, corporates and funds — bridging the boardroom view to hands-on execution and close.
His career spans Morgan Stanley, HSBC, Lloyds Banking Group, EWEC, ADQ portfolio companies and Emirates Growth Fund, across TMT, real estate, fintech, deeptech, cleantech, infrastructure and energy. He has partnered with C-suite leaders, private equity and venture funds, sovereign wealth funds and family offices to finance complex fund raises and scale-up ventures, and has led M&A due diligence, post-merger integration and business-transformation initiatives to create value.
At Matchpoint Partners he is Managing Partner, leading the firm's corporate finance, M&A and capital-raising practice. He holds an MBA from London Business School, an engineering degree from VTU and a Master of Laws (LLM, in progress) from UCL London.
An active start-up mentor, CK mentors at Techstars, DIFC FinTech Hive, Startup Grind, Founder Institute and IN5, serves as Entrepreneur Mentor in Residence (EMiR) at London Business School, and judges the Entrepreneurship World Cup.
https://www.linkedin.com/in/ckadya/
https://www.matchpoint-partners.com/team/ck-adya.html
This paper is part of a continuing series on the structure of private and alternative markets. The views expressed are the author's own. The paper is for information only, describes market structure in general terms, and does not constitute investment, legal, tax or regulatory advice or a recommendation in respect of any security, vehicle or counterparty.
