

Introduction
A lease or guaranteed-future-value contract converts a forecast of tomorrow's used-car price into today's monthly payment. If the forecast is too low, the product becomes expensive and demand weakens. If it is too high, the lender or lessor can suffer a loss when the vehicle is returned. Electric vehicles make this familiar problem harder because technology, new-car pricing, policy and buyer confidence can change materially during a three- or four-year contract.
The used-EV market is becoming large enough to influence new-EV finance. The International Energy Agency reported that used electric-car sales across China, five major European markets and the United States exceeded three million in 2025, about 35% more than in 2024.[1] In the five European markets assessed by the IEA, battery-electric value retention fell from about 50% in 2022 to 35% in 2025, while overall market retention fell from around 60% to 50%.[1] The IEA also described sharp US repricing after new-car price cuts and estimated a large gap between BEV and wider-market retention in 2025.[1]
These averages are useful signals and weak underwriting substitutes. Model, age, mileage, trim, battery chemistry, warranty, condition, geography and sale channel create wide dispersion. A portfolio can perform differently from a published market average. The finance decision therefore needs vehicle-level data, model-level curves and portfolio-level controls.
This paper provides that framework. It addresses product pricing, collateral valuation, battery evidence, portfolio concentration, remarketing and capital protection. It uses current authoritative evidence and clearly identified hypothetical scenarios.
1. Define residual-value risk
Residual value is the expected market value at a future date after age, mileage and condition are specified. The exposure can sit with a lessor, a lender through a guaranteed future value, a manufacturer through a buyback, a fleet owner or a risk-sharing counterparty.
The FCA describes a personal contract purchase structure as one in which a vehicle's end-of-contract value is assessed at inception and deferred, reducing monthly payments. The customer may pay the balloon, refinance, exchange the vehicle or return it subject to the agreement.[2] For a lease, the asset owner generally retains direct disposal exposure.
Residual-value risk is distinct from borrower default. A customer can make every payment and return a vehicle worth less than the booked residual. A defaulted account can also create early-sale exposure before the planned remarketing date. Credit models should therefore separate probability of default, loss from unpaid receivables, collateral value and end-of-term disposal risk.
2. State the underwriting question
The investment or credit committee should ask a precise question: what residual value can be supported for a named model, trim, contract term, mileage, condition, geography and disposal channel, and what loss can the institution absorb if the market reprices?
The answer should produce more than one number. It should include a central estimate, downside values, confidence band, evidence date and monitoring triggers. It should identify which party owns the risk and which contract, reserve or guarantee mitigates it.
The committee should also define the product objective. A high residual reduces monthly payment and can accelerate origination. A conservative residual protects asset economics and can make the product uncompetitive. The chosen value is therefore a commercial and risk decision with governance implications.
3. Map the price system
Used-EV value is produced by a system. New-car transaction prices anchor buyer comparisons. Model launches and battery-cost reductions affect perceived obsolescence. Incentives can change the effective price of a new or used vehicle. Charging access and electricity cost shape operating value. Insurance, repair, parts and warranty affect ownership risk. Fleet returns determine supply.
The vehicle contributes its own evidence: age, mileage, physical condition, accident history, software support, battery state of health, charging history, remaining warranty and capability. Remarketing contributes auction depth, dealer confidence, finance availability, inspection standard and buyer education.
The underwriting model should make these channels explicit. A single depreciation curve can conceal the causal exposure and respond slowly when one driver changes.
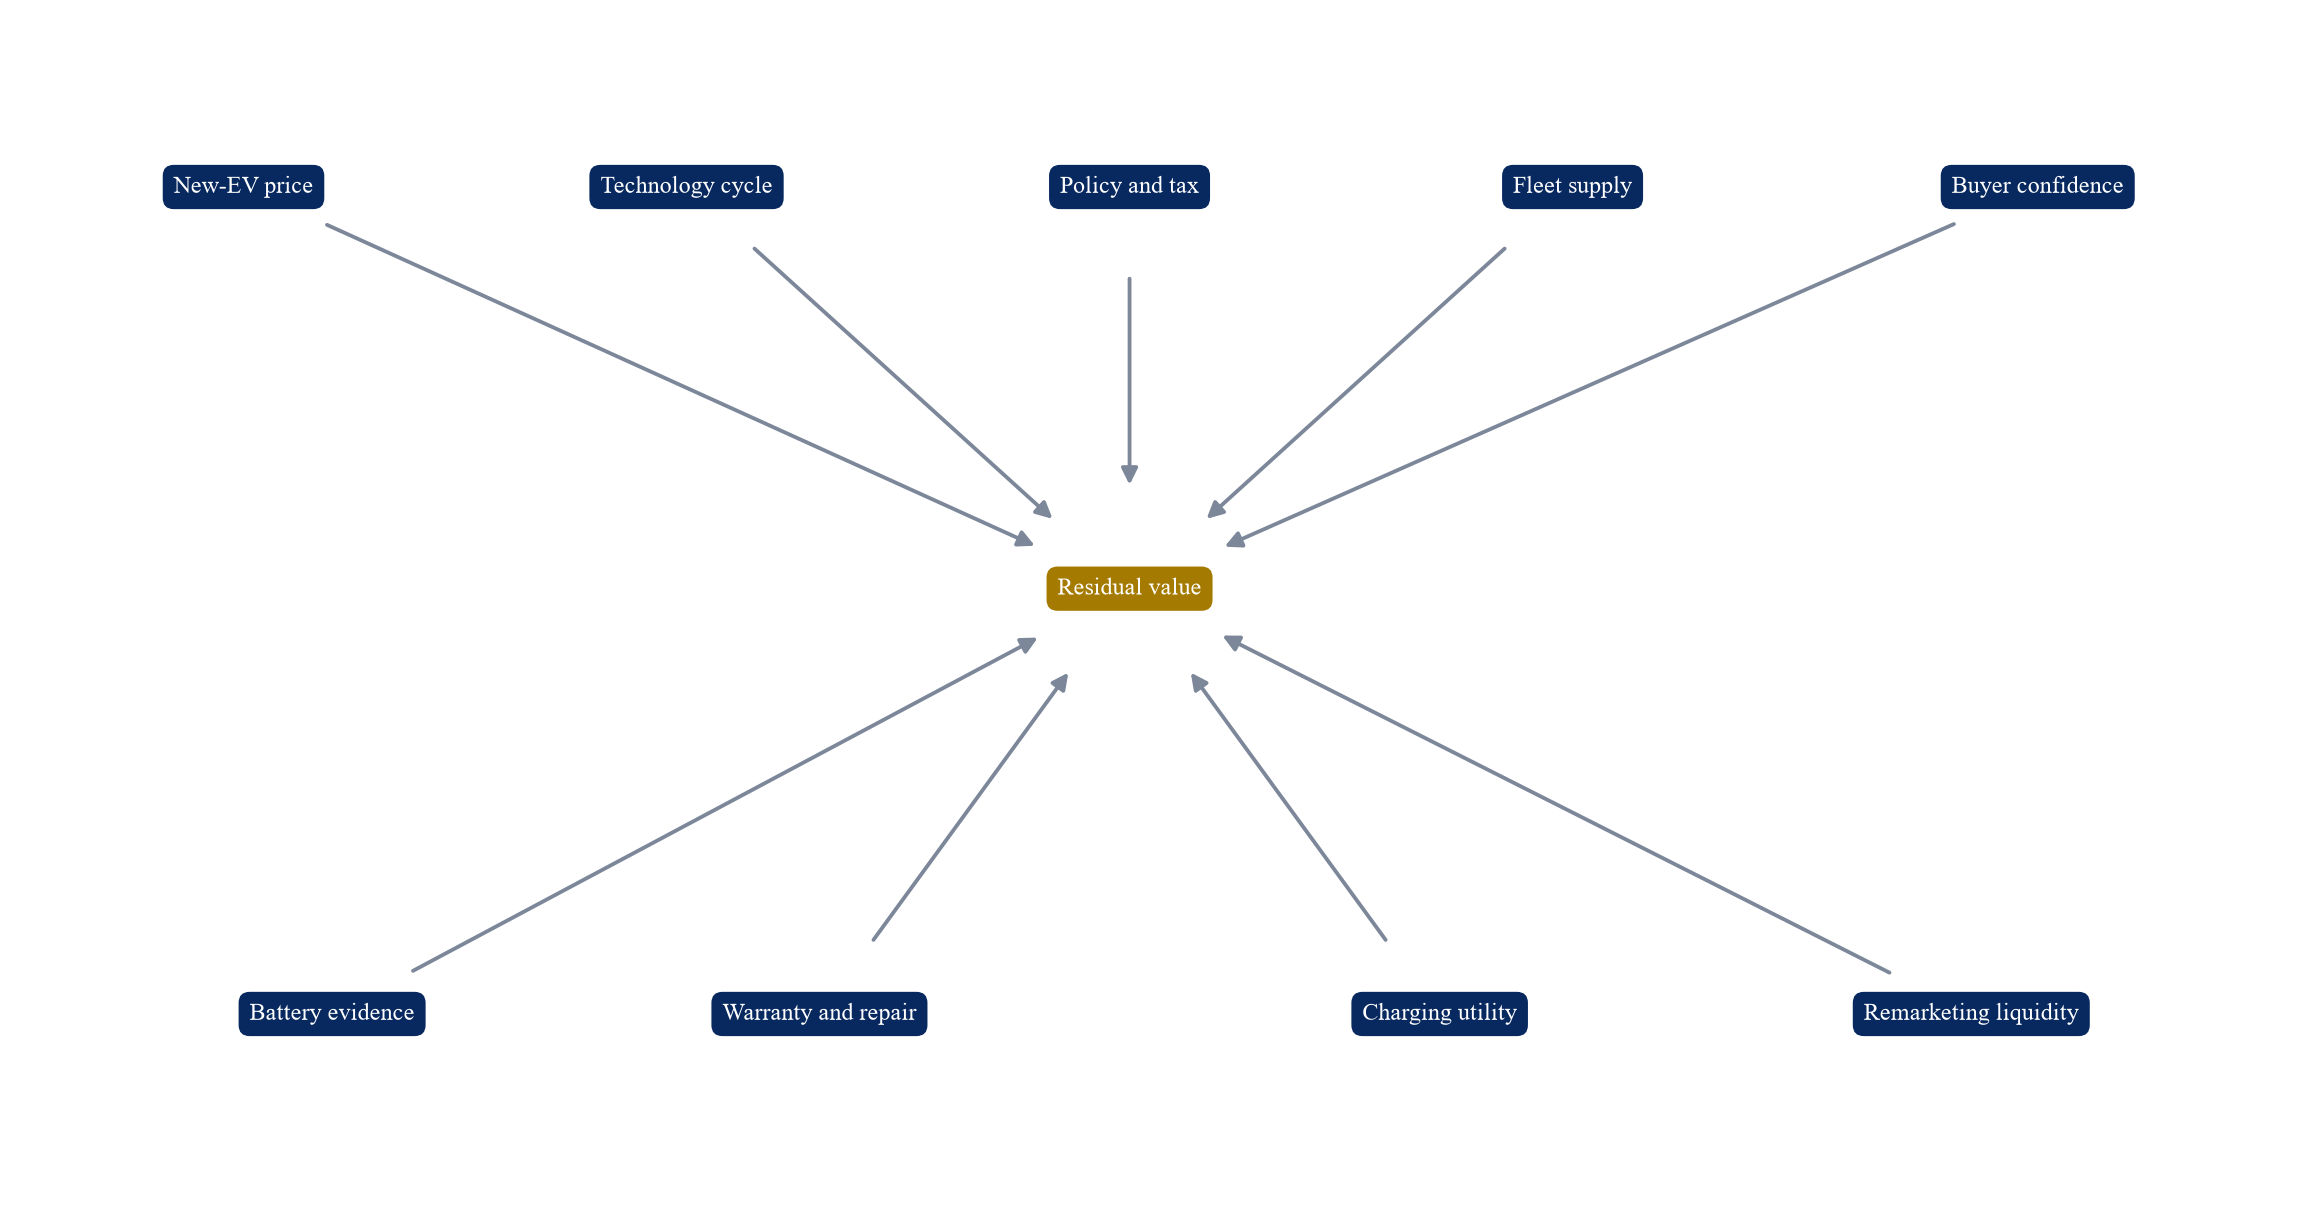
Proposed system map; actual value drivers and contracts depend on model, market and transaction.
4. Separate price from retention
Retention is the used price divided by an original reference price. It can fall because the used vehicle becomes less desirable or because the relevant new-car price falls. Original list price can also differ materially from the transaction price after discount, incentive, fleet rebate or finance support.
An underwriter should maintain several measures: value against original list price, value against net acquisition cost, market price for a comparable new vehicle and absolute disposal proceeds. Lease economics depend on net acquisition cost and actual proceeds. Market communication often uses list-price retention.
The curve should also distinguish nominal and real value. Inflation can raise nominal used prices while real purchasing power falls. Currency can affect imported replacement vehicles and parts. These effects matter for a multi-country portfolio.
5. Read the used-market signal carefully
Used-car indices aggregate transactions with changing model, age and mileage mix. A fall can reflect true repricing, younger supply, different segments or altered sale channels. A model-level finance decision needs a matched cohort.
The IEA notes that its regional retention series cannot be fully adjusted for average age and uses last-month observations when monthly volumes are incomplete.[1] This limitation is important. The reported decline remains a market warning while leaving portfolio-specific loss unproven.
Internal benchmarking should compare identical or closely matched vehicles and control for age, mileage, trim, condition, location and sale route. It should state sample size and dispersion. Thin data should widen the confidence band rather than invite false precision.
6. Track new-car repricing
New-car discounts can re-anchor the used market immediately. A buyer will compare a three-year-old vehicle with a newly discounted model that includes a full warranty and newer features. Manufacturer price action can therefore create mark-to-market losses before the leased vehicle returns.
The IEA describes the US reversal in BEV resale performance after new-EV price cuts in 2023 and continued volatility through 2025.[1] It also reports falling battery prices and expanding model availability, both of which can support lower new-car prices.[3]
The residual-value team should monitor transaction prices rather than list prices alone. It should record direct discounts, deposit contributions, subsidised interest, free charging, tax credits and equipment changes. A trigger should identify when an effective new price approaches the booked used value.
7. Model technology cycles
Range, charging speed, efficiency, thermal management, software and driver-assistance capability can improve between model generations. The effect on used values depends on whether the improvement changes practical utility or only specification.
The underwriter should map announced replacement models, platform changes, battery chemistry, charging connector and software-support horizon. A model approaching replacement may need a steeper curve or shorter contract. A mature platform with stable support may warrant less volatility.
Technology risk is asymmetric. A major improvement can reduce older-model value. A slower innovation cycle may support value without creating equivalent upside because age and mileage still accumulate.
8. Treat battery health as evidence
Battery state of health is commonly expressed as current usable capacity relative to a reference. It is not a complete valuation. Measurement method, temperature, calibration, software and battery-management-system estimation can affect the result.
An inspection process should identify the diagnostic source, test conditions, pack temperature, state of charge, fault codes, cell imbalance, rapid-charging history where accessible, and warranty threshold. A repeatable certified test can reduce uncertainty for dealers and consumers.
The valuation model should use battery health with age, mileage, range test and warranty. A healthy battery cannot offset an unpopular model, high insurance cost or weak charging standard. Poor or uncertain evidence can widen the discount even when the physical battery remains serviceable.
9. Prepare for the battery passport
Regulation (EU) 2023/1542 requires an electronic battery passport from 18 February 2027 for electric-vehicle batteries and specified other batteries placed on the EU market.[4] The European Commission states that relevant battery passports become mandatory on that date and describes implementation work for the digital product-passport registry and standards.[5]
The passport is intended to contain information including battery identity, chemistry, carbon footprint and specified performance or durability data. Access rights differ by data category. Commission guidance also addresses dynamic data and state-of-health information.[5][6]
Lenders and lessors should map how passport data will enter underwriting, servicing and remarketing. They should avoid assuming that the passport automatically provides a sale-ready valuation. Data quality, access, update frequency and interpretation still require controls.
10. Verify warranty transfer
Battery warranties can reduce buyer concern when they transfer to subsequent owners and remain enforceable. Coverage varies by time, mileage, capacity threshold, exclusions, maintenance and geography.
The data room should include warranty terms, start date, remaining period, claim history and transfer requirements. An imported or relocated vehicle may have different coverage. Commercial-use or charging exclusions should be checked.
A valuation uplift should reflect expected economic protection, not the headline warranty duration. The model should consider deductibles, diagnostic thresholds, repair time, replacement availability and whether the remedy is repair, refurbished pack or cash.
11. Assess repairability
Accident damage can affect a battery enclosure, high-voltage system, sensors and structural components. Even modest damage can become expensive if modules, pack components or calibration cannot be repaired independently.
Repair economics require parts availability, technician capability, diagnostic access, manufacturer procedures and insurer acceptance. A model with limited repair network can face higher insurance premiums and dealer discounts.
The underwriter should include repairability in model approval. Data can include parts lead times, common claims, total-loss frequency, repair-cost distribution and independent network coverage. The factor should be refreshed as service capability develops.
12. Measure charging utility
Used buyers value dependable charging at home, work and on journeys. Charging speed, connector compatibility, route coverage and payment access influence practical utility. A vehicle's original range can be less important than its performance within the buyer's use case.
The valuation should record AC and DC charging capability, charging curve, connector, software access and any transferable charging benefit. It should also consider local public and residential charging availability.
Changes in charging standards can create adapters or reduce convenience. The underwriter should avoid assigning permanent obsolescence without evidence and should identify the transition cost and user impact.
13. Include ownership-cost changes
Used buyers compare monthly finance, insurance, tax, energy, maintenance and expected repairs. A low purchase price can be offset by high insurance or restricted charging. A residual model should therefore include a buyer-affordability view.
UK electric vehicles became subject to vehicle excise duty from 1 April 2025. Current guidance states the applicable rates and expensive-car supplement thresholds for relevant vehicles.[7] Tax treatment can change demand at the margin and should be reflected by registration cohort.
Energy-cost advantage varies with home charging, public tariffs, electricity and fuel prices. The IEA provides a total-cost-of-ownership tool and current international analysis.[8] A lender should use local evidence and avoid assuming a universal saving.
14. Segment the portfolio
Portfolio analysis should segment by manufacturer, platform, model, trim, battery size, chemistry, acquisition month, contract term, mileage, customer type, geography and sale channel. Aggregation can conceal a concentration in one technology or pricing decision.
Fleet and salary-sacrifice programmes can return large cohorts at similar ages. This creates vintage concentration and potential auction pressure. Staggered terms and disposal routes can reduce the peak.
The committee should set concentration limits where a common driver could cause correlated loss. Examples include one manufacturer, a model due for replacement, an exposed charging standard or a single remarketing channel.
15. Establish the data hierarchy
The strongest data are completed arm's-length transactions for the same model, trim, age, mileage, condition and geography. Auction bids, dealer trade prices and retail listings provide useful but different signals. Asking prices are not realised proceeds.
Internal returns show actual preparation cost, days to sale, fees and proceeds. External guides expand coverage. OEM forecasts can contain useful product knowledge and commercial bias. Expert judgement should be documented separately.
The hierarchy should define recency, minimum sample, outlier treatment and source reconciliation. When evidence is thin, the model should lower confidence and increase reserve or reduce residual value.
Table 1. Proposed residual-value evidence hierarchy
| Evidence | Principal use | Control question | Typical limitation |
|---|---|---|---|
| Completed matched transactions | model-level price curve | are age, mileage, trim and condition comparable? | thin samples and changing mix |
| Internal fleet disposals | net proceeds and execution cost | are preparation, fees and timing captured? | institution-specific portfolio |
| Auction bids and trade guides | current wholesale direction | are values realised or indicative? | channel and liquidity effects |
| Retail listings | buyer-facing price and stock | how long has the vehicle remained listed? | asking price differs from proceeds |
| Battery diagnostic | condition and confidence | is method repeatable and independently interpretable? | method and calibration variation |
| Warranty and repair data | loss severity and buyer assurance | does coverage transfer and remain enforceable? | exclusions and regional differences |
| OEM or expert forecast | sparse-data overlay | is judgement documented and challenged? | bias and false precision |
Proposed control framework; evidence availability varies by jurisdiction and model.
16. Build model-specific curves
Residual curves should begin with observed matched transactions and adjust for age, mileage, condition and trim. The model can use regression, cohort curves or another transparent method appropriate to sample size.
Vehicle attributes should enter only when they improve explanation and remain stable. A complex model with little data can fit noise. The committee should require out-of-sample testing, error distribution and performance by segment.
The output should include an expected price and uncertainty range. The booked residual can sit below the expected value by a margin reflecting model risk, sale cost, liquidation time and risk appetite.
17. Separate base depreciation and event risk
Base depreciation reflects normal ageing and mileage. Event risk includes new-car price cuts, incentive changes, model discontinuation, safety recall, charging change, warranty concern and sudden fleet supply.
The model should not force every event into a smooth historical curve. Scenario overlays can capture discrete repricing. The overlay should have an owner, evidence, approval and expiry or review date.
This separation improves governance. Analysts can explain whether a provision arises from observed market movement, expected ageing or a conditional event.
18. Convert residual value into lease economics
Lease pricing begins with acquisition cost, residual value, term, financing cost, fees, operating cost and required return. A higher residual lowers depreciation charged through monthly rentals. It also increases end-of-term exposure.
The economics should use net acquisition cost after fleet discount and manufacturer support. Residual support should be recognised only when legally enforceable, creditworthy and aligned with return conditions.
Preparation, logistics, auction, storage and sales fees should be deducted from gross disposal value. Days to sale create funding cost. Taxes and accounting require jurisdiction-specific treatment.
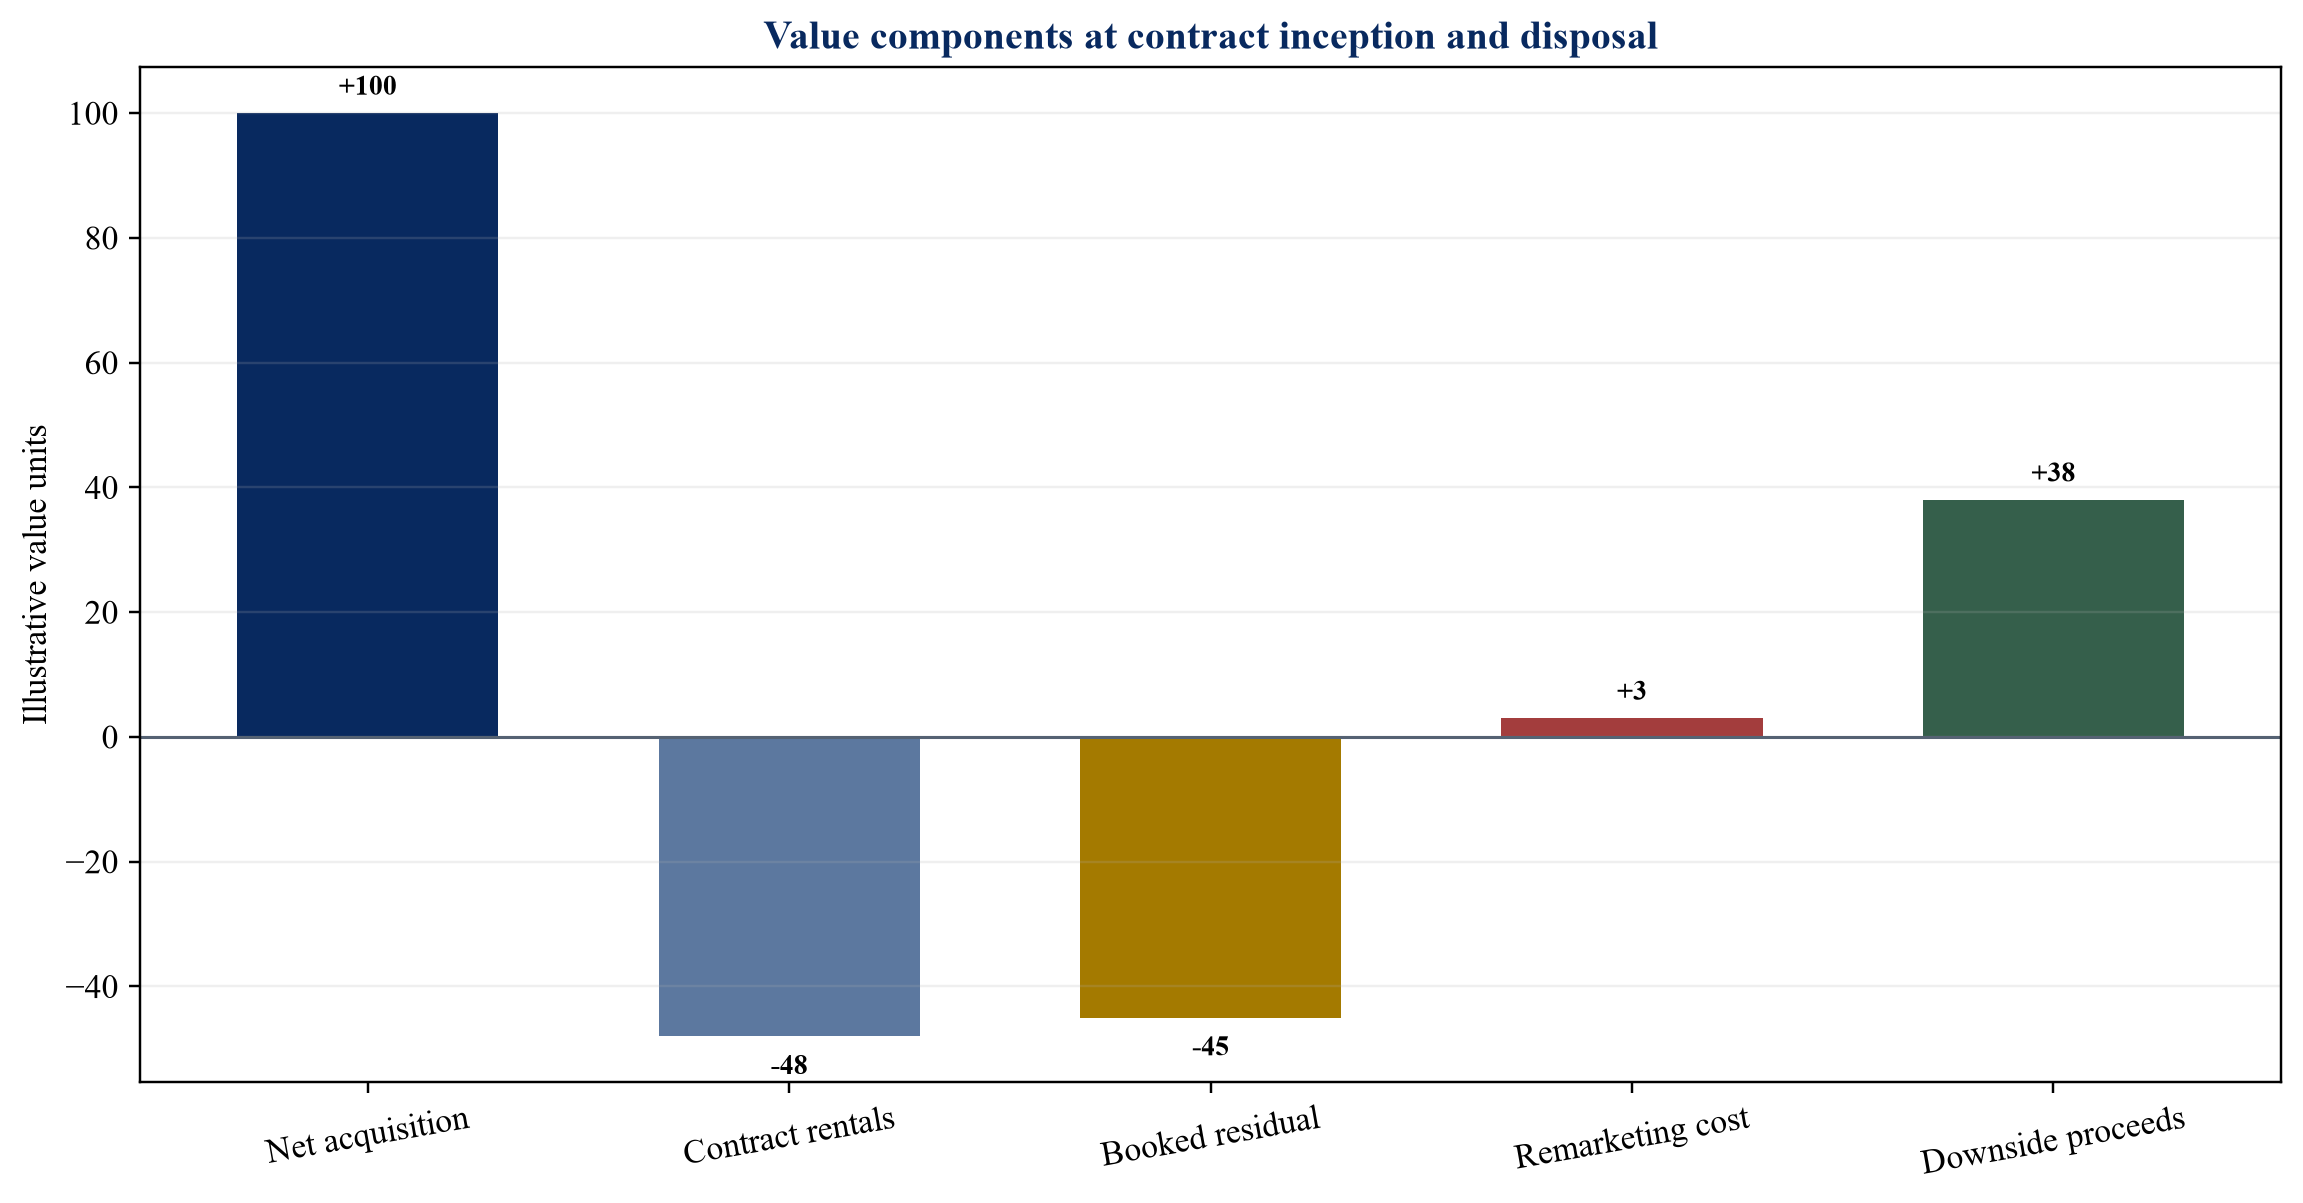
Illustrative values only; no identified vehicle, lessor or transaction is represented.
19. Set contractual mileage and condition
Mileage affects wear, remaining warranty and buyer demand. The contract should specify included mileage, excess charge, inspection method and acceptable condition. Charges should be transparent and consistent with applicable consumer rules.
An excess-mileage charge is not a substitute for accurate residual modelling. It should reflect expected value impact and administration rather than create hidden margin. Condition standards should be communicated before return.
The portfolio should monitor actual mileage during the term where lawful and available. Early identification allows contract amendment, customer communication or residual review.
20. Address customer options
PCP customers may pay the balloon, refinance, exchange or return the vehicle. Behaviour changes with equity. When market value exceeds the balloon, customers may retain or trade the vehicle, limiting lender upside. When market value falls below the balloon, returns can rise, concentrating downside.
This embedded option makes residual risk nonlinear. The model should project return rates as a function of market value, balloon, transaction friction and customer circumstances.
Lease extensions can smooth return waves and preserve income, subject to asset condition, regulation and customer outcome. Extensions should use current valuation and affordability rather than automatically repeat original assumptions.
21. Model remarketing liquidity
Gross guide value is weak protection when a vehicle takes months to sell. Liquidity should be measured through days to sale, bid depth, conversion rate, price dispersion and channel fees.
The project should maintain several channels: direct retail, dealer network, digital auction, physical auction, exporter and manufacturer programme where lawful and appropriate. Each channel has different price, speed, warranty and preparation requirements.
Liquidity stress should increase sale time and reduce proceeds together. A fleet return wave or negative news event can affect both. Storage, insurance and funding cost should continue during the delay.
22. Build the downside cases
The base case should use current matched evidence and approved overlays. Downside cases should apply new-car price cuts, weaker market retention, lower battery confidence, higher repair or insurance cost, longer sale time and concentrated returns.
The scenarios should avoid arbitrary percentages. They can be calibrated to observed historical changes, model transitions and plausible contract events. The paper's numerical exhibit is hypothetical and demonstrates the method only.
Combined downside matters. A new model launch can coincide with fleet returns and weaker consumer finance. The institution should assess total loss, liquidity, capital and product profitability.
Table 2. Hypothetical residual-value and lease-margin sensitivity
| Scenario | Disposal value as share of net acquisition | Return rate | Sale delay | Illustrative portfolio effect |
|---|---|---|---|---|
| Approved base | 45% | 55% | 30 days | target margin maintained |
| New-price reset | 38% | 70% | 45 days | residual loss and higher returned volume |
| Battery-evidence discount | 41% | 62% | 60 days | wider bid spread and inspection cost |
| Fleet-supply wave | 40% | 68% | 75 days | lower auction conversion and funding drag |
| Combined downside | 32% | 82% | 100 days | reserve draw, covenant and capital pressure |
Illustrative values only; results are not forecasts or evidence concerning an identified portfolio.
23. Calculate loss distribution
Portfolio loss is the returned vehicle count multiplied by the difference between booked residual and net proceeds, adjusted for customer or guarantor payments. The distribution depends on correlated values and return behaviour.
A Monte Carlo or scenario approach can model uncertain market price, mileage, condition and return rate. The method should preserve correlation by model and vintage. Independent vehicle shocks understate portfolio tail risk.
The committee should review expected loss, stress loss and extreme but plausible loss. It should also see timing because a large cash shortfall can occur before eventual recoveries.
24. Set reserves and limits
Residual reserves can absorb expected repricing and model uncertainty. Their accounting and prudential treatment depends on the institution and jurisdiction. Management overlays should be documented and reviewed.
Limits can cover manufacturer, model, vintage, contract term, booked retention, evidence confidence and return month. A new model may start with a smaller limit until transaction evidence develops.
Reserve releases should require realised performance and current evidence. Strong recent auctions for a small sample should not automatically reverse a portfolio overlay.
25. Use manufacturer support carefully
Manufacturers can offer buybacks, residual guarantees, subvention or remarketing support. These tools can align origination and asset risk when the obligation is enforceable and the manufacturer can perform.
Diligence should cover calculation, vehicle eligibility, mileage, condition, return procedure, claim timing, netting, cap, termination and credit support. A guarantee with broad exclusions may provide limited downside protection.
Concentration remains. The same manufacturer that faces product or pricing pressure may owe the guarantee. Counterparty stress and asset stress can therefore be correlated.
26. Consider insurance and hedging
Traditional insurance may cover physical damage, theft and specified operational risks. Residual-value insurance or guarantees can transfer defined market exposure, subject to exclusions, premium and counterparty credit.
Financial hedging is difficult because vehicle values are model-specific and markets are incomplete. Portfolio diversification, conservative booking, manufacturer support and active remarketing are often more practical controls.
Any hedge should be valued against basis risk. A broad used-car index can move differently from an EV model or geography. Collateral and liquidity terms can create additional exposure.
27. Monitor the portfolio monthly
The dashboard should show book value, current market estimate, mark-to-market gap, transaction count, forecast error, return rate, mileage, battery evidence, days to sale, preparation cost and net proceeds. It should segment by model and vintage.
Early-warning triggers can include new-price change, incentive introduction, model replacement, warranty issue, recall, insurance movement, auction-bid decline and rising dealer stock. Each trigger should have an owner and response.
The dashboard should compare actual proceeds with the residual set at inception and the most recent forecast. This distinguishes origination error from later market movement and tests the monitoring process.
28. Conduct quarterly residual reviews
A residual-value committee should include risk, finance, treasury, pricing, fleet, remarketing, data and compliance. It should approve curves, overlays, limits and reserves and record dissent.
The committee should receive source data, model performance, market events and scenario results. It should identify conflicts between volume targets and residual conservatism.
Material changes should flow into new business immediately. Existing-book accounting, covenant and capital treatment should follow applicable standards and policy. Customer contract terms should remain protected.
29. Strengthen origination controls
Model approval should require sufficient evidence or an explicit new-model limit. Acquisition price, discount and manufacturer support should be independently verified. Contract term and mileage should match the approved curve.
Pricing systems should use the approved residual version and record overrides. Override authority, rationale and performance should be monitored. Sales incentives should not reward volume without asset performance.
Customer disclosures should clearly explain payments, balloon or return rights, mileage and condition. Product governance should test outcomes under realistic use.
30. Build battery-health operations
Battery evidence should be captured at acquisition where available, during servicing where lawful, before return and before sale. The institution should select diagnostic methods, train inspectors and retain audit data.
The test output should be understandable to dealers and consumers. A certificate should identify vehicle, battery, method, date, conditions and result. It should state limits and avoid implying a warranty.
Disputes require a retest process and independent escalation. Data protection, cybersecurity and manufacturer-access terms should be addressed.
31. Improve return preparation
Preparation decisions should maximise net proceeds rather than cosmetic condition alone. The lessor should compare repair cost, expected price uplift, time and channel requirement.
High-voltage faults, tyres, body damage, software updates, keys and charging cables can affect saleability. A standard inspection and triage process improves forecast and channel selection.
Repairs should follow approved procedures. Battery or structural work requires qualified facilities. The portfolio should measure preparation return by repair category.
32. Choose disposal channels dynamically
Vehicles with strong retail demand and clear battery evidence may justify a certified retail channel. Older, high-mileage or specialist models may suit trade or export, subject to regulation and warranty.
Channel allocation should respond to live bids, stock and sale time. An institution should avoid flooding one auction with a large cohort. Phased release and geographic distribution can improve execution.
Data from each channel should return to the curve model. Net proceeds and time matter more than headline hammer price.
33. Address second life and recycling
Second-life battery use and recycling can create a floor for end-of-life value, but the floor may be low and volatile. The IEA notes that used-battery prices have fallen as new battery and mineral economics changed, while reuse faces safety, warranty, remaining-life and repurposing costs.[3]
A vehicle lender should not assume a large battery salvage value without a binding route, test, logistics and net price. Vehicle resale can remain more valuable than dismantling when the vehicle is serviceable.[3]
End-of-life responsibility, transport, hazardous-goods rules and producer obligations require jurisdiction-specific analysis. Salvage proceeds should be net of safe removal and processing costs.
34. Incorporate securitisation
Auto-finance securitisation can transfer receivable credit risk while leaving residual-value exposure with the originator or lessor, depending on structure. Investors should identify which cash flow and asset risks enter the vehicle.
Pool data should disclose powertrain, model, vintage, term, residual, mileage and concentration where required and commercially appropriate. Stress assumptions should reflect return options and EV-specific market risk.
Representations, reserves, excess spread and triggers can protect investors. They do not create value if the underlying residuals are systematically overstated. Rating and investor diligence should assess the asset model independently.
35. Assess capital and liquidity
Residual losses can reduce profit and capital. Return waves can also require cash for settlement, preparation and inventory before disposal. Treasury should include this timing in liquidity stress.
Funding tenor should cover the contract and realistic remarketing period. Warehouse and securitisation covenants may respond to collateral or performance deterioration. Concentrated repricing can affect advance rates.
The institution should define management actions before stress occurs: reduce new limits, lower booked residuals, obtain support, diversify channels, increase reserves and slow exposed originations.
36. Use an evidence-gated implementation roadmap
Stage one creates the data inventory and portfolio segmentation. Stage two builds matched curves and governance. Stage three pilots battery diagnostics and channel measurement. Stage four integrates pricing, monitoring and reserves. Stage five introduces passport data and advanced analytics after validation.
Each stage should have evidence, owner, control test and stop rule. Technology should support a defined risk process. A large model cannot compensate for weak transaction data or unclear ownership.
The roadmap should prioritise the models and vintages with the largest booked exposure and nearest returns. This creates measurable loss prevention and learning.
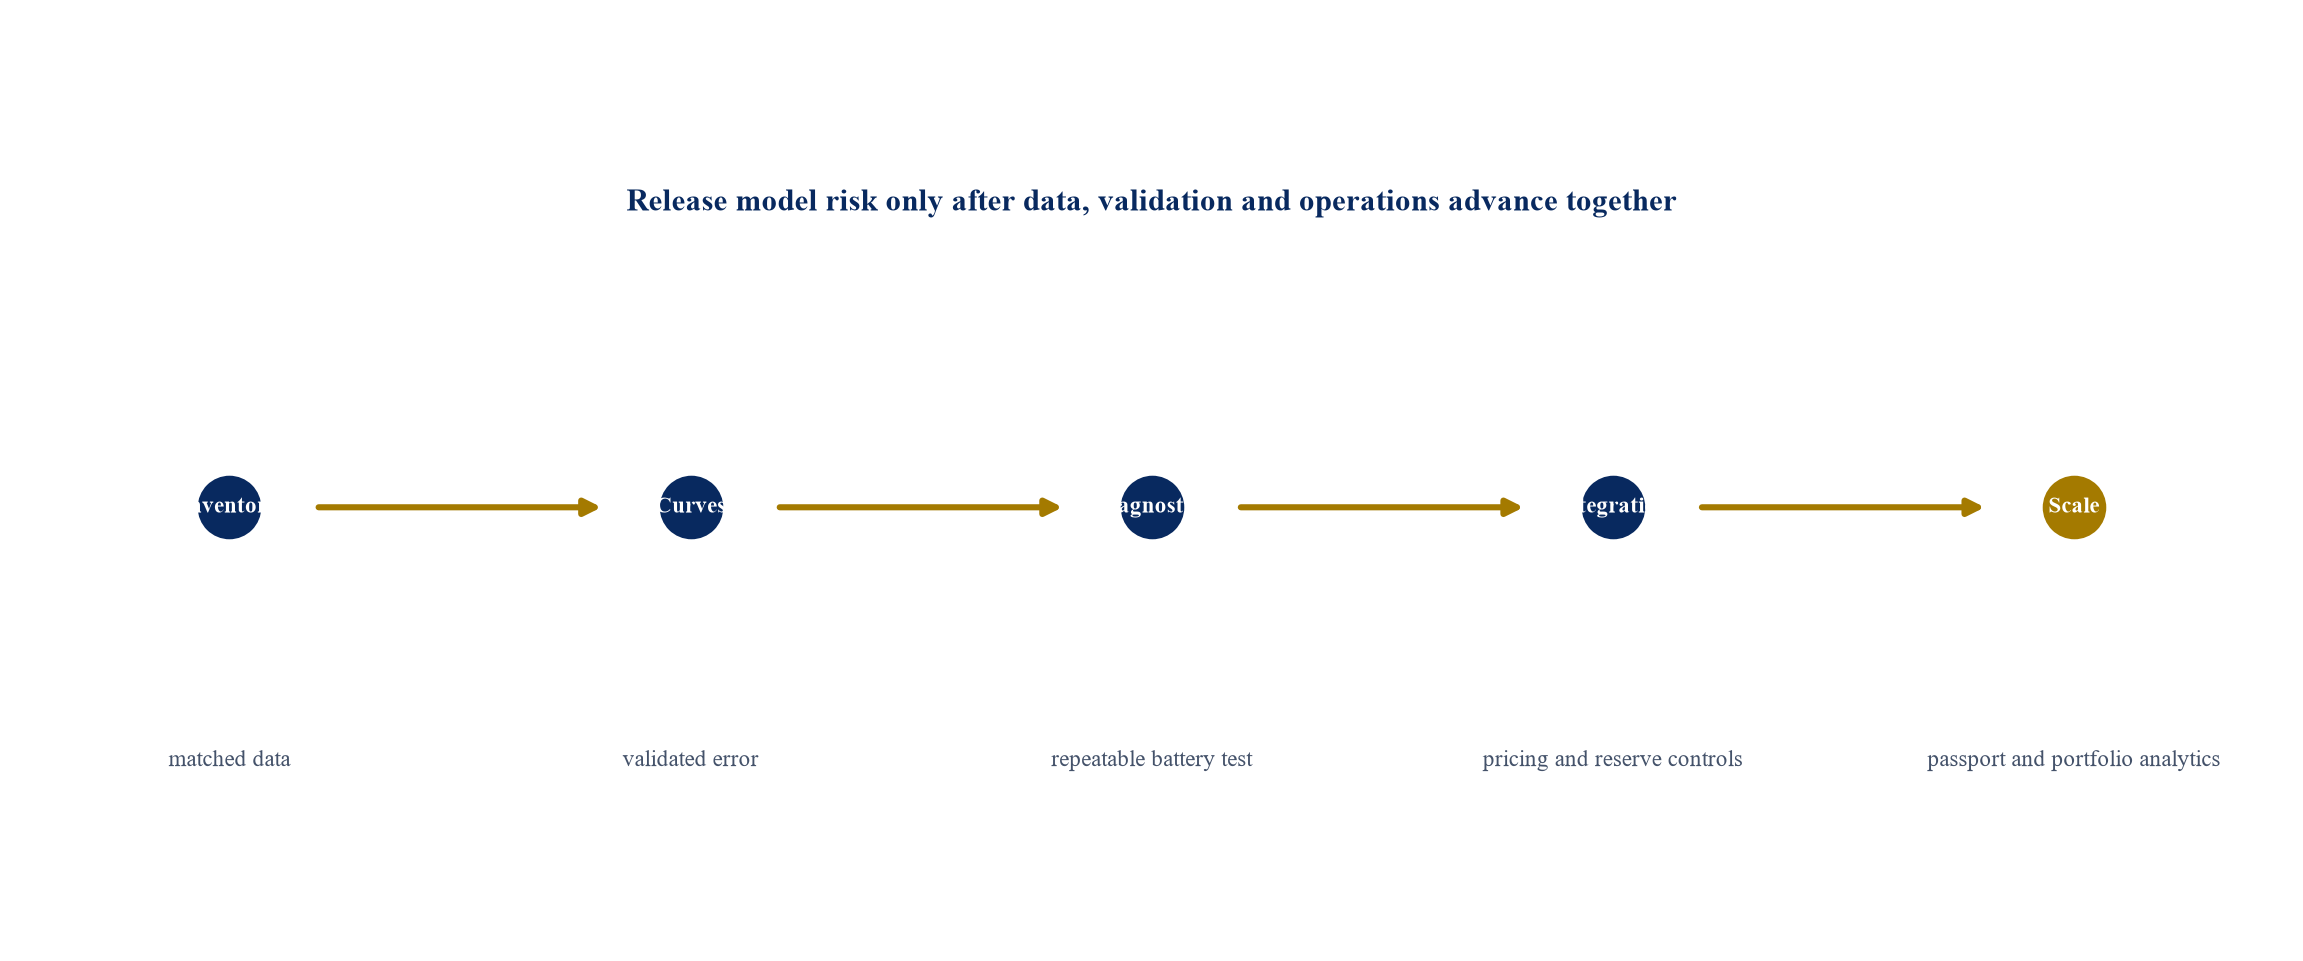
Proposed governance framework; timing depends on portfolio, regulation, data and systems.
37. Apply the investment-committee test
The committee should test seven propositions. Acquisition cost is verified. The residual curve uses matched and current data. Battery, warranty and repair evidence support buyer confidence. New-car pricing and model-cycle risk are captured. Return behaviour and remarketing liquidity are stressed. Concentrations and reserves fit risk appetite. Governance can reprice new business when signals change.
Approval should state model, trim, term, mileage, geography, booked residual, volume limit, reserve, monitoring trigger and review date. A broad EV approval is insufficient.
The decision should also identify the downside bearer. A manufacturer guarantee, customer balloon or insurance policy can alter exposure only within its enforceable terms.
Table 3. Investment-committee residual-value scorecard
| Test | Approval evidence | Downside concern | Gate response |
|---|---|---|---|
| Acquisition basis | verified net price and support | list price overstates capital at risk | underwrite from net cost |
| Market curve | matched transactions and error range | thin or stale sample | lower residual and cap volume |
| Battery evidence | repeatable diagnostic and warranty | uncertain health or access | widen discount and require certificate |
| Product cycle | model roadmap and effective new price | price cut or replacement | event overlay and shorter term |
| Return behaviour | option and return-rate model | downside returned while upside retained | stress nonlinear return rate |
| Remarketing | channel depth and net proceeds | slow sale and fleet-supply wave | diversify channels and fund inventory |
| Portfolio capacity | limits, reserves, capital and liquidity | correlated model and vintage loss | reduce concentration and add reserve |
Proposed framework; conclusions require portfolio-specific data and professional review.
38. Control cross-border exposure
Used EVs can move between countries when one market offers deeper demand or better pricing. Export may support proceeds while introducing currency, transport, homologation, tax, warranty, charging-standard and consumer-protection issues. A vehicle that is attractive in one country may lose utility where connector access, navigation services, language support or manufacturer coverage differs.
The portfolio model should identify which vehicles are economically exportable and which costs reduce the destination price. It should also test whether the disposal route remains lawful under waste, battery, customs and product rules. A vehicle intended for continued use should not be valued as an export if its condition or documentation makes that route uncertain.
Currency should be separated from underlying vehicle value. A favourable exchange rate can raise local proceeds temporarily. Hedging may be appropriate for a committed disposal programme, subject to volume and timing uncertainty. The committee should avoid embedding a speculative currency gain within the approved residual.
Cross-border data can improve the benchmark when specifications and taxes are reconciled. Direct comparison of advertised prices across countries can mislead because registration, incentives, warranty and transaction costs differ. Net proceeds after all transfer costs provide the relevant finance measure.
39. Protect consumer outcomes
Residual-value decisions influence monthly payments, balloon amounts, return choices and charges. Product governance should assess whether the contract remains understandable and supports fair outcomes across plausible market scenarios. A high guaranteed value can lower monthly payments while increasing the final amount required to own the vehicle.
Documentation should explain the balloon or return option, mileage, condition, inspection, fees and consequences of early termination. Communications near maturity should provide enough time for the customer to compare retention, refinance, exchange and return. Valuation uncertainty should not be transferred through unclear charges.
Where a customer has positive equity, the process should explain how it is recognised. Where the market value is below the balloon, the return right should operate according to the contract. Firms should monitor complaints, disputed inspections, vulnerable-customer outcomes and differences between forecast and realised values.
Compliance and risk teams should review automated pricing and decision tools. Data used for personalisation or telemetry must have a lawful purpose, appropriate access and retention. A technically accurate residual model does not remove the need for clear product and conduct controls.
40. Validate the valuation model
Independent validation should test data lineage, methodology, segmentation, assumptions, overrides, calibration and stability. It should reproduce the curve from source data and examine whether the selected variables have economic meaning. Validation should also test periods of rapid repricing rather than rely only on stable years.
Back-testing should compare predicted and realised net proceeds at the original horizon. It should decompose error into market movement, mileage, condition, return timing, channel and model misspecification. Mean error can appear acceptable while losses concentrate in a manufacturer or vintage, so distribution and segment results matter.
Challenger methods can test sensitivity to functional form and sparse data. A complex machine-learning model requires explainability, version control, monitoring and override governance. A simpler cohort curve can be more reliable where transaction volume is low.
Validation findings should have severity, owner and remediation date. Material weaknesses should reduce limits or booked residuals until resolved. Model approval should expire or require periodic renewal because the market, technology and data structure change.
41. Build an operational loss loop
Every returned vehicle provides evidence for future underwriting. The institution should connect contract data, inspection, battery diagnostic, preparation, sale channel, bid history, proceeds, fees and sale date using a stable vehicle identifier. Reconciliation should confirm that accounting proceeds match operational records.
Loss reviews should identify which assumption failed and whether the issue is systematic. A low price caused by excessive damage calls for contract and inspection action. A market-wide repricing calls for curve and reserve action. A delayed sale caused by channel congestion calls for remarketing and liquidity action.
The feedback cycle should update new-business pricing quickly while preserving approved governance. A daily market alert can trigger analysis; it should not automatically rewrite every residual. Material changes require evidence, challenge and recorded approval.
Management information should show actions and results. If a battery certificate improves bid depth, preparation cost or days to sale, the effect should be measured. If a guarantee fails to pay because of condition exclusions, future recognition should change. This operating evidence turns residual-value management from an annual forecast into a controlled learning system.
42. Limitations
This paper provides a general decision framework. It does not provide legal, regulatory, consumer-credit, accounting, tax, actuarial, engineering, battery, insurance, investment, valuation or credit advice.
Used-vehicle markets, incentives, battery technology, regulation, prices, repair networks and buyer preferences can change. Published retention series use different samples, definitions, ages and sale channels. They do not prove the value or loss of a specific portfolio.
All numerical tables and charts are hypothetical. They are not forecasts, offers, valuations, provisions, credit opinions or evidence concerning an identified vehicle, lender, lessor, fleet or transaction.
43. Conclusion
The used-EV price is a compound signal. Battery condition matters, but market value can move faster through new-car pricing, technology, warranty, repair, tax, charging and fleet supply. A finance provider that treats the risk as a fixed depreciation curve can discover the error only when a concentrated return vintage reaches auction.
A defensible process begins with net acquisition cost and matched transaction data. It sets model-specific curves, measures uncertainty, obtains battery and warranty evidence, models customer options and stresses remarketing liquidity. Governance then converts live price signals into residual changes, limits and reserves.
The objective is a finance product whose monthly price remains commercially credible and whose downside remains funded. That requires active residual-value management from origination through return and sale.
Appendix A. Investment-committee questions
1. Which model, trim, battery and geography define the approved pool?
2. What is the verified net acquisition cost after support?
3. Which matched transactions support the curve?
4. How large is forecast error and how has it changed?
5. Which new-car discounts and finance incentives affect the benchmark?
6. When will the model or platform be replaced?
7. Which battery-health evidence is available and repeatable?
8. Does battery and vehicle warranty transfer to the next owner?
9. Which repair, insurance and parts constraints affect buyer value?
10. How do tax, charging and energy cost affect local demand?
11. What return rate occurs when market value falls below the balloon?
12. Which model and vintage concentrations can reprice together?
13. How many vehicles return in each month?
14. Which channels provide executable bids and measured net proceeds?
15. How do sale delay and preparation cost affect loss?
16. Which guarantees are enforceable and creditworthy?
17. Which reserves, limits and liquidity cover combined downside?
18. Which triggers change new-business pricing immediately?
19. How will battery-passport data enter underwriting and remarketing?
20. Which evidence releases the next volume limit?
References
- International Energy Agency, Global EV Outlook 2026: Trends in electric cars, 2026. https://www.iea.org/reports/global-ev-outlook-2026/trends-in-electric-cars
- Financial Conduct Authority, Our work on motor finance, accessed 2 October 2026. https://www.fca.org.uk/news/news-stories/our-work-motor-finance
- International Energy Agency, Global EV Outlook 2026: Electric vehicle batteries, 2026. https://www.iea.org/reports/global-ev-outlook-2026/electric-vehicle-batteries
- European Parliament and Council, Regulation (EU) 2023/1542 concerning batteries and waste batteries, 12 July 2023. https://eur-lex.europa.eu/eli/reg/2023/1542/oj
- European Commission, Batteries: Digital Product Passport, accessed 2 October 2026. https://single-market-economy.ec.europa.eu/single-market/digital-product-passport/batteries_en
- European Commission, EU Digital Product Passport FAQ for Batteries, accessed 2 October 2026. https://single-market-economy.ec.europa.eu/single-market/digital-product-passport/eu-digital-product-passport-faq-batteries_en
- UK Government, Vehicle tax for electric, zero and low emission vehicles, accessed 2 October 2026. https://www.gov.uk/guidance/vehicle-tax-for-electric-and-low-emissions-vehicles
- International Energy Agency, Electric Vehicles: Total Cost of Ownership Tool, accessed 2 October 2026. https://www.iea.org/data-and-statistics/data-tools/electric-vehicles-total-cost-of-ownership-tool/
- Financial Conduct Authority, Market impact assessment on cost of capital and investment in the motor finance market, 2025. https://www.fca.org.uk/publication/external-research/market-impact-assessment-motor-finance.pdf
- Financial Conduct Authority, CP25/27 Technical Annex 2: State of Competition in the Motor Finance Market, 2025. https://www.fca.org.uk/publication/consultation/cp25-27-technical-annex-2.pdf
- UK Department for Transport, Zero Emission Vehicle Mandate consultation: final cost benefit analysis, 2023. https://assets.publishing.service.gov.uk/media/6554be55544aea000dfb2d59/zev-mandate-consultation-final-cost-benefit-analysis.pdf
- UK Department for Transport, Zero emission vehicle mandate review, 14 August 2026. https://www.gov.uk/government/consultations/zero-emission-vehicle-mandate-review
- Financial Conduct Authority, Our work on motor finance: final findings, March 2019. https://www.fca.org.uk/publication/multi-firm-reviews/our-work-on-motor-finance-final-findings.pdf
- International Energy Agency, Global EV Outlook 2024: Trends in electric cars, 2024. https://www.iea.org/reports/global-ev-outlook-2024/trends-in-electric-cars
- European Commission, Industrial Action Plan for the European automotive sector, 5 March 2025. https://eur-lex.europa.eu/legal-content/EN/TXT/PDF/?uri=CELEX:52025DC0095
- United Nations Economic Commission for Europe, UN Regulation No. 100: Electric power train requirements, accessed 2 October 2026. https://unece.org/transport/vehicle-regulations-wp29/standards/addenda-1958-agreement-regulations-81-100
- UK Government, Zero emission vehicle mandate consultation: summary of responses and joint government response, 2023. https://www.gov.uk/government/consultations/a-zero-emission-vehicle-zev-mandate-and-co2-emissions-regulation-for-new-cars-and-vans-in-the-uk/outcome/zero-emission-vehicle-zev-mandate-consultation-summary-of-responses-and-joint-government-response
- European Commission, Frequently asked questions on Regulation (EU) 2023/1542 concerning batteries and waste batteries, accessed 2 October 2026. https://environment.ec.europa.eu/topics/waste-and-recycling/batteries_en
- International Transport Forum, Cleaner Vehicles: Achieving a Resilient Technology Transition, OECD, 2021. https://www.itf-oecd.org/cleaner-vehicles
- World Bank, Electric Mobility and Development, accessed 2 October 2026. https://www.worldbank.org/en/topic/transport/brief/e-mobility
About the Author
Authored by Chennakeshav Adya Independent Researcher
Chennakeshav (CK) is a corporate finance and investment banking executive with 25+ years of global experience in deal origination, structuring and execution across M&A, growth capital and corporate strategy. He has led value-creation mandates for founders, corporates and funds — bridging the boardroom view to hands-on execution and close.
His career spans Morgan Stanley, HSBC, Lloyds Banking Group, EWEC, ADQ portfolio companies and Emirates Growth Fund, across TMT, real estate, fintech, deeptech, cleantech, infrastructure and energy. He has partnered with C-suite leaders, private equity and venture funds, sovereign wealth funds and family offices to finance complex fund raises and scale-up ventures, and has led M&A due diligence, post-merger integration and business-transformation initiatives to create value.
At Matchpoint Partners he is Managing Partner, leading the firm's corporate finance, M&A and capital-raising practice. He holds an MBA from London Business School, an engineering degree from VTU and a Master of Laws (LLM, in progress) from UCL London.
An active start-up mentor, CK mentors at Techstars, DIFC FinTech Hive, Startup Grind, Founder Institute and IN5, serves as Entrepreneur Mentor in Residence (EMiR) at London Business School, and judges the Entrepreneurship World Cup.
Matchpoint profile: https://www.matchpoint-partners.com/team/ck-adya.html LinkedIn: https://www.linkedin.com/in/ckadya/
