

1. The investment question hidden inside the waste stream
The phrase “urban mine” is compelling because cities contain large stocks of electronics, batteries, cables, appliances and industrial equipment. Yet an urban mine is unlike an ore body. Its feedstock is dispersed across households, enterprises, data centres, telecommunications networks and public institutions. Product types change quickly. Data-bearing devices require controlled handling. Ownership may be uncertain. The value of a device depends on age, specification, condition and the availability of a secondary buyer. The value of its material fractions depends on recovery yield, commodity prices and downstream processing capability.
The global scale is large. The International Telecommunication Union’s Global E-waste Monitor 2024 reports 62 million tonnes of e-waste generated in 2022 and a documented collection and recycling rate of 22.3 per cent. It projects 82 million tonnes by 2030 under prevailing trends. The report also identifies billions of dollars of natural-resource value that is not captured through documented channels. Those figures describe a global system challenge; they do not establish the addressable revenue or cash flow of any individual operator.
An investable platform needs control over four conversion points. First, it must originate usable feedstock at an acceptable acquisition cost. Second, it must route each item toward the highest risk-adjusted recovery pathway. Third, it must monetise outputs through credible buyers. Fourth, it must carry environmental, worker-safety, data-security and cross-border obligations without creating contingent liabilities that exceed the operating margin.
The valuation problem is therefore a routing problem. The same laptop can be worth more as a functioning product than as parts, and more as parts than as shredded fractions. A damaged server may have little resale value but high information-security sensitivity. A mixed municipal stream may contain meaningful metal content but impose high sorting and contamination costs. The platform’s edge lies in deciding quickly, documenting custody and executing the chosen route.
2. Market context: volume growth does not guarantee value capture
Electronic equipment becomes waste because of failure, obsolescence, fleet refresh, business closure, data-centre upgrade, consumer preference or regulatory change. These triggers create different feedstock pools. Enterprise refresh cycles can produce batches of similar assets with known specifications and auditable provenance. Household collections are more fragmented and less predictable. Industrial and telecommunications equipment can be heavy, specialised and expensive to dismantle. Data-centre decommissioning can combine valuable servers and network equipment with strict requirements for media sanitisation and chain of custody.
The platform’s commercial strategy should begin with feedstock segmentation rather than a generic market-share assumption. A tonne of enterprise laptops is economically different from a tonne of mixed small appliances. A valuation model that converts every tonne into a single revenue figure hides route mix, recovery quality and liability.
Policy expands the formal market. The European Union’s Critical Raw Materials Act establishes a 2030 benchmark for recycling capacity equal to at least 25 per cent of the Union’s annual consumption of strategic raw materials. It also directs attention to collection, sorting and processing of waste streams with critical-raw-material recovery potential. The Waste Electrical and Electronic Equipment framework places responsibilities on producers and supports collection and treatment systems. These measures can improve feedstock visibility and demand for compliant capacity. They can also add reporting, traceability and processing requirements.
Cross-border rules matter because recovery chains are international. Amendments under the Basel Convention that took effect on 1 January 2025 expanded controls so that transboundary movements of electrical and electronic waste are subject to prior informed consent, including hazardous e-waste and other covered e-waste categories. Operators that rely on exporting mixed loads must incorporate consent timelines, classification risk, documentation and rejection exposure into working capital and route design.
3. The five economic engines
3.1 Feedstock origination
Feedstock origination includes customer acquisition, collection contracts, take-back schemes, logistics coordination, asset inventory and initial grading. Its revenue model can include collection fees, service retainers, revenue shares, negative purchase prices or direct purchase of used equipment. The key distinction is whether the platform is paid to receive equipment or pays to acquire it.
Contract quality is more valuable than nominal volume. A multi-year enterprise programme with minimum volumes, defined service levels and transparent revenue sharing can support capacity planning. A municipal concession may provide scale but include broad acceptance obligations and low-quality material. Spot purchases can be attractive when resale prices are strong but expose the platform to adverse selection.
The origination engine should be measured through contracted tonnes, collections per route kilometre, acquisition cost per usable unit, asset-list accuracy, renewal rate and customer concentration. A high contracted share reduces volume volatility only if the contract defines enforceable volumes and acceptable material.
3.2 Secure IT asset disposition
IT asset disposition combines inventory control, transport security, data sanitisation, destruction where necessary, audit certificates and downstream disposition. For enterprise customers, risk reduction can be as important as residual value. NIST Special Publication 800-88 Revision 2 defines media sanitisation as a process that makes access to target data infeasible for a given level of effort and provides a framework for selecting controls according to information sensitivity.
Secure disposition can earn service fees and customer-retention value. It also creates liability. A lost device, incomplete inventory, false destruction certificate or weak downstream vendor can create losses far beyond the transaction margin. Diligence should test process design, evidence retention, personnel controls, insurance, subcontracting and incident history.
This engine often merits a service-business valuation approach when revenue is recurring, customer relationships are durable and the platform’s audit trail is credible. Applying a service multiple to the whole enterprise is inappropriate if most earnings arise from volatile equipment resale or commodity recovery.
3.3 Refurbishment and resale
Refurbishment preserves the embodied value of a working product. It may involve diagnostics, cleaning, component replacement, software preparation, warranty provision, channel management and returns handling. The resale engine can generate strong gross margins on suitable devices, while absorbing working capital and obsolescence risk.
The operating model depends on speed. Residual values often fall as newer product generations enter the market. Days from collection to listing, sell-through time, return rate, average selling price by grade and warranty cost are essential metrics. Revenue recognition should distinguish gross principal sales from agency commissions. Inventory provisioning should reflect model-specific ageing rather than a single portfolio percentage.
Reuse has priority in many circular-economy hierarchies because it extends product life. The US Environmental Protection Agency describes collection, reuse, refurbishment and recycling as distinct stages and notes that reusable electronics can be refurbished and resold before material recycling. For investors, the commercial implication is clear: a platform needs disciplined triage so that material processing does not destroy recoverable product value.
3.4 Component harvesting
Some devices cannot be resold intact but contain usable screens, memory, processors, drives, power supplies, circuit boards and mechanical assemblies. Component harvesting sits between refurbishment and materials recovery. It requires technical knowledge, testing, cataloguing and access to repair or secondary-component channels.
This engine can improve recovery value from damaged equipment and support the platform’s own refurbishment operations. It can also create slow-moving inventory. The correct metric is realised component contribution after testing, storage, returns and write-offs. A warehouse full of catalogued parts is not evidence of value unless there is repeat demand and a credible liquidation route.
3.5 Materials recovery
Materials recovery includes manual dismantling, shredding, physical separation, smelting, hydrometallurgy and specialised refining. Few platforms perform every stage. Many aggregate and pre-process material before selling fractions to qualified downstream refiners.
The economics depend on composition, recovery yield, payable metal terms, treatment charges, freight, sampling and settlement. Commodity exposure can arise between feedstock purchase and final settlement. Revenue can be reported gross or net depending on contractual control and accounting treatment, so diligence must reconcile operational mass balance to invoices and cash.
Capital intensity increases as the platform moves into specialised processing. Vertical integration may capture margin and improve traceability. It may also add technology risk, environmental permitting, hazardous-material handling and utilisation pressure. A credible investment case compares the incremental margin with the full cost of capital, ramp-up losses and contingency.
4. System map: where value is created and lost
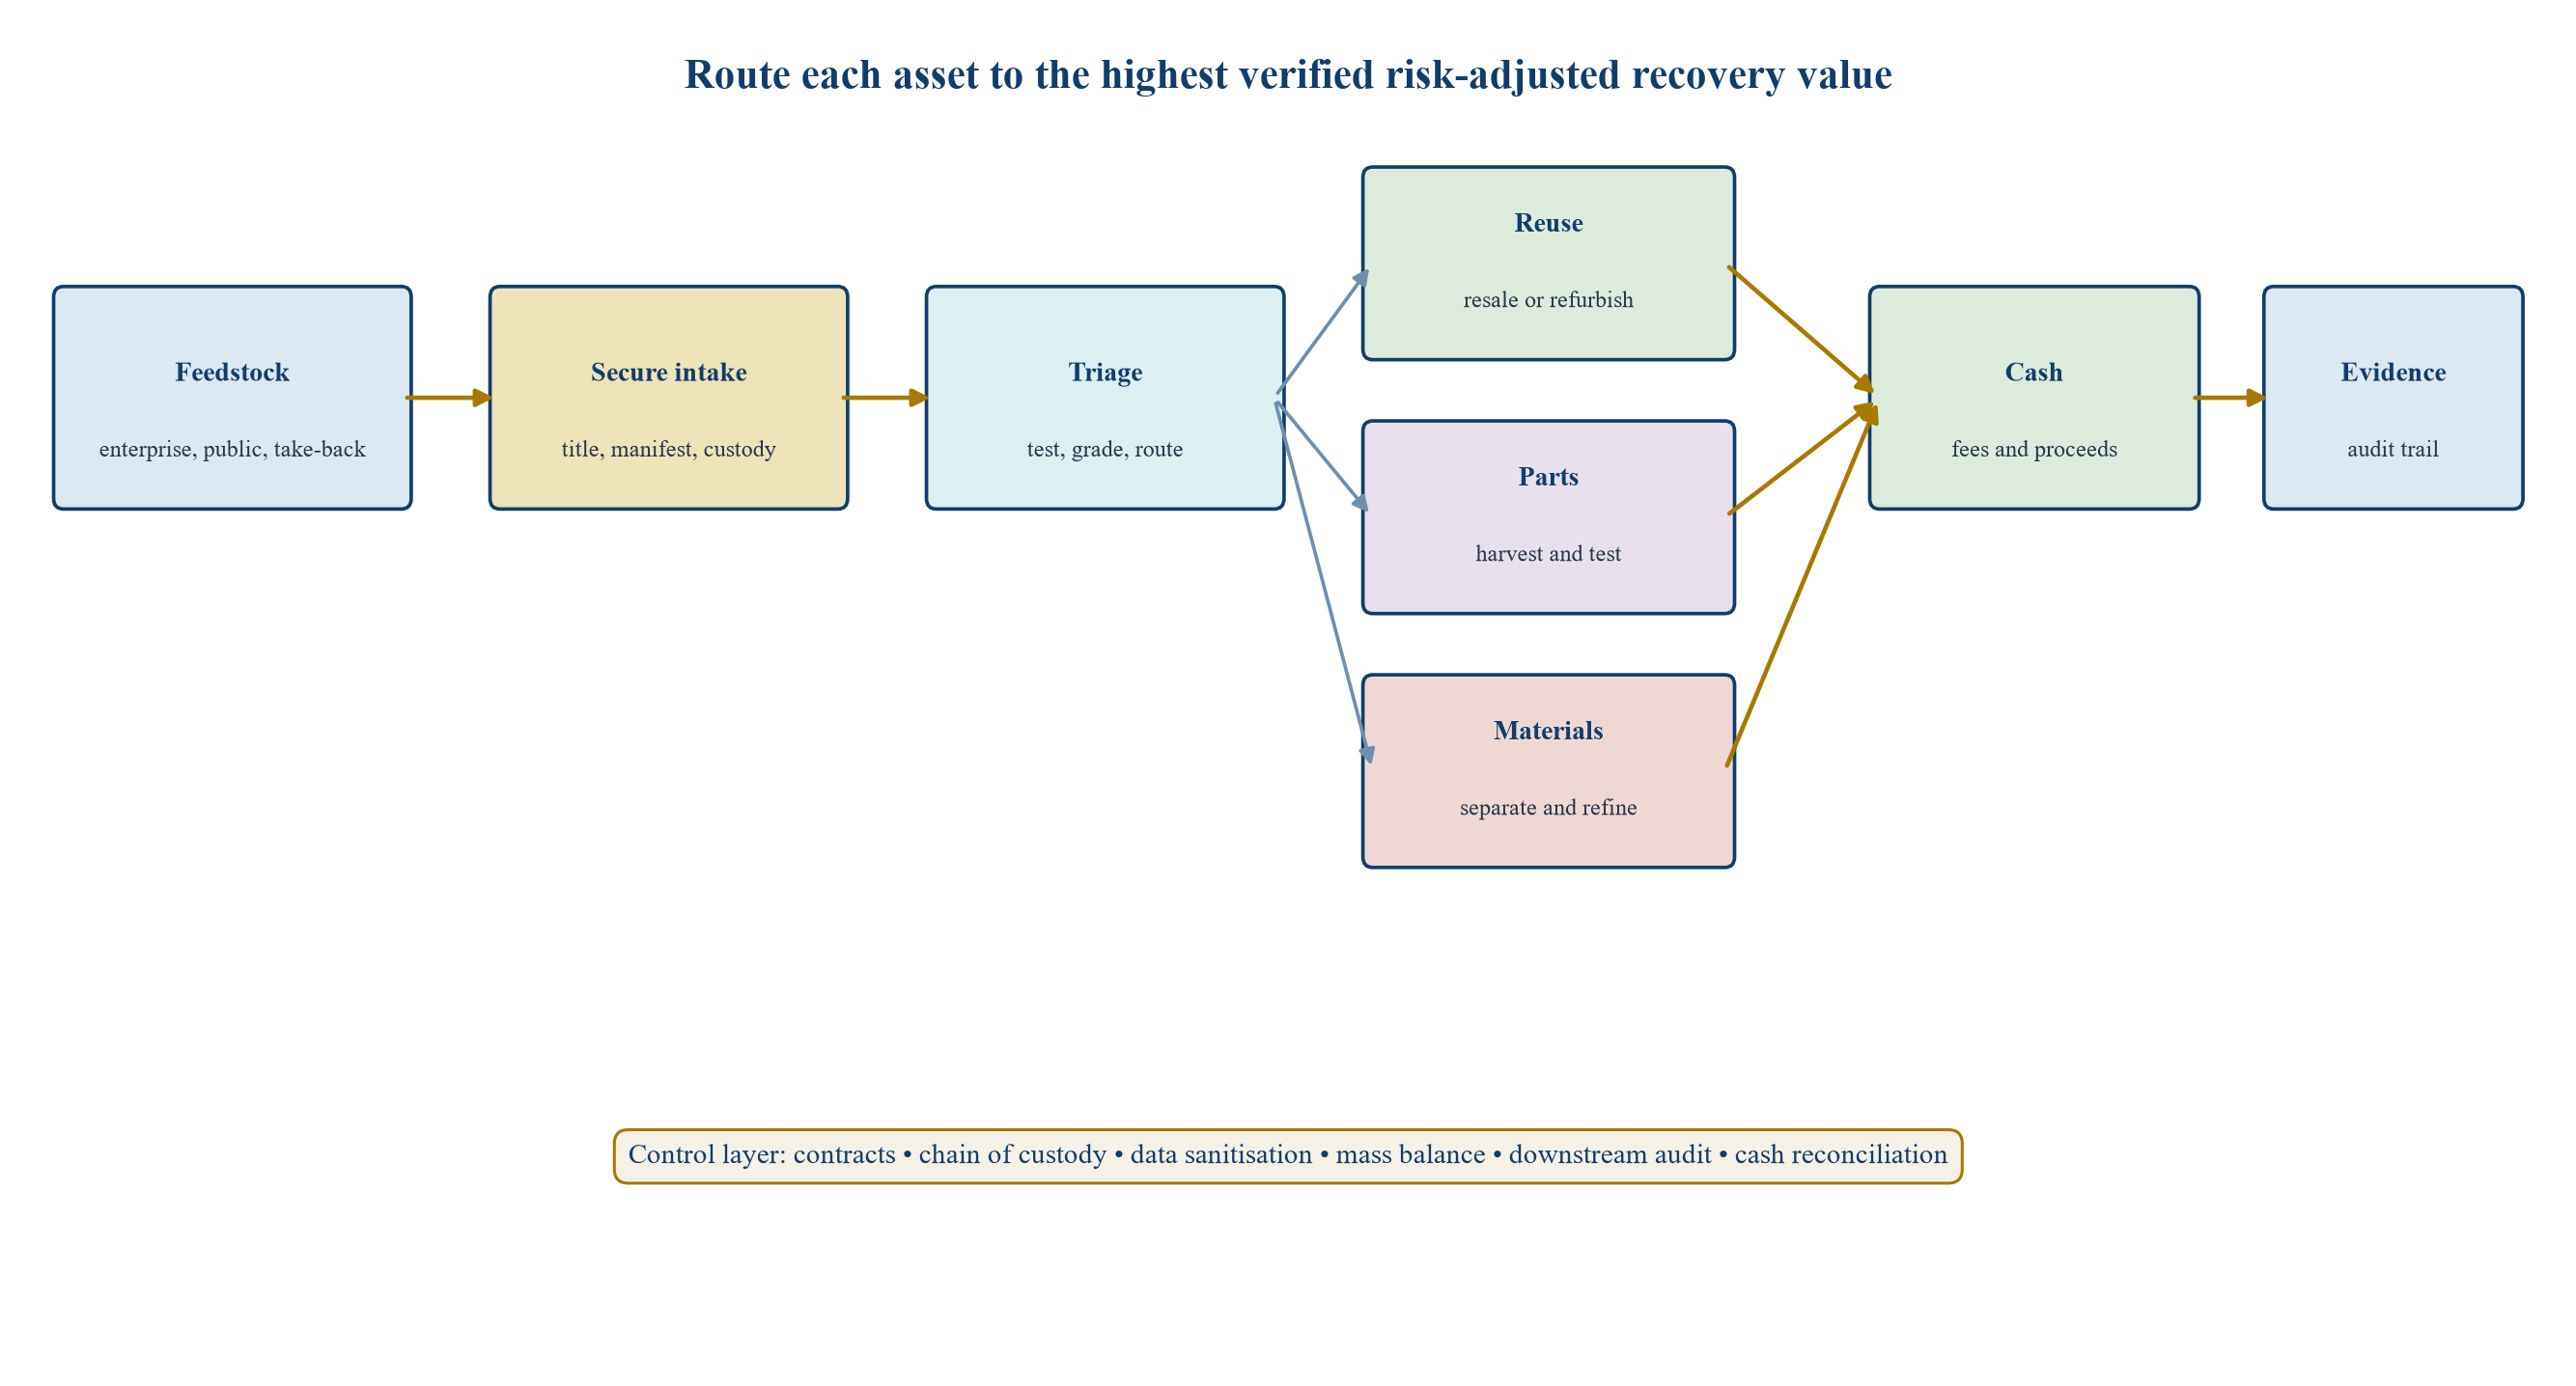
Figure 1 maps the core system. Equipment enters through enterprise contracts, public collections, producer take-back or purchased lots. The platform establishes title, records chain of custody and grades items. Assets then follow one of four routes: direct reuse, refurbishment, component harvesting or material recovery. Residues move to compliant disposal. Data-bearing media passes through an approved sanitisation or destruction pathway before resale or recycling.
Value leakage occurs at the hand-offs. Inaccurate manifests hide missing assets. Slow triage destroys resale value. Poor testing increases returns. Weak parts catalogues create dead stock. Mixed shredding reduces fraction quality. Informal downstream routes create legal and reputational exposure. A platform earns its valuation premium by controlling these hand-offs through data, process and commercial contracts.
The system should be reconciled as a mass and asset balance. Units and weight received must reconcile to units resold, parts retained, material fractions shipped, residues disposed and inventory on hand. Exceptions should be investigated. This operational reconciliation is the foundation for revenue assurance and environmental claims.
Generic decision framework; routes, permits and downstream controls require company-specific verification.
5. Business-model comparison
Table 1. E-waste recovery platform business models and valuation lenses
| Model | Primary customer promise | Main revenue | Main capital need | Principal risk | Suitable valuation lens |
|---|---|---|---|---|---|
| Collection and logistics aggregator | Convenient compliant collection | Fees and logistics margin | Vehicles, containers, working capital | Route density and customer concentration | Service multiple and DCF |
| Secure IT asset disposition | Chain of custody, sanitisation and audit evidence | Service fees plus revenue share | Secure facilities, systems, insurance | Data breach and certificate failure | Recurring-service multiple and DCF |
| Refurbishment and resale | Recover highest product value | Product sales and warranty income | Inventory and testing capacity | Obsolescence, returns and channel risk | Retail or recommerce cohort economics |
| Component harvesting | Supply tested reusable parts | Component sales | Testing, catalogue and storage | Slow inventory and uncertain demand | Inventory-adjusted earnings approach |
| Pre-processing and separation | Produce saleable material fractions | Processing fee and material margin | Plant and environmental controls | Feedstock quality and commodity exposure | Throughput DCF and replacement cost |
| Specialised refining | Recover high-purity metals | Payable metal value less treatment cost | Technology, plant and permitting | Yield, recovery, hazardous chemistry | Project DCF and scenario analysis |
| Producer-responsibility platform | Deliver collection and compliance outcomes | Contracted programme fees | Data platform and partner network | Regulatory performance and partner quality | Contracted-infrastructure or service lens |
| Vertically integrated platform | Control custody and recovery end to end | Blended service, resale and materials income | Multiple facilities and working capital | Complexity, utilisation and hidden cross-subsidy | Sum of parts and consolidated DCF |
Generic comparison; company-specific economics require contract, operational and liability verification.
The table shows why a single revenue multiple is inadequate. A vertically integrated platform may contain a high-quality secure-service business, a fast-moving resale operation and a capital-intensive processing plant. Each component has different cash conversion and risk.
6. The revenue-quality ladder
Revenue quality can be organised into five levels. The first is contracted service revenue with minimum commitments and limited commodity exposure. The second is recurring service revenue without firm volume. The third is resale margin supported by tested cohorts and established channels. The fourth is processing income linked to documented yield and customer contracts. The fifth is speculative value based on forecast commodity recovery without contracted feedstock or offtake.
The ladder helps investors distinguish visible cash flow from optionality. Management may describe all collected material as a resource. The valuation model should recognise only the portion that has a defensible route to cash after processing cost, residue, losses and settlement deductions.
Contract review is essential. A customer agreement may promise preferred-supplier status without committing volume. A revenue-share contract may pass residual-value risk to the platform. A producer-responsibility contract may impose penalties for missed collection targets. An offtake agreement may use provisional pricing followed by assay and final settlement. Each term affects enterprise value.
7. Feedstock as the first financing asset
Processing capacity has limited value without feedstock. Investors should treat feedstock coverage like contracted capacity in other infrastructure sectors, while recognising that waste contracts vary widely in enforceability and quality.
A useful coverage ratio divides contracted acceptable feedstock by practical plant capacity. Acceptable feedstock excludes material outside specification, uneconomic collection areas and volumes that can be redirected by the supplier. The ratio should be calculated by material family and route, not only in aggregate.
Customer concentration can be positive during ramp-up because anchor customers support utilisation. It becomes a valuation discount when contract expiry, change-of-control rights or repricing could remove a large portion of gross profit. The model should apply renewal probabilities and transition costs explicitly.
Feedstock purchase commitments create working-capital exposure. If the platform pays before grading or downstream settlement, it finances quality uncertainty. Price formulas should include grade, age, test result and recovery deductions. Advance payments should be capped and supported by audit rights.
8. Hypothetical unit economics
The following case illustrates a blended tonne received by a regional platform. It is a decision example, not a market forecast.
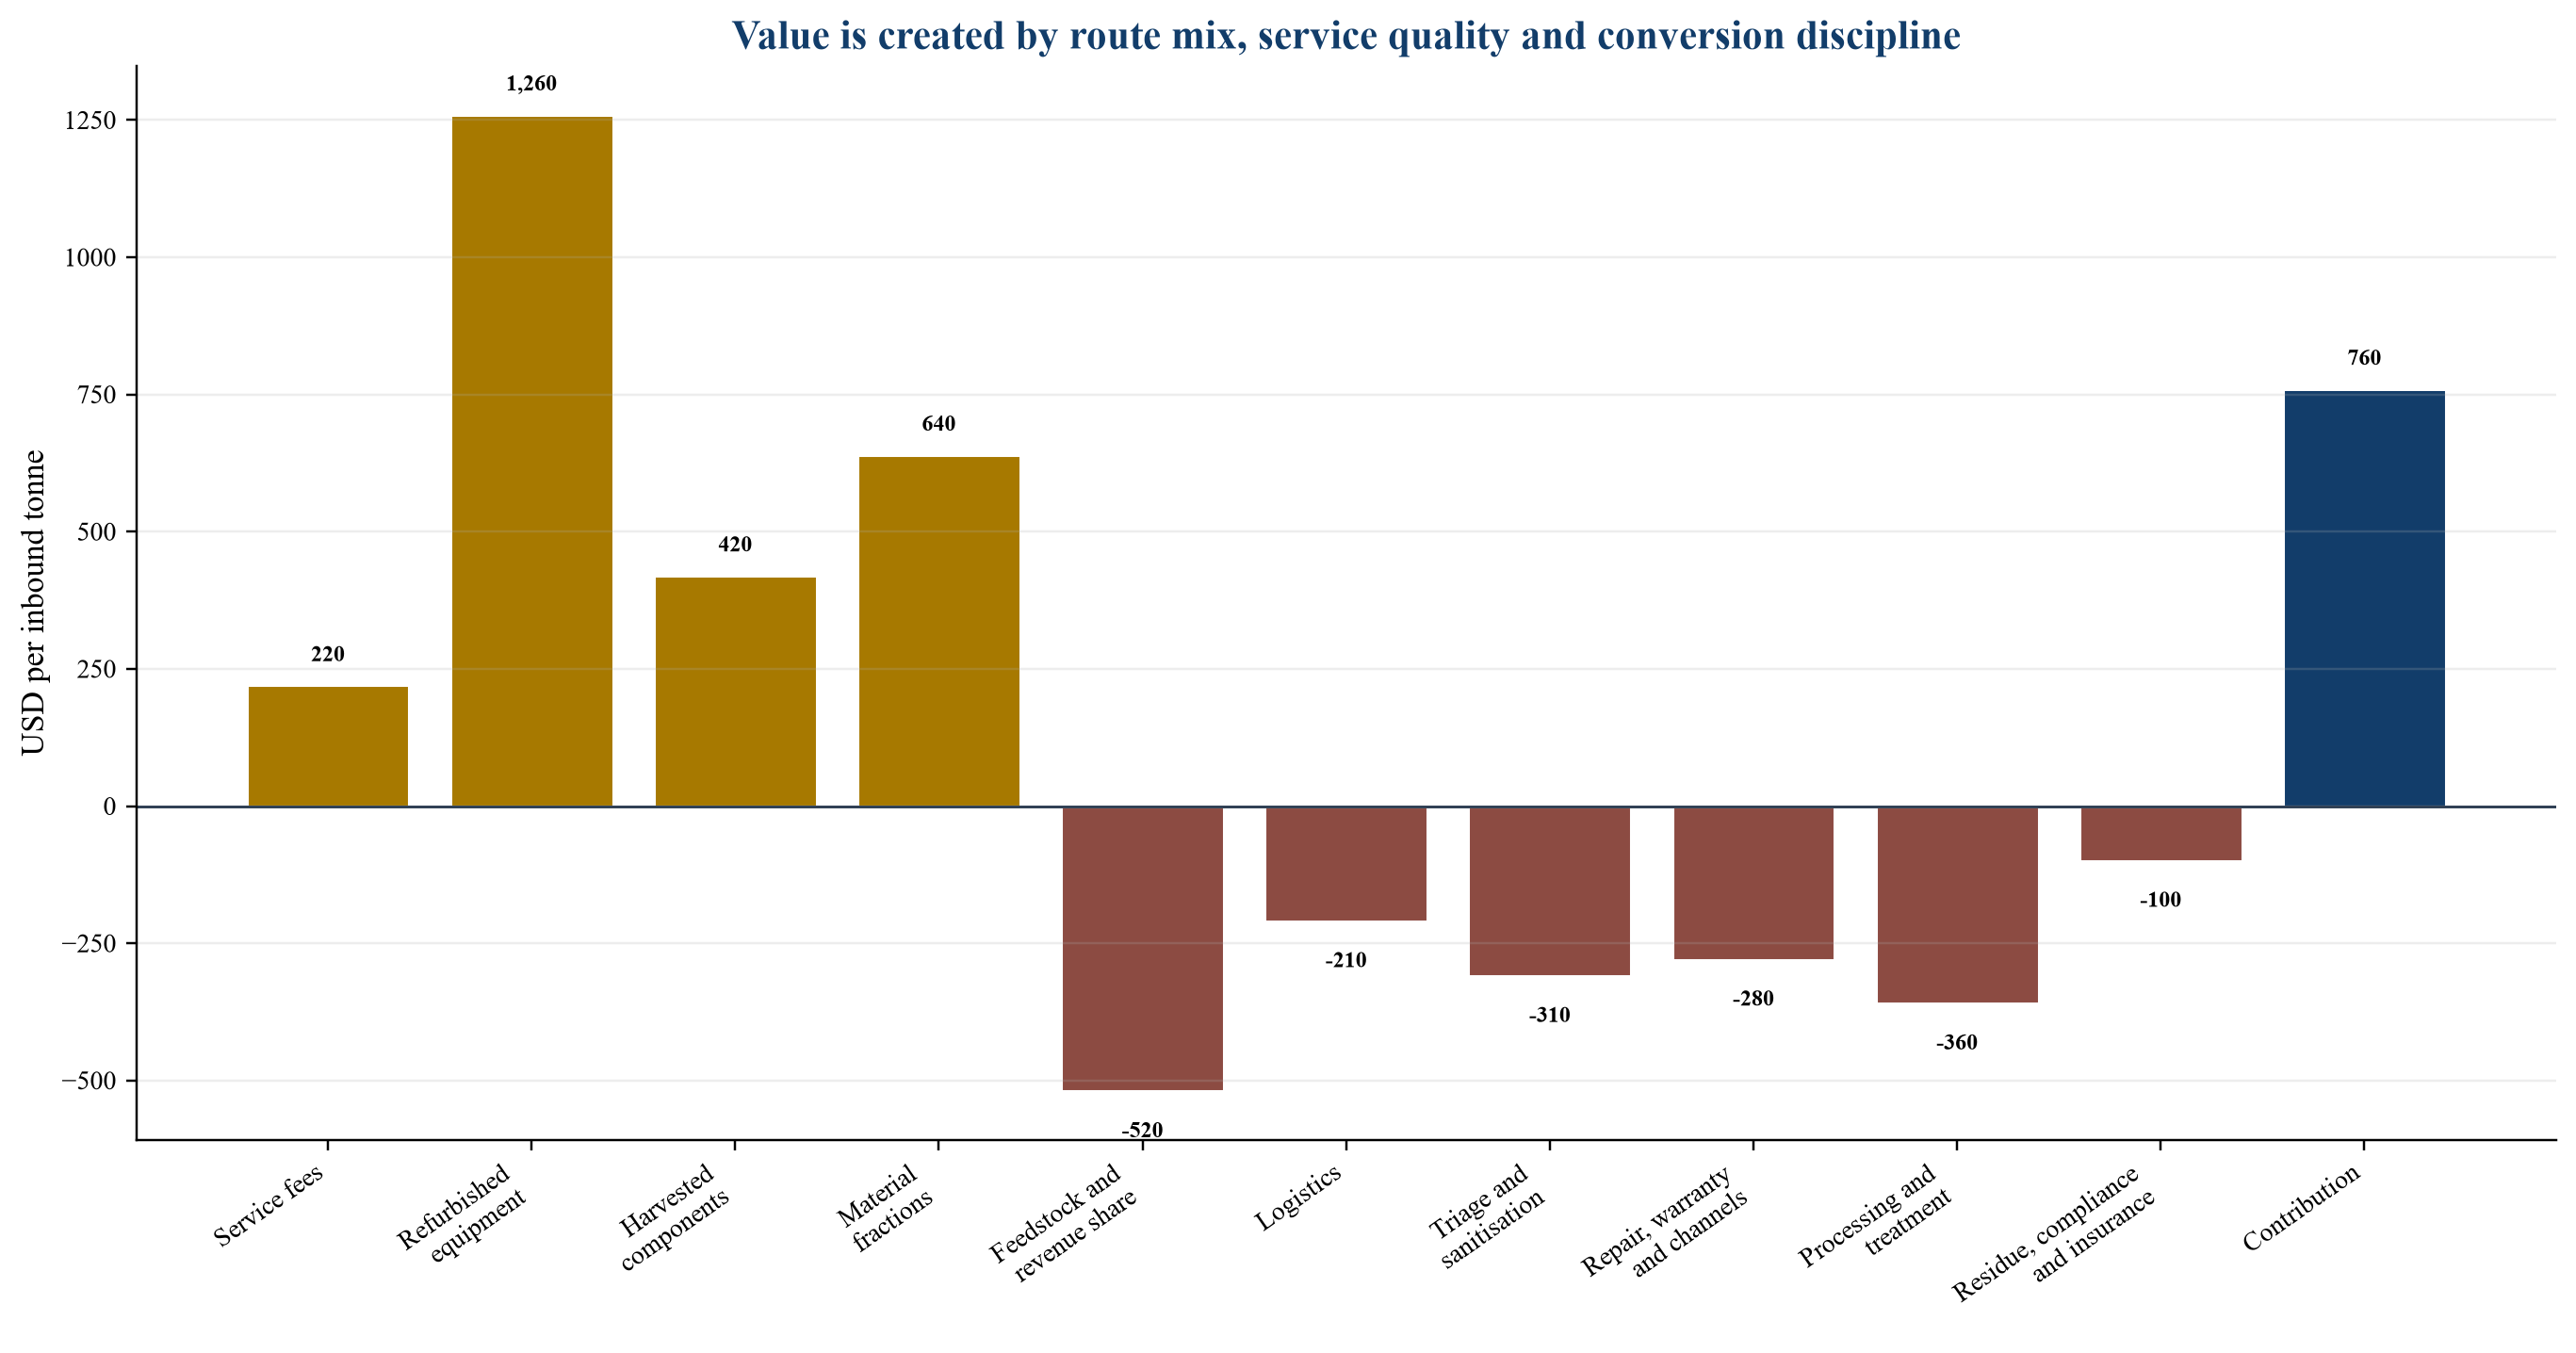
Assume one inbound tonne consists of enterprise computing and telecommunications equipment. The platform receives a service fee of USD 220 per tonne. After triage, 18 per cent of weight is sold as refurbished units, 12 per cent is harvested for components, 60 per cent becomes saleable material fractions and 10 per cent becomes residue. Product and component routes produce more revenue per kilogram than bulk material, but require testing, labour, warranty and inventory.
The illustrative revenue stack comprises USD 220 of secure collection and disposition fees, USD 1,260 of refurbished-equipment revenue, USD 420 of harvested-component revenue and USD 640 of material-fraction revenue per inbound tonne. Illustrative direct costs comprise USD 520 of feedstock acquisition and customer revenue share, USD 210 of collection and inbound logistics, USD 310 of triage, testing and sanitisation, USD 280 of repair parts, warranty and channel fees, USD 360 of dismantling, separation and downstream treatment, and USD 100 of residue, compliance and insurance allocation. The resulting illustrative contribution before fixed overhead is USD 760.
The example shows that material value is only one component of the economics. If refurbishment yield falls, total contribution can decline even when tonnes are unchanged. If the platform receives higher service fees for secure disposition, earnings may become more resilient to commodity prices. If customer revenue share rises with resale proceeds, the platform retains less upside.
Figure 2 should display the revenue and cost bridge. Its purpose is to make the economic hierarchy visible: service, reuse and parts can finance the lower-margin material route, while compliance and residue remain real costs.
Illustrative decision case in USD; it is not a forecast, quotation or representation of a named company.
9. Working capital: the hidden mine development cost
Urban-mining platforms can consume cash even when accounting margins appear attractive. Equipment may be purchased or revenue-shared before it is tested and sold. Refurbished inventory may sit in transit or on online marketplaces. Material fractions may be shipped on provisional assay terms. Customers may pay service invoices slowly while suppliers demand rapid settlement.
The cash-conversion cycle should be modelled separately for each route. Service receivables, resale inventory and refinery settlements have different durations. A blended days-working-capital assumption can conceal stress.
Inventory controls should identify assets by cohort, grade and expected route. Provisioning should increase with age and failed-test history. Material inventory should reconcile to weight and expected metal content. Off-balance-sheet consignment arrangements require review because economic risk may remain with the platform.
Financing structures include receivables facilities, inventory borrowing bases, equipment finance, customer advances and supplier credit. A borrowing base should exclude disputed receivables, obsolete devices, unsupported metal estimates and material outside permitted specifications. Advance rates should reflect liquidation evidence.
10. Compliance, custody and contingent liability
Environmental and data-security liabilities can outlive the equipment. The acquisition model should map responsibility from collection to final treatment. Certificates from subcontractors are useful evidence only when the subcontractor is qualified, the material can be traced and the certificate matches the actual load.
The Basel Convention’s 2025 e-waste amendments increase the importance of classification and prior informed consent for cross-border movements. A platform should know whether material is a product for reuse, waste destined for recovery or hazardous waste. Misclassification can delay shipments, increase storage costs and create enforcement exposure.
Data-bearing assets create a separate chain. NIST SP 800-88 Revision 2 provides current guidance for media sanitisation programmes. Commercial diligence should test policy selection, sanitisation methods, verification, exception handling and record retention. Physical destruction can reduce data risk but may destroy reuse value. The platform must align method with information sensitivity and customer requirements.
Insurance policies should be read for coverage limits, exclusions, retroactive dates and subcontractor acts. Environmental impairment, cyber, professional indemnity, product liability and cargo policies may all be relevant. Insurance does not replace process control; it affects the tail-risk model.
11. Technology and data as valuation drivers
Technology creates value when it changes routing accuracy, cycle time, recovery yield or compliance cost. A platform may use computer vision for device identification, automated grading, digital chain-of-custody records, dynamic resale pricing, robotics for disassembly, sensor-based sorting and process analytics.
Technology claims require measurable baselines. A model should identify whether an application increases tested units per labour hour, reduces false grading, lifts resale realisation, improves fraction purity, reduces energy use or lowers exception rates. A demonstration is not a financial benefit until the result persists in production and affects cash.
Data can become a commercial asset. Enterprise customers may value dashboards showing asset status, sanitisation evidence, reuse outcomes and final treatment. Producers may require compliance reporting. Buyers may use historical recovery data to price incoming lots. The platform’s data model should connect each physical asset to custody events and financial outcomes.
Artificial intelligence can improve classification and pricing when training data is representative and outputs are monitored. Governance should cover data rights, model drift, human review and error costs. A wrong grade can create resale losses; a wrong waste classification can create regulatory exposure. Decision support should therefore be linked to thresholds and escalation.
12. Capital expenditure and capacity design
Capacity should follow the bottleneck. A platform may invest in shredding while constrained by collection, or build refining capacity while unable to produce consistent intermediate material. The capital plan should trace each expenditure item to contracted feedstock, incremental margin and operational readiness.
Asset-light models use third-party logistics and processors. They can scale faster and preserve capital, while sacrificing control and margin. Asset-heavy models can improve custody and capture processing economics, while increasing fixed costs and permitting exposure. Hybrid models often retain secure intake, testing and high-value routing in-house while contracting commodity processing.
The decision should be made on an incremental basis. For each proposed facility, compare outsourcing cost with in-house cash cost, required capital, ramp time, yield risk, maintenance, environmental controls and residual value. Include downtime and underutilisation. A plant designed for nameplate throughput may have materially lower practical capacity because of product changeovers, contamination and maintenance.
13. Sources and uses for a hypothetical platform expansion
The following financing case illustrates a USD 24 million regional expansion. Amounts are management-case assumptions for analytical purposes.
Table 2. Hypothetical sources and uses for a regional e-waste platform expansion
| Uses | USD million | Sources | USD million |
|---|---|---|---|
| Secure intake and testing facility | 4.5 | Sponsor equity | 9.0 |
| Refurbishment lines and diagnostic equipment | 3.0 | Senior equipment and term debt | 7.0 |
| Pre-processing and separation equipment | 6.0 | Working-capital facility | 4.0 |
| Environmental controls and site works | 2.0 | Customer mobilisation advances | 2.0 |
| Chain-of-custody and operating systems | 1.5 | Subordinated or strategic capital | 2.0 |
| Initial inventory and receivables funding | 4.0 | ||
| Ramp-up reserve and contingency | 3.0 | ||
| Total uses | 24.0 | Total sources | 24.0 |
Illustrative USD million case; amounts are decision assumptions rather than a financing proposal or market quotation.
Debt capacity should be based on contracted service cash flow and conservative recovery margins. Equipment lenders may finance identifiable machinery, while working-capital lenders require a controlled borrowing base. Customer advances can reduce funding needs when tied to mobilisation deliverables. Strategic capital may be appropriate where a producer, technology provider or offtaker gains supply-chain benefits.
Financial covenants should address fixed-charge coverage, minimum liquidity, eligible borrowing-base assets, customer concentration and capital-expenditure overruns. Environmental and data-security events should trigger reporting and remediation obligations.
14. Valuation architecture
14.1 Sum of parts
A sum-of-parts approach separates recurring secure-service earnings, resale operations, component inventory and processing assets. It prevents a high service multiple from being applied to commodity-linked earnings. It also reveals cross-subsidies.
The service component can be valued through discounted cash flow and comparable recurring-service businesses, adjusted for concentration, retention and liability. Refurbishment can be valued through cohort contribution, inventory turns and sustainable channel economics. Processing should use a throughput-and-yield DCF with commodity and utilisation sensitivities. Non-operating inventory should be marked to realisable value after ageing and selling cost.
14.2 Discounted cash flow
The DCF should model routes separately. Feedstock volumes drive intake; triage determines route mix; route mix drives revenue and cost; capacity and working capital determine cash conversion. Commodity prices should influence only the relevant material fractions. Residual values for specialised plants should be conservative.
Terminal growth should not assume that e-waste volume automatically becomes the platform’s feedstock. Competitive collection markets, product miniaturisation, repairability and material substitution can change economics. A terminal multiple should be cross-checked against reinvestment needs.
14.3 Transaction multiples
Comparable transactions require careful normalisation. Reported revenue may be gross product sales, net commission, service fees or metal settlement. EBITDA may exclude environmental provisions, owner costs or growth expenditure. Buyers may pay for feedstock contracts, geographic permits, customer relationships or downstream capacity. A headline multiple without these details has limited use.
14.4 Replacement cost and option value
Replacement cost can support valuation for permitted facilities, secure sites and specialised equipment. It should be reduced for obsolescence, underutilisation and restart cost. Strategic option value may exist where the platform provides future access to critical materials or regulated collection networks. Such value belongs in a buyer-specific scenario, not the base case.
15. Valuation sensitivity
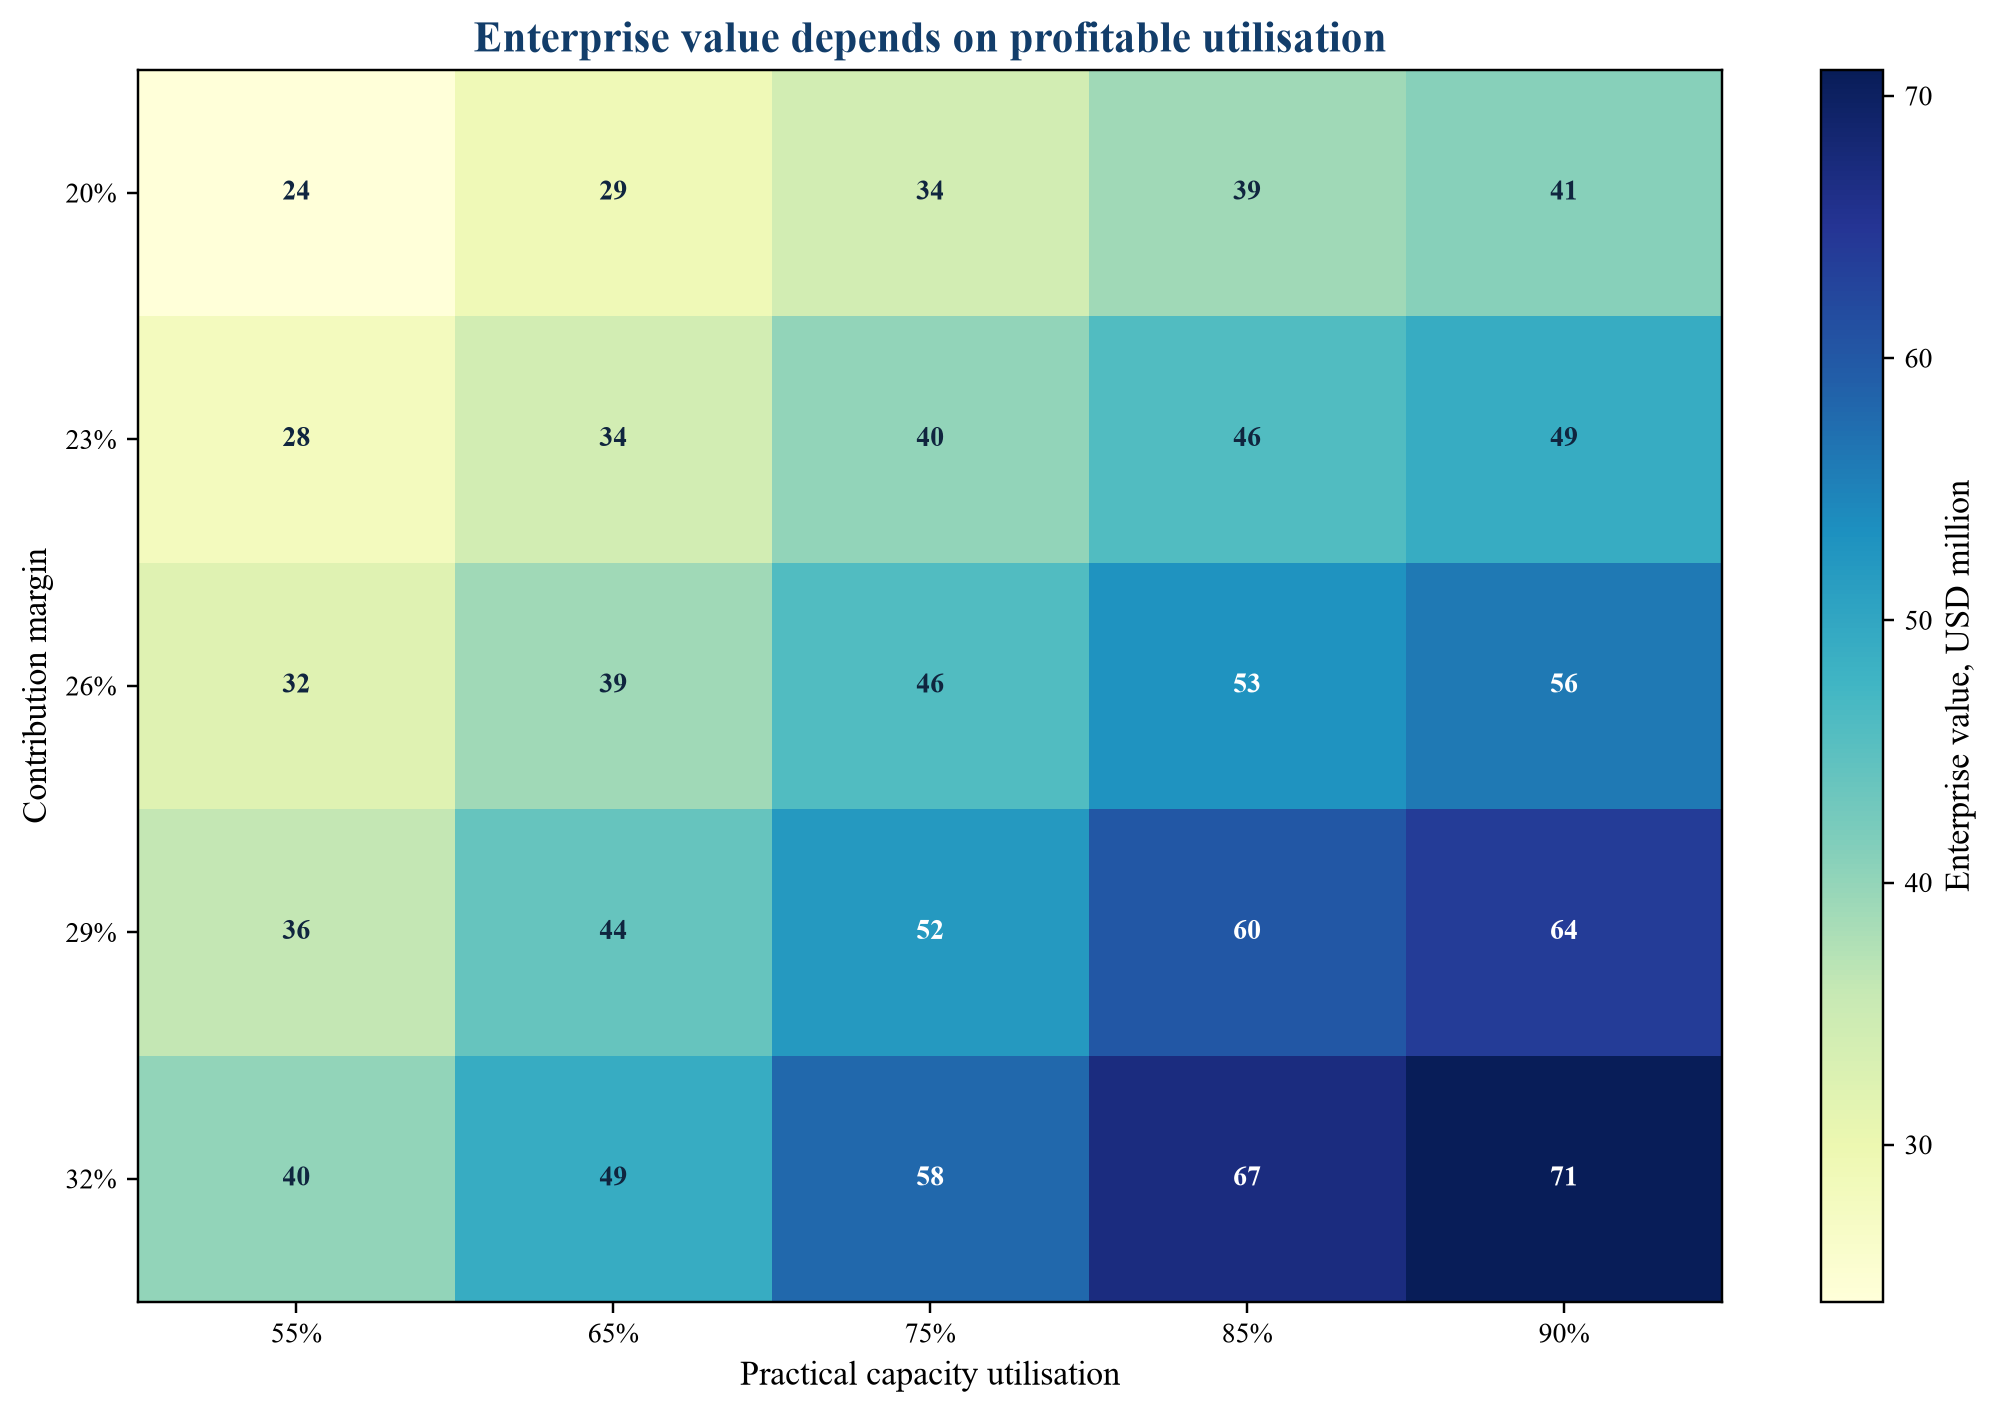
Assume a hypothetical platform generates USD 6 million of steady-state EBITDA before growth capital. A base enterprise multiple of 8.0 times implies USD 48 million of enterprise value. The appropriate value changes with utilisation, contribution margin, contract visibility and liability.
Figure 3 should show a sensitivity matrix. Across the horizontal axis, practical capacity utilisation ranges from 55 per cent to 90 per cent. Across the vertical axis, contribution margin ranges from 20 per cent to 32 per cent. Lower utilisation and margin reduce both EBITDA and the confidence in terminal economics. Higher utilisation supported by contracted feedstock improves operating leverage, although concentration and renewal risk still require discounts.
Table 3. Hypothetical enterprise-value sensitivity
| Hypothetical enterprise value, USD million | 55% utilisation | 65% | 75% | 85% | 90% |
|---|---|---|---|---|---|
| 20% contribution margin | 24 | 29 | 34 | 39 | 41 |
| 23% contribution margin | 28 | 34 | 40 | 46 | 49 |
| 26% contribution margin | 32 | 39 | 46 | 53 | 56 |
| 29% contribution margin | 36 | 44 | 52 | 60 | 64 |
| 32% contribution margin | 40 | 49 | 58 | 67 | 71 |
Illustrative USD million values; a real valuation requires verified forecasts, capital needs and liability adjustments.
The matrix is illustrative. A real valuation would calculate route-level cash flow, capital expenditure, tax, working capital, debt and terminal assumptions. Its purpose is to show that capacity has no standalone value without profitable utilisation.
Illustrative USD million values; company-specific valuation requires verified forecasts, liabilities and capital requirements.
16. Quality of earnings
A quality-of-earnings review should rebuild revenue from operational records. Service invoices should reconcile to contracts, collections and certificates. Product sales should reconcile to serialised inventory, channel statements, returns and cash. Component sales should reconcile to tested stock. Material settlements should reconcile to shipment weight, assay, payable terms and final cash.
Normalisation should remove one-off stock releases, unusual commodity gains, related-party transactions and underprovided warranty or environmental costs. Labour used for sorting and repair must be allocated consistently. Capitalised development or site costs should be tested for recurring operating character.
The review should calculate contribution by cohort and customer. A high-margin customer may supply unusually good assets or accept a different revenue share. Those economics may not scale. A loss-making contract may be justified only if it provides anchor volume for a broader network, and that benefit should be demonstrated.
17. Environmental claims and evidence
Circular-economy claims can support customer demand and financing. They also create disclosure risk. A platform should distinguish equipment collected, equipment reused, material sent for recycling, material actually recovered and residue disposed. These measures are not interchangeable.
Avoided-emissions claims depend on methodology, system boundaries and substitution assumptions. The company should disclose whether a refurbished device displaces a new purchase, whether downstream recovery is measured or estimated, and how transport and processing are treated. Investors should value strong measurement systems as risk control rather than assume that every environmental claim creates revenue.
The EU Joint Research Centre’s 2026 work on waste streams and critical raw materials illustrates the policy movement toward identifying products, components and waste streams with meaningful recovery potential. Platforms that can provide reliable composition and recovery data may become more useful to producers and public authorities.
18. Acquisition diligence agenda
Commercial diligence should cover the following questions:
1. Which contracts provide enforceable volume, and what material is excluded? 2. How much gross profit comes from the ten largest customers and channels? 3. What percentage of intake is resold, refurbished, harvested, recycled or disposed? 4. How quickly does each route convert to cash? 5. What evidence supports recovery yields and environmental claims? 6. How are data-bearing devices controlled from collection to sanitisation? 7. Which downstream vendors handle material, and how are they audited? 8. What permits, consents and export classifications are required? 9. What incidents, rejected shipments, fines, claims or data losses have occurred? 10. Which systems reconcile serial numbers, weight, inventory and settlement?
Operational diligence should observe the physical process. Reviewers should sample inbound loads, trace devices through the system, test inventory accuracy and inspect residue handling. Document review alone may miss informal workarounds.
Financial diligence should rebuild route-level gross profit and working capital. Legal diligence should review title, customer obligations, permits, waste classification, export consent, product warranty, data protection and subcontractor liability. Technical diligence should test practical capacity, maintenance condition, yield evidence and the scalability of sorting or recovery technology.
19. Red flags that should affect price or structure
Red flags include unexplained gaps between collected and shipped weight; certificates that cannot be linked to specific loads; high revenue from a single broker; old inventory carried near original expected value; commodity hedges unrelated to physical exposure; material exported under ambiguous reuse classification; and environmental claims based on assumed rather than measured recovery.
Other concerns include customer contracts terminable on change of control, unrecorded revenue-sharing obligations, sanitisation methods inconsistent with customer policy, reliance on one key technician, and processing equipment operating materially below practical capacity.
These issues do not always terminate a transaction. They can change price, escrow, indemnity, earn-out, working-capital target, insurance requirement or closing condition. The transaction structure should place each risk with the party able to verify or control it.
20. M&A structure and risk allocation
A buyer may acquire shares, assets, contracts or selected facilities. A share acquisition preserves licences and contracts more easily but carries historical liabilities. An asset acquisition can isolate selected operations, subject to transfer rules and successor-liability analysis.
Earn-outs can link price to contract renewal, throughput, gross profit or cash collection. Tonnes alone are a weak earn-out metric because low-quality volume can destroy value. Gross profit after customer revenue share, direct processing cost, returns and residue is more useful. The definition should prevent route shifting and accounting changes.
Escrows and specific indemnities may address environmental incidents, export documentation, tax, data security and warranty exposure. Warranty-and-indemnity insurance may support general claims but often excludes known environmental matters. A pre-close remediation plan should identify which issues must be cured before ownership changes.
21. Post-merger integration
Integration should protect customer custody and operating continuity. The first priority is control: common incident reporting, approved downstream vendors, data-sanitisation policy, inventory taxonomy and financial reconciliation. Commercial integration follows once the buyer understands route economics.
A 100-day plan can be organised into four workstreams. The custody workstream aligns collection, tracking, sanitisation and certificates. The commercial workstream maps contract profitability and renewal. The operations workstream standardises grading, routing, inventory and mass balance. The finance workstream aligns revenue recognition, provisions, working capital and capital approvals.
Synergy estimates should be route-specific. Procurement savings, shared logistics, better resale channels, higher utilisation and consolidated downstream terms are measurable. Broad circular-economy positioning is a strategic narrative until it changes customer wins, pricing or capital cost.
22. Financing options by platform maturity
Early platforms are usually equity-funded because feedstock, route economics and operating controls remain unproven. Venture or growth capital may fund software, contract acquisition and limited equipment. Asset-backed debt becomes more plausible when receivables and inventory are controlled. Equipment debt can fund proven machinery with identifiable resale value.
Established platforms can combine senior term debt, revolving working-capital facilities and acquisition finance. Infrastructure-style capital may be relevant where long-term producer or municipal contracts support dedicated facilities. Project finance requires ring-fenced cash flow, credible feedstock and offtake, proven technology, permits and completion support.
Green or sustainability-linked instruments can support eligible expenditure when use of proceeds, performance indicators and reporting are credible. Financing should not depend on environmental labels alone. Lenders still require cash flow, security, covenants and remedies.
23. Strategic choices for management
Management should choose which economic engine it intends to lead. A secure IT asset-disposition specialist may outsource commodity processing. A materials-recovery operator may partner with collection networks. A producer-responsibility platform may remain asset-light and govern partners through data and audit. Each model can work if contracts, capabilities and capital are aligned.
Vertical integration deserves a stage gate. The first gate proves feedstock. The second proves routing and unit economics. The third proves downstream sales. The fourth proves technology and permitting. The fifth approves capital only when the integrated case outperforms a contracted alternative after risk and financing cost.
Geographic expansion should follow customer density and regulatory capability. A new country adds transport, permits, product channels and export rules. A hub-and-spoke model can centralise high-value testing while keeping collection local. The design must respect cross-border waste controls.
24. Decision framework
The investment committee can use six tests.
Test one: control of feedstock. Is volume supported by contracts, relationships or regulation, and is its quality understood?
Test two: route advantage. Does the platform consistently direct assets toward higher net recovery value?
Test three: evidence. Can serial-number, weight and cash records be reconciled?
Test four: liability discipline. Are data, environmental and export obligations controlled across subcontractors?
Test five: capital productivity. Does each facility earn an acceptable return at practical utilisation?
Test six: financing resilience. Can the platform fund inventory, receivables and settlement delays under downside conditions?
A platform that passes all six tests can convert a fragmented waste stream into a financeable operating system. Failure in one test should appear in price, structure, covenants or the decision not to proceed.
25. Conclusion
E-waste growth creates an opportunity, but tonnes do not equal value. The investable asset is a controlled conversion system that originates suitable equipment, protects custody, selects the best recovery route, monetises outputs and documents final treatment.
Secure disposition, refurbishment, components and materials recovery should be modelled as distinct economic engines. Their revenue quality, working capital, capital intensity and liability differ. A sum-of-parts valuation supported by route-level cash flow is usually more informative than a single blended multiple.
The strongest platforms combine contracted feedstock, disciplined triage, fast cash conversion, auditable data and qualified downstream partners. Technology improves value when it raises routing accuracy, throughput, recovery or control. Vertical integration improves value when incremental margin exceeds the full cost of capital and risk.
For investors and acquirers, the central question is practical: how much verified cash can the platform recover from each inbound cohort after acquisition cost, processing, working capital, compliance and residue? Answering that question turns the metaphor of a city as a mine into a transaction-ready investment case.
26. Route-level operating scorecard
A board scorecard should connect physical activity to cash. Collection metrics should include contracted volume, actual volume, average collection cost, failed pickups and manifest accuracy. Secure-disposition metrics should include devices received, devices sanitised, exceptions, certificates issued within the service standard and incidents. Refurbishment metrics should include diagnostic pass rate, repair cost, days to listing, sell-through, return rate and warranty cost. Recovery metrics should include input weight, fraction yield, purity, treatment charge, payable recovery and residue.
Financial metrics should be shown beside the operating measures. Service gross profit, cohort contribution, inventory ageing, cash settlement days and maintenance capital expenditure allow directors to see whether apparent operational growth creates cash. A tonne collected should never be reported without its acquisition cost, route and expected realisation.
The scorecard should preserve cohorts. Monthly averages can hide deterioration when older high-value equipment is mixed with newer low-value feedstock. Cohort reporting identifies whether a customer, geography, device family or acquisition channel creates the variance.
27. Downside cases and liquidity planning
The base case should be accompanied by independent downside cases. A volume downside tests contract non-renewal or delayed mobilisation. A route-mix downside reduces refurbishment yield and increases material processing. A price downside lowers resale and commodity realisation. An operating downside reduces throughput and adds repair or residue cost. A compliance downside includes shipment delay, remediation, legal cost and customer loss.
Liquidity planning should combine these shocks. A weak platform may face lower proceeds and higher inventory at the same time. Covenant headroom calculated from EBITDA alone can overstate resilience when cash is trapped in devices or refinery settlement.
A practical reserve should cover fixed operating cost, shipment delay, customer deductions, warranty claims and remediation. The reserve can reduce distributions during growth, yet it protects the platform from selling inventory at distressed prices or interrupting controlled processing.
28. Geographic strategy and trade routes
Geography changes both feedstock and exit routes. Dense enterprise markets can support secure collections and refurbishment. Regions with limited secondary channels may depend on exports. Specialist material recovery may be concentrated in a small number of jurisdictions. The platform must therefore model each physical route from origin to compliant end destination.
Expansion analysis should identify local waste definitions, permits, producer-responsibility schemes, data-protection rules, labour requirements, transport cost and secondary-market demand. A country with strong collection regulation may still be unattractive if the platform cannot reach qualified processing or resale channels.
Regional hubs can improve scale when high-value products move lawfully and efficiently. Lower-value material is more sensitive to freight and consent cost. Route design should reserve international movement for products and fractions whose net value supports the compliance burden.
29. Offtake and downstream counterparty risk
Downstream buyers convert inventory into cash. Their credit quality, assay practice, payment terms and acceptance criteria matter. A high quoted price has limited value if settlement is delayed or deductions are opaque.
Contracts should specify sampling, moisture, contamination, payable content, treatment and refining charges, provisional payment, final settlement and dispute resolution. The platform should retain representative samples or independent evidence when economically practical. Concentration should be measured by gross profit and receivables as well as tonnage.
Multiple qualified outlets can improve resilience. They can also fragment volumes and weaken terms. The correct strategy balances competition with the benefits of predictable specification and settlement.
30. Governance and decision rights
Clear decision rights reduce the temptation to chase volume. Commercial teams may sign contracts based on tonnes, operations may favour easy processing, and finance may focus on reported revenue. A route-economics committee can require common assumptions for feedstock acquisition, resale value, recovery yield, liability and working capital.
Capital approval should require a named feedstock case, practical capacity, operating readiness, offtake evidence and downside liquidity. Pricing approval should set minimum contribution by route. New downstream vendors should pass environmental, security and financial diligence before receiving assets.
Board reporting should separate verified results from management estimates. Recovery values for material still in process remain estimates until settlement. Resale values for unsold devices remain estimates until sale and return periods are understood. Transparent labelling protects decision quality.
31. Value-creation plan for private capital
A private-capital owner can create value through six coordinated programmes. The first programme secures anchor feedstock and improves contract terms. The second accelerates triage and resale to release working capital. The third standardises chain of custody and downstream audits. The fourth uses data to improve route selection and cohort pricing. The fifth removes bottlenecks before adding capacity. The sixth develops selective acquisitions that add customers, geography or capability.
Each programme requires a measurable baseline and a responsible executive. A claim that digitalisation will improve margin should be translated into specific reductions in cycle time, error, return or labour. A claim that an acquisition adds feedstock should be reconciled to contracts and route economics.
Exit preparation begins during ownership. The platform should maintain auditable cohorts, permits, incident records, customer profitability, inventory ageing and capital history. A buyer pays more readily for evidence than for a reconstructed narrative.
32. Implementation roadmap
The first thirty days establish control. Management maps feedstock contracts, title, chain of custody, permits, downstream vendors and financial recognition. It freezes unapproved routes and reconciles high-risk inventory.
Days thirty-one to sixty establish economics. The team rebuilds contribution by cohort, tests practical capacity, reviews customer and offtake terms, and identifies working-capital leakage. It agrees the operating scorecard and downside assumptions.
Days sixty-one to one hundred establish the investment plan. Management chooses the target model, approves bottleneck capital, renegotiates priority contracts and sets governance for technology, expansion and acquisitions. The board receives a financing plan linked to verified milestones.
The next twelve months focus on repeatability. The platform should demonstrate stable custody, faster cash conversion, controlled liabilities and consistent route-level contribution before pursuing major vertical integration.
Frequently asked questions
Why is collected tonnage a poor standalone valuation metric?
Tonnage does not show product condition, resale potential, material composition, acquisition cost, processing yield, residue or liability. Route-level contribution and cash conversion provide stronger evidence.
Should refurbishment and materials recovery receive the same valuation multiple?
They have different economics. Refurbishment depends on product cohorts, inventory turns and channels. Materials recovery depends on throughput, yield, commodity exposure and capital intensity. A sum-of-parts approach can reflect these differences.
What is the most important diligence record?
The most useful control is a reconciled asset and mass balance linking inbound equipment to sanitisation, resale, parts, material shipments, residue and cash settlement.
How do the Basel Convention amendments affect a platform?
The amendments effective from 1 January 2025 expand prior-informed-consent controls for covered cross-border e-waste movements. Platforms should review classification, consent, documentation, transit and rejection exposure for each route.
When can debt finance an e-waste platform?
Debt becomes more credible when contracted service cash flow, controlled receivables, eligible inventory, proven equipment and reliable working-capital data support repayment. Early technology and feedstock risk generally require equity or subordinated capital.
When does vertical integration add value?
Integration adds value when the platform has sufficient feedstock, proven recovery performance, qualified operations, permits and downstream demand, and when incremental cash return exceeds outsourcing alternatives and the cost of capital.
About the Author
Authored by Chennakeshav Adya Independent Researcher
Chennakeshav (CK) is a corporate finance and investment banking executive with 25+ years of global experience in deal origination, structuring and execution across M&A, growth capital and corporate strategy. He has led value-creation mandates for founders, corporates and funds — bridging the boardroom view to hands-on execution and close.
His career spans Morgan Stanley, HSBC, Lloyds Banking Group, EWEC, ADQ portfolio companies and Emirates Growth Fund, across TMT, real estate, fintech, deeptech, cleantech, infrastructure and energy. He has partnered with C-suite leaders, private equity and venture funds, sovereign wealth funds and family offices to finance complex fund raises and scale-up ventures, and has led M&A due diligence, post-merger integration and business-transformation initiatives to create value.
At Matchpoint Partners he is Managing Partner, leading the firm's corporate finance, M&A and capital-raising practice. He holds an MBA from London Business School, an engineering degree from VTU and a Master of Laws (LLM, in progress) from UCL London.
An active start-up mentor, CK mentors at Techstars, DIFC FinTech Hive, Startup Grind, Founder Institute and IN5, serves as Entrepreneur Mentor in Residence (EMiR) at London Business School, and judges the Entrepreneurship World Cup.
Matchpoint profile: https://www.matchpoint-partners.com/team/ck-adya.html LinkedIn: https://www.linkedin.com/in/ckadya/
