
Introduction
Industrial heat is consumed inside products, water, air, steam and equipment. A boiler fuel invoice gives management one aggregate number, while the economic opportunities sit in individual heat duties with different temperatures, operating schedules and quality requirements. A heat pump can recover low-temperature energy and raise it to a useful level. Its performance changes with the source temperature, the delivery temperature and the way the system is integrated into production.
The investment case therefore begins with a heat map rather than an equipment quotation. Management needs to know which process consumes heat, when it consumes it, what source is available, how much temperature lift is required and what production consequence follows from an interruption. These facts determine equipment size, coefficient of performance, grid demand, storage requirement and the portion of fuel that can be displaced.
The International Energy Agency estimates that commercially available heat pumps could technically supply up to around 20 per cent of global industrial heat demand, mainly in low- and medium-temperature applications.[1] Deployment remains limited because projects are customised and must be integrated into existing production systems. This paper converts that technical opportunity into an investment, financing and valuation process.
1. Define the investment decision
State the decision that management must make. It may concern one heat duty, one site, a portfolio standard, an acquisition plan or a contractual heat service. Define the required approval date, target commissioning date, maximum capital at risk, production constraints and the authority that can change assumptions.
Fix the counterfactual. A heat pump may replace an ageing boiler, avoid a new boiler, reduce use of an existing boiler, recover heat previously rejected through cooling equipment or support production expansion. Each counterfactual has a different cash-flow boundary. Avoided replacement capital should appear only when the conventional asset would otherwise have been purchased.
Set the economic test before vendor selection. Typical tests include levelised cost of useful heat, net present value, internal rate of return, minimum debt-service coverage, maximum payback, carbon intensity, production resilience and flexibility. Record which tests are binding. A project can produce positive value while failing a liquidity or production-risk constraint.
2. Establish the heat-service boundary
Define the useful heat delivered to the process. State temperature, pressure, flow, medium, purity, control tolerance, availability and ramp requirement. The boundary may sit at a hot-water header, steam manifold, dryer coil, reactor jacket or clean-in-place system. All technology comparisons should deliver the same service at that boundary.
Separate thermal output from electrical input. A heat pump's coefficient of performance is useful thermal output divided by electrical consumption over the same period and measurement boundary. Auxiliary pumps, fans, cooling towers, controls and defrost can affect the system result. A vendor headline may describe compressor performance rather than the complete installed system.
Define which costs sit inside the investment. Include source capture, exchangers, water treatment, piping, electrical works, grid reinforcement, controls, civil works, fire and safety systems, commissioning, production shutdown, owner engineering and contingency. An equipment-only price cannot support an investment decision.
3. Build a process heat inventory
Record every material heat source and sink by hour, shift or representative operating period. For each sink, capture inlet and outlet temperature, flow, heat capacity, pressure, annual operating hours, batch sequence, cleanliness requirement and criticality. For each source, capture the same variables plus contamination, distance and availability.
Measure the current fuel system. Reconcile purchased fuel to boiler efficiency, distribution losses, condensate return, venting, blowdown and end-use heat. Metering can reveal that the apparent conversion opportunity is smaller than the fuel bill suggests because part of the fuel supports higher-temperature duties, standby or losses.
Use a heat balance to identify simultaneous source and sink. A source available after the sink has stopped cannot serve it without storage. A batch process may create enough annual waste heat while failing to align during individual cycles. The inventory should preserve timing rather than reducing every stream to an annual total.
4. Match temperature before capacity
Temperature determines technology choice and efficiency. The IEA reports that industrial heat pumps below 120 degrees Celsius have entered commercial operation and systems below 160 degrees Celsius are beginning commercial deployment. Higher-temperature ranges remain at earlier technology stages.[1] The United States Department of Energy describes mechanical vapour compression, mechanical vapour recompression, thermocompression and absorption systems with different operating ranges and energy inputs.[2]
Rank sinks by the lowest temperature that reliably satisfies product and hygiene requirements. Review whether the existing steam pressure is higher than the process needs. A lower hot-water or steam set point can reduce temperature lift and improve performance without changing production output.
Classify the opportunity as standard, engineered or developmental. A familiar hot-water application with stable source heat carries a different completion risk from a high-temperature system requiring a new refrigerant, compressor or process design. Apply a maturity adjustment to contingency, schedule and financing.
5. Reduce heat demand before sizing equipment
Improve insulation, condensate recovery, process controls, leak management and heat exchanger performance before fixing heat-pump capacity. The IEA recommends efficiency measures first because lower demand and losses allow smaller electrification systems.[3] A programme that sizes equipment to an inefficient baseline can lock in avoidable capital and grid capacity.
Separate permanent savings from production changes. A lower heat load caused by a temporary volume decline should not be treated as efficiency. Normalise the baseline for throughput, product mix, weather and operating hours. Record the model used for normalisation.
Recalculate the source-sink balance after efficiency work. A measure that reduces waste heat can lower the source available to a heat pump. Another measure may increase source temperature and improve performance. Coordinate the programme at site level so individual projects do not compete for the same thermal stream.
6. Choose the heat source deliberately
Potential sources include refrigeration discharge, cooling water, wastewater, exhaust air, condensate, drying air, process effluent, ambient air, ground, surface water and neighbouring facilities. Evaluate temperature, flow, contamination, distance, seasonal variation and ownership. A high-temperature source with unreliable flow may be less valuable than a lower, stable source.
Assign rights to the source. Where the source belongs to another process, tenant or company, the project needs access, continuity, quality, maintenance and change-control terms. A source can disappear after a production-line replacement or a neighbouring asset sale.
Price source capture separately. Filtration, corrosion resistance, cleaning, pumping and redundancy can dominate integration cost. Test fouling and cleaning intervals with representative fluids. The source system should fail safely without contaminating the product or stopping the plant.
7. Select the heat-pump architecture
Mechanical vapour compression uses a refrigerant cycle and an electrically driven compressor. Mechanical vapour recompression compresses process vapour and is useful where evaporation already creates a recoverable vapour stream. Thermocompression uses higher-pressure steam or gas to upgrade lower-pressure vapour. Absorption systems use thermal energy and may suit sites with available waste heat.[2]
Select architecture after mapping source and sink. Compare achievable temperature, capacity, turndown, refrigerant, footprint, maintenance, noise, water use, control response and reference installations. Require vendors to state the boundary for every performance guarantee.
Consider a cascade where one stage cannot provide the required lift efficiently. A cascade adds equipment and controls while allowing each circuit to operate within a more favourable range. Model intermediate losses, redundancy and maintenance access. Avoid using architectural complexity solely to reach a nominal temperature that the process could reduce.
8. Model coefficient of performance across the operating envelope
Coefficient of performance falls as temperature lift increases. IEA Heat Pumping Technologies Annex 58 identifies temperature lift as a principal determinant and recommends supplying steam at the pressure actually required.[4] A single design-point coefficient is insufficient for valuation.
Build a performance map across source temperature, sink temperature, load and ambient condition. Apply the expected hourly or representative-period profile. Include auxiliaries, defrost, standby, cycling and part-load behaviour. Use measured or guaranteed performance where available and preserve the test standard.
Reconcile annual thermal output to electrical consumption. The IEA uses a coefficient of performance of 3.5 in a cross-regional cost comparison, together with stated energy-price and finance assumptions.[5] That value provides context rather than a substitute for site engineering. Project economics should use the site's expected distribution and a downside case.
9. Size for utilisation and resilience
Heat-pump economics often improve with high utilisation because capital is spread across more useful heat. Oversizing can reduce run hours and create cycling. Undersizing can leave economical base load unserved or require excessive boiler use.
Size the heat pump for a defined portion of the load duration curve. Retain an existing boiler for peaks, maintenance or contingency where that arrangement produces better value and acceptable emissions. A hybrid system can limit grid capacity and support a staged transition.
Define redundancy according to production consequence. An N+1 configuration may be justified for continuous critical heat. A batch process may tolerate planned downtime with buffer storage. Include the cost of spare parts, backup fuel and lost contribution margin in the comparison.
10. Integrate the heat pump into the process
Choose whether the heat pump supplies a central utility header or an individual process. Central integration can aggregate demand and simplify operations. Process integration can lower temperature and reduce distribution loss. Evaluate control authority and maintenance ownership under each design.
Use pinch and heat-integration analysis where the process is complex. Recover direct heat exchange before using electricity to upgrade temperature. Position the heat pump between the remaining source and sink after feasible direct recovery. This order preserves higher-value electrical input.
Design isolation, bypass and commissioning paths. Production should be able to continue safely during maintenance or initial tuning where the business case assumes continuity. Include tie-in windows, cleaning validation and product qualification in the schedule.
11. Secure grid capacity
Calculate maximum electrical demand, annual energy, ramp and power quality. Add compressors, pumps, fans and auxiliaries. Compare the requirement with the site's contracted capacity, transformer rating, protection, harmonics and resilience.
Request a grid or utility assessment early. The IEA identifies connection costs and lead times as barriers, and excludes grid connection cost from some comparative analysis because it varies widely by site.[5] A project with attractive equipment economics can fail if connection capital or timing is ignored.
Value existing spare capacity. Energy-efficiency improvements, closed production lines or onsite generation may have created headroom. Confirm contractual and physical availability. A nameplate transformer margin does not prove that the utility will permit the new load.
12. Model the electricity tariff
Apply the heat-pump load to the actual electricity tariff. Include energy, demand, capacity, network, losses, taxes, renewable charges, minimum bills and power-factor penalties. Use interval prices where the plant can respond to time-varying rates.
Separate the electricity-to-fuel price ratio from coefficient of performance. A simple operating breakeven occurs when the electricity price divided by coefficient of performance is lower than the fuel price divided by boiler efficiency, after adding carbon and variable operating costs. The full investment test also includes capital, grid works, maintenance and residual value.
Model tariff reform and procurement. Fixed supply, indexed contracts, onsite generation, power purchase agreements and wholesale exposure change price and basis risk. Record which cost components each contract covers.
13. Model the displaced fuel correctly
Use delivered fuel cost at the site, including transport, taxes, demand or reservation, and carbon where applicable. Apply measured boiler efficiency at relevant load. A boiler operating at low load may perform differently from its rated efficiency.
Identify fixed fuel costs that remain. A retained gas connection, minimum purchase, inspection programme or backup boiler can continue after fuel use falls. Treat these as residual cost rather than avoided savings.
Run fuel-price scenarios with transparent sources and dates. The investment may hedge fuel volatility by shifting exposure to electricity. That transfer has value only when electricity procurement and grid charges are also modelled. Avoid claiming diversification without showing the correlation and downside cash flow.
14. Add thermal storage where it serves a defined purpose
Thermal storage can separate heat production from heat consumption, reduce peak electrical demand, absorb low-price electricity, support batch operation and improve resilience. Specify energy capacity, charge and discharge rate, temperature, losses, cycle life and footprint.
Optimise storage with the heat pump rather than adding it as a generic sustainability measure. Storage can allow a smaller heat pump to meet short peaks. It can also require additional output and capital that reduce project returns.
Model dispatch against tariff and production constraints. The IEA describes thermal storage as one route for capturing heat during low-price periods and using it later.[5] Confirm that the site can forecast prices, control equipment and preserve product requirements.
15. Value simultaneous cooling
Many industrial heat pumps recover energy from refrigeration or cooling systems. The project can deliver useful heat while reducing condenser or cooling-tower load. The valuation should include avoided cooling electricity, water, chemicals and maintenance where these savings are supported by the design.
Define the cooling counterfactual. A refrigeration plant may still need to operate at the same compressor load because the recovered stream lies elsewhere. An avoided chiller expansion should appear only when the heat-pump project demonstrably provides the required cooling service.
Allocate capital and benefits consistently. If the heat pump serves both heat and cooling, avoid charging all capital to one service while crediting both. Present a combined project cash flow and a transparent allocation for product or business-unit decisions.
16. Food and beverage applications
Food and beverage plants commonly require hot water, washing, pasteurisation, drying, concentration, blanching and other controlled low-temperature services. DOE's industrial electrification booklet lists these applications and emphasises consistent temperature control.[2] Refrigeration loads can provide a useful source at the same site.
Map hygiene and product constraints. Heat exchangers may need double-wall separation, food-grade materials, clean-in-place compatibility and validated hold temperatures. Record the cost and duration of qualification.
Value seasonal throughput and batch timing. A plant that processes crops for part of the year may have high utilisation during a campaign and low annual utilisation. Size and financing should reflect the real operating season. Consider modular or shared systems where expansion and product mix remain uncertain.
17. Chemicals and pharmaceutical applications
Chemical sites can have multiple temperature levels, continuous processes, hazardous areas and strict change controls. Potential sinks include hot water, low-pressure steam, distillation support, drying and reactor heating within the achievable range. Potential sources include cooling water and process effluent.
Review material compatibility, hazardous-area classification, refrigerant safety and contamination paths. A small change in temperature or pressure can affect reaction, separation or product quality. Pilot or staged commissioning may be required.
Coordinate heat integration with process safety. Define relief, isolation and emergency shutdown. Include management-of-change, validation and regulatory documentation in the project schedule. The value model should include the time and owner resources required for approval.
18. Textile applications
Textile plants use hot water and steam in washing, dyeing, finishing and drying. Wastewater can contain recoverable heat while also carrying fibres, chemicals and variable flow. Source treatment and exchanger cleaning therefore influence reliability.
Match the project to product recipes and batch sequence. Averages can hide short peaks and temperature changes. Storage may smooth demand, and heat recovery can reduce both heating and effluent-cooling requirements.
Assess water and discharge benefits separately. A heat-pump project may support water reuse or lower effluent temperature, subject to treatment design. Include only measured savings and approved discharge consequences. Preserve a separate case for production growth so efficiency is not confused with lower output.
19. Paper and wood-product applications
Paper production combines drying, evaporation, hot water and large recoverable thermal streams. Heat pumps can upgrade low-grade heat for process use where temperatures and integration permit. Continuous operation can support high utilisation.
Model moisture, fouling and corrosion. Source quality can change with grade and production conditions. Require performance guarantees across the operating range and include cleaning access.
Coordinate with steam-system optimisation. Mechanical vapour recompression may be relevant where evaporation produces vapour. A closed-cycle heat pump may serve another sink. Compare complete system options rather than applying one technology to every duty.
20. Other manufacturing applications
Electronics, automotive, engineering and consumer-goods plants often have common low-temperature demands for washing, surface treatment, drying, HVAC and water heating. These loads can be dispersed and may lack an obvious central heat source.
Cluster opportunities by location and schedule. A central heat network can reduce equipment count while increasing distribution cost and temperature. Local systems can lower losses and isolate production risk. Model both before fixing architecture.
Use portfolio templates for repeatable duties while retaining site engineering. Standard metering, procurement, cyber controls and maintenance can reduce programme cost. Temperature, utility tariff and grid capacity remain site-specific.
21. Build the complete capital budget
Separate equipment, integration and owner costs. Equipment includes compressors, exchangers, vessels, drives and controls. Integration includes piping, electrical distribution, source capture, storage, civil works, safety systems and connection. Owner costs include engineering, permits, project management, training, validation, insurance and commissioning.
Add production impact. Tie-in and qualification can reduce output or require inventory build. Value the contribution margin at risk and mitigation cost. Do not hide shutdown cost in a general contingency.
Use stage-appropriate contingency. Early estimates should reflect design maturity, source quality, grid scope and construction interface. Reduce contingency only as evidence improves. Preserve escalation and currency assumptions with dates.
22. Model operating and maintenance cost
Include electricity, water, chemicals, routine maintenance, refrigerant management, inspection, software, remote monitoring and specialist service. Deduct fuel, boiler maintenance, cooling, water and carbon costs only where the project avoids them.
Forecast major overhaul and component replacement. Compressor, seal, exchanger and control-system life may differ from the project horizon. Include spares and long-lead exposure.
Define staffing. A new technology can require operator and maintenance training. A service contract can transfer some risk while creating indexation and counterparty exposure. Compare total life-cycle cost under consistent availability assumptions.
23. Calculate levelised cost of useful heat
Levelised cost of heat divides the present value of capital and operating cost by the present value of useful heat delivered. State the discount rate, horizon, degradation, residual value, tax treatment and heat measurement boundary. Use the same assumptions across alternatives.
Show energy and non-energy components separately. The IEA notes that capital expenditure and energy prices are major drivers and uses an 8 to 12 per cent weighted-average cost of capital range in a comparative illustration.[5] A project should use its own financing and risk evidence.
Test coefficient of performance, utilisation, electricity price, fuel price, grid capital and production downtime. Present breakeven values. Decision-makers should see which assumption changes the preferred technology.
24. Build the discounted cash-flow case
Translate technical performance into after-tax cash. Include capital tranches, working capital, depreciation, tax, grants, carbon costs, maintenance, savings and residual value. Apply commissioning ramp and expected availability.
Separate contracted from merchant value. A fixed energy-service agreement, tariff or customer premium may support contracted cash. Fuel savings and flexibility revenue can remain exposed. Apply different scenarios rather than one blended certainty.
Reconcile project cash to enterprise cash. Some savings may sit in utility expense while other costs appear in maintenance, depreciation or lost production. The finance team should be able to trace every item to budgets and accounts.
25. Quantify emissions with a stated boundary
Calculate displaced fuel emissions and additional electricity emissions using defined factors and periods. State whether the electricity factor is average, marginal, contractual or location-based. Keep avoided refrigerant leakage and cooling changes separate.
Do not treat a renewable electricity certificate as physical zero-carbon supply without stating the accounting method. Preserve the distinction between contractual reporting and system emissions. Use applicable reporting standards and obtain specialist advice for formal claims.
Run future-grid scenarios. A heat pump's operating emissions can decline as electricity supply changes. The investment case should show current and forecast factors with sources. Carbon savings should not replace the cash case unless the organisation has an approved carbon price or compliance obligation.
26. Address refrigerant and safety risk
Record refrigerant type, charge, global-warming potential, flammability, toxicity, pressure, availability and service capability. Model leakage detection, ventilation, containment, recovery and end-of-life obligations.
Regulation can affect equipment availability and residual value. EU Regulation 2024/573 strengthens restrictions and the hydrofluorocarbon phase-down for refrigeration, air-conditioning and heat-pump equipment.[6] Confirm the rules for the equipment category, capacity, jurisdiction and commissioning date.
Assess alternatives with the complete system. A low-global-warming-potential refrigerant can require different safety measures or equipment. Include training, certification and site classification. Avoid assuming regulatory compliance from a vendor description.
27. Separate policy support from underlying economics
List grants, tax credits, accelerated depreciation, carbon contracts, auctions and concessional finance. Record eligibility, approval, payment timing, conditions, clawback and interaction with other support. The IEA identifies loans, subsidies and tax credits as measures that can address upfront-cost barriers.[5]
Present gross economics, support and net economics. A project should remain understandable if support is delayed or denied. Avoid counting a grant before award or treating a policy proposal as enacted.
Align support milestones with procurement and financing. Some programmes require approval before commitment. Others reimburse after commissioning. Include bridge liquidity and compliance cost.
28. Design the financing structure
Match financing to the asset, counterparty and cash-flow certainty. Corporate balance-sheet funding may suit a site-specific retrofit. Equipment finance can fund identifiable assets. Project finance or an energy-service structure needs contracted payments, performance allocation and access rights.
Define security and step-in. A heat pump integrated into a plant may have low removal value and depend on the host process. Lenders should underwrite host credit, operating rights, grid supply, maintenance and termination compensation.
Size debt to downside cash. Apply commissioning delay, lower coefficient of performance, electricity-price increase, fuel-price decline and production interruption. Include major maintenance and reserve accounts where appropriate.
29. Evaluate heat as a service
Under a heat-service model, a provider finances, owns or operates equipment and sells useful heat. The model can reduce host capital and transfer performance obligations. It also creates a long-term dependency on the provider and contract.
Define the meter, tariff, index, minimum purchase, availability, heat quality, outages, change in production and termination. Allocate electricity and fuel procurement. State who retains flexibility, carbon and cooling value.
Assess accounting, tax, control and consolidation with advisers. Compare the service contract with ownership using the same heat demand and risk boundary. A lower upfront payment can carry a higher present value or restrictive minimum volume.
30. Connect project economics to asset valuation
The heat-pump investment can affect operating cost, maintenance, production capacity, resilience, emissions liabilities and capital intensity. Value each effect through supported cash flows. Avoid applying an unsupported valuation multiple to estimated savings.
Identify the cash-generating unit. IAS 36 requires recoverable amount to be assessed for assets or the smallest group that generates largely independent cash inflows when individual value in use cannot be determined.[7] A process-heat system often supports a broader production unit rather than generating independent revenue.
Test stranded conventional assets. Boiler, fuel infrastructure and cooling equipment may remain as backup, be retired or become impaired. Apply the relevant accounting standards and obtain professional advice. Preserve the distinction between economic value and financial-statement treatment.
31. Build the enterprise-value bridge
Start with annual after-tax operating savings at steady state. Deduct recurring service cost, maintenance, residual fixed fuel cost and replacement capital. Add supported cooling savings, production benefit and flexibility revenue. Then subtract commissioning loss and incremental working capital.
Discount the cash flow at a rate consistent with the risk and financing boundary. Treat grants as separate cash flows. Use a terminal assumption supported by equipment life, site life and residual obligations. Avoid capitalising savings beyond the period in which the source and sink remain available.
Present a bridge from technical case to value. Management should see how heat delivered, coefficient of performance, tariff, uptime and capital become net present value. This allows engineers, finance and the board to challenge the same assumptions.
32. Diligence electrification in an acquisition
An acquirer should review the target's heat inventory, equipment condition, tariffs, grid capacity, environmental obligations and capital plan. Verify whether announced electrification projects have studies, permits, quotations and approved funding.
Normalise earnings. Fuel savings from a completed project may be partly reflected in current results. Future savings may require capital, downtime and new electricity cost. Avoid adding the same benefit to both forecast earnings and a separate synergy value.
Review change-of-control provisions in grants, utility contracts, service agreements and permits. Identify obsolete refrigerants and deferred boiler maintenance. Use findings in valuation, warranties, indemnities and post-close capital planning.
33. Sequence a portfolio programme
Rank individual heat duties by temperature, source match, utilisation, grid readiness, economics and execution risk. Begin with projects that generate measured operating evidence and reusable engineering. Preserve the ability to stop before committing portfolio-wide capital.
Create standard data, procurement and approval templates. A common heat map and financial model improve comparability. Site-level exceptions should remain visible rather than forced into a standard score.
Coordinate with boiler replacement and production-investment cycles. A heat pump installed during a planned shutdown can avoid interruption. A site scheduled for disposal or major reconfiguration may require a shorter horizon or contractual solution.
34. Use data and controls to protect value
Install meters for source temperature, sink temperature, flow, electrical input, thermal output and availability. Connect data to production context so performance can be normalised. Define data ownership, cybersecurity and retention.
Use controls to optimise set points, load sharing, storage and tariff response within production constraints. AI-enabled forecasting may support electricity-price and heat-demand prediction, as the IEA notes in its discussion of flexible industrial heat.[5] Validate recommendations against safe operating limits.
Keep a manual and safe fallback. A control-system failure should not compromise product quality or process safety. Record overrides and reconcile them to performance guarantees.
35. Plan measurement and verification
Agree the baseline, adjustment variables, meter standards, calculation method and reporting period before commissioning. Define treatment of production volume, product mix, weather, fuel quality and outages. Assign responsibility for meter calibration and data gaps.
Measure useful heat and electricity on the agreed boundary. Reconcile avoided fuel using boiler performance and residual consumption. Verify cooling and water benefits separately.
Link payment, warranty and internal accountability to the same measurement method. A performance dispute often arises because engineering, finance and the service provider use different boundaries. Preserve raw data and model versions for independent review.
36. Allocate construction and commissioning risk
Use clear interface responsibilities across equipment supplier, engineering contractor, electrical contractor, utility, process owner and operator. One party should own integrated performance or the contract should define how interface failures are resolved.
Set acceptance tests for capacity, temperature, coefficient of performance, availability, controls, noise and safety. Test at representative source and sink conditions. Define remedies, retest and liquidated damages where appropriate.
Plan ramp rather than assuming full performance on day one. Include tuning, operator training, product validation and seasonal testing. Retain capital or guarantees until acceptance evidence is complete.
37. Protect production continuity
Prepare tie-in, bypass and rollback plans. Build inventory or schedule work during planned outages. Test temporary utilities and spare parts. Include the decision authority for delaying commissioning.
Model lost contribution margin rather than revenue alone. A short outage can consume years of energy savings in a high-margin continuous process. Apply probability and severity supported by engineering and construction evidence.
Integrate the heat pump into business-continuity plans. Define fuel backup, black-start, grid interruption and cyber response. Validate that backup capacity remains available after conventional equipment is retired.
38. Procure evidence rather than promises
Issue a common request for proposal with source and sink data, operating profile, required boundary and acceptance method. Ask vendors to provide reference installations at comparable temperature, capacity, refrigerant and application.
Require a component and performance schedule. Capture guaranteed thermal output, electrical input, turndown, availability, refrigerant, auxiliaries, sound, water, maintenance, controls and exclusions. Reconcile every bid to the same capital and operating boundary.
Evaluate balance-sheet strength, service coverage, spare parts and warranty security. A lower equipment price may carry greater completion or lifecycle risk. Record assumptions and deviations in the approval paper.
39. Apply scenario analysis
Build central, downside and severe cases. Change coefficient of performance, utilisation, electricity tariff, fuel price, grid capital, commissioning date, production loss, maintenance and support. Preserve correlations, including a high-electricity-price case with greater grid charges.
Calculate breakeven electricity-to-fuel price ratio, minimum utilisation and maximum integration capital. Show cash, covenant and liquidity effects by year. A project can remain positive in present value while creating an unacceptable near-term funding need.
Use decision trees where evidence arrives in stages. A metering phase, engineering phase and pilot can each reduce uncertainty before larger capital is committed. Value information when the next decision can change.
40. Set decision rights and change control
Assign owners for heat data, process design, grid, procurement, finance, safety, production and reporting. Define who approves baseline changes, contingency use and commercial deviations. Record conflicts between production availability and energy optimisation.
Maintain an assumption register with source, date, owner and range. Link the model to quotations, tariffs, studies and meter data. Mark management estimates clearly inside the approval materials.
Require reapproval after material changes in source temperature, sink requirement, grid cost, tariff, project capital, support, production plan or refrigerant. Preserve prior cases so the board can see why value changed.
41. Use a stage-gated implementation roadmap
Begin with metering and a heat balance. Advance selected duties to concept engineering, grid assessment and commercial screening. Complete front-end engineering, procurement strategy, safety review and financing before final investment approval.
Use conditional commitments during development. Equipment reservations, engineering orders and site works should have defined caps and exit points. Avoid exposing the full programme before critical integration and grid risks are resolved.
After commissioning, compare measured heat, electricity, fuel, cooling and production effects with the approved case. Update portfolio assumptions. Scale only where operating evidence supports the next investment.
42. Conclusion
Industrial heat-pump value is created by the combination of a stable heat source, an appropriate heat sink, modest temperature lift, high utilisation, dependable electricity, disciplined integration and measured performance. Equipment efficiency matters, but it does not complete the investment case.
Management should start with process evidence, reduce avoidable heat demand, rank individual duties and commit capital in stages. The financial model should value useful heat, cooling and production effects on one consistent boundary. Grid works, downtime, refrigerant obligations and retained backup belong in the same case.
The result is an auditable decision framework. It allows owners, investors and lenders to separate commercially mature projects from promising technical ideas, protect production during implementation and scale electrification where measured economics support it.
Decision exhibits
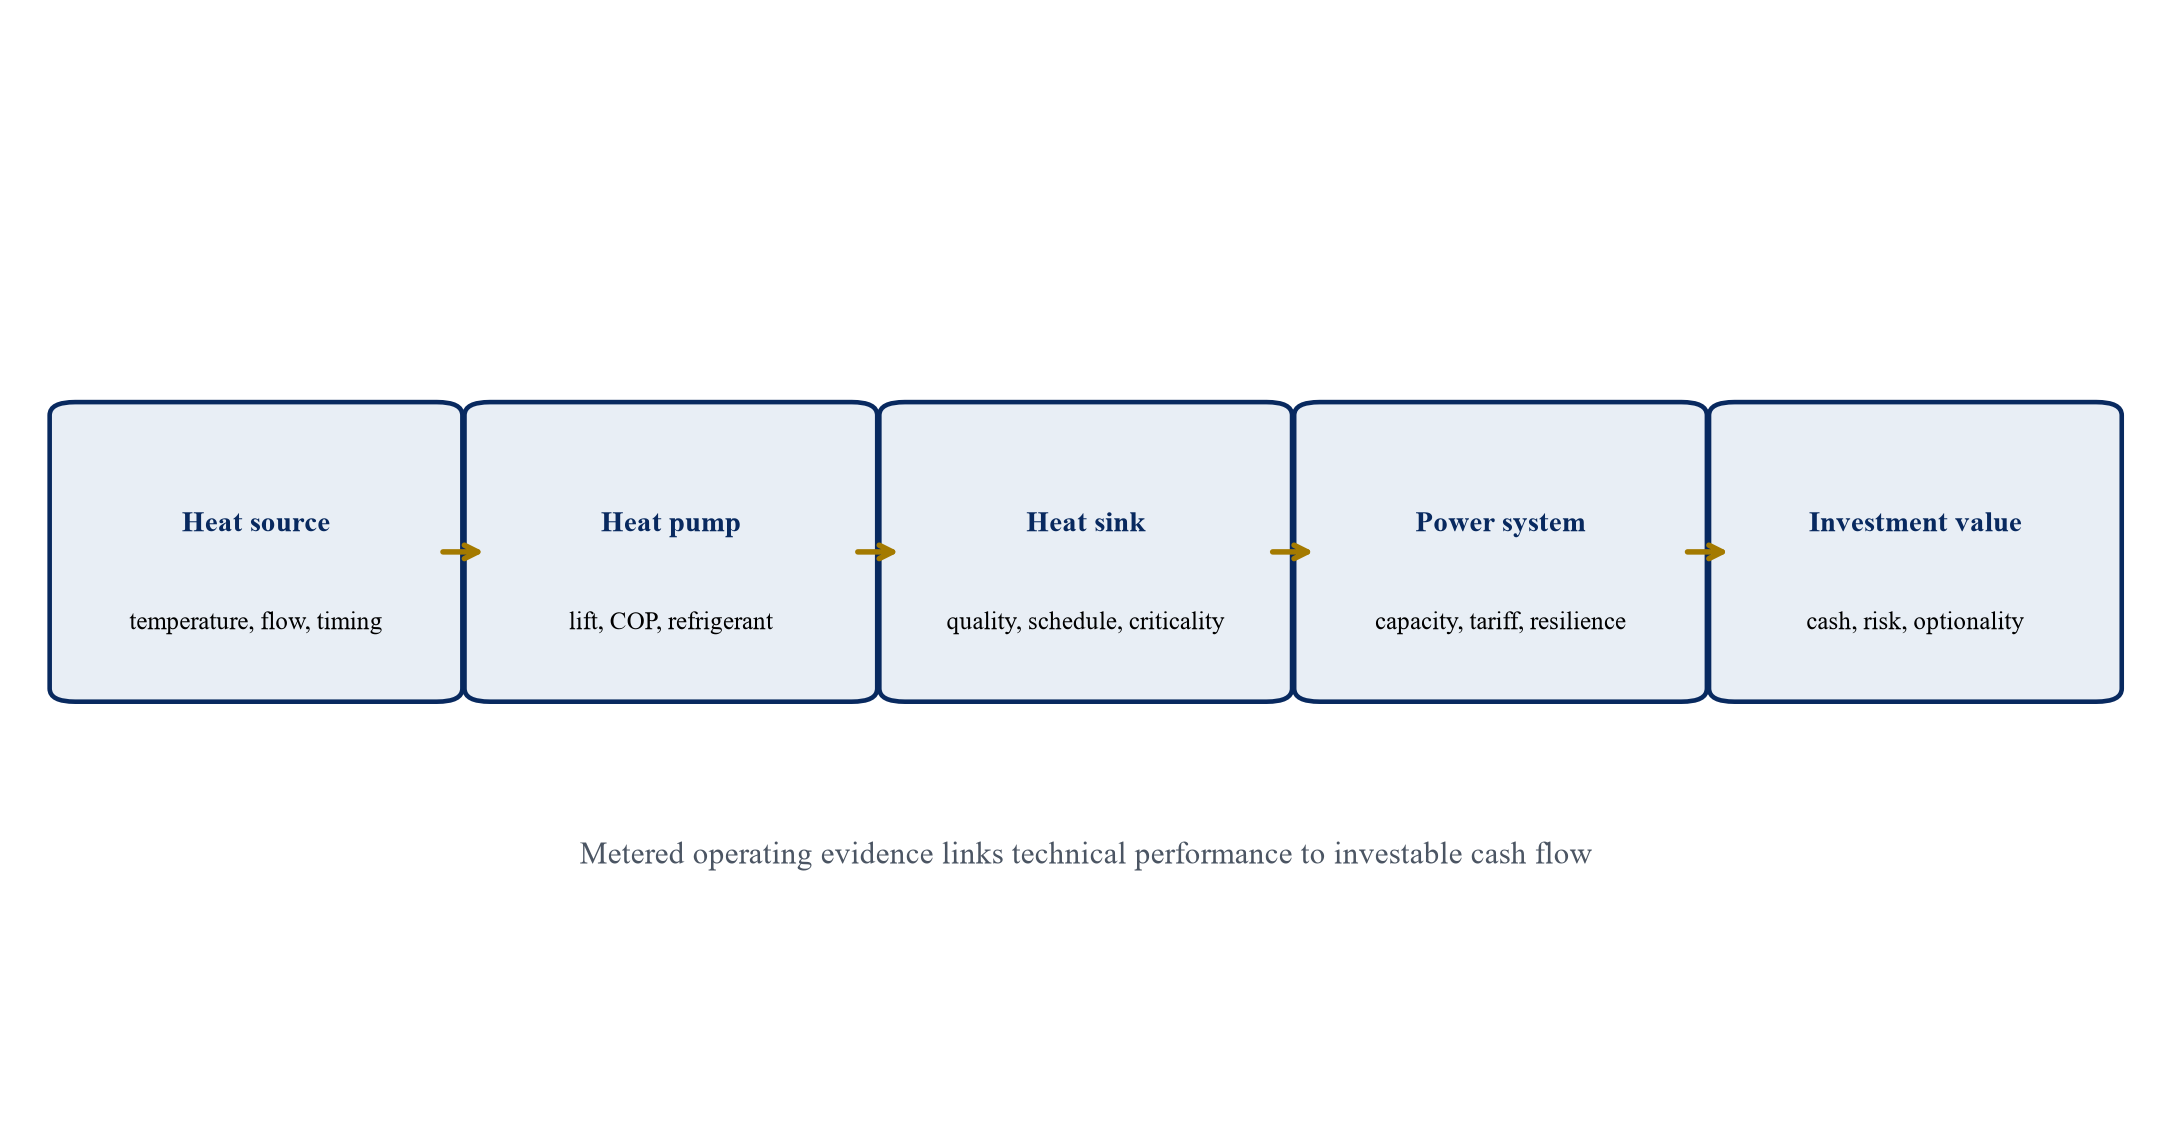
Proposed decision architecture based on the sources and analysis in this paper.
Table 1. Process-heat screening matrix
| Sector | Candidate heat duties | Evidence to collect | Principal integration issue |
|---|---|---|---|
| Food and beverage | hot water, washing, pasteurisation, drying | batch profile, hygiene, refrigeration heat | product validation and seasonality |
| Chemicals and pharmaceuticals | hot water, low-pressure steam, drying, jackets | temperature control, materials, hazardous area | process safety and change control |
| Textiles | washing, dyeing, finishing, drying | recipe sequence, wastewater heat, fouling | batch peaks and exchanger cleaning |
| Paper and wood products | drying, evaporation, hot water | vapour, moisture, continuous load | source quality and steam integration |
| General manufacturing | washing, surface treatment, HVAC, water heating | dispersed loads, distance, schedules | aggregation and distribution loss |
Indicative screening categories; site engineering and product requirements control.
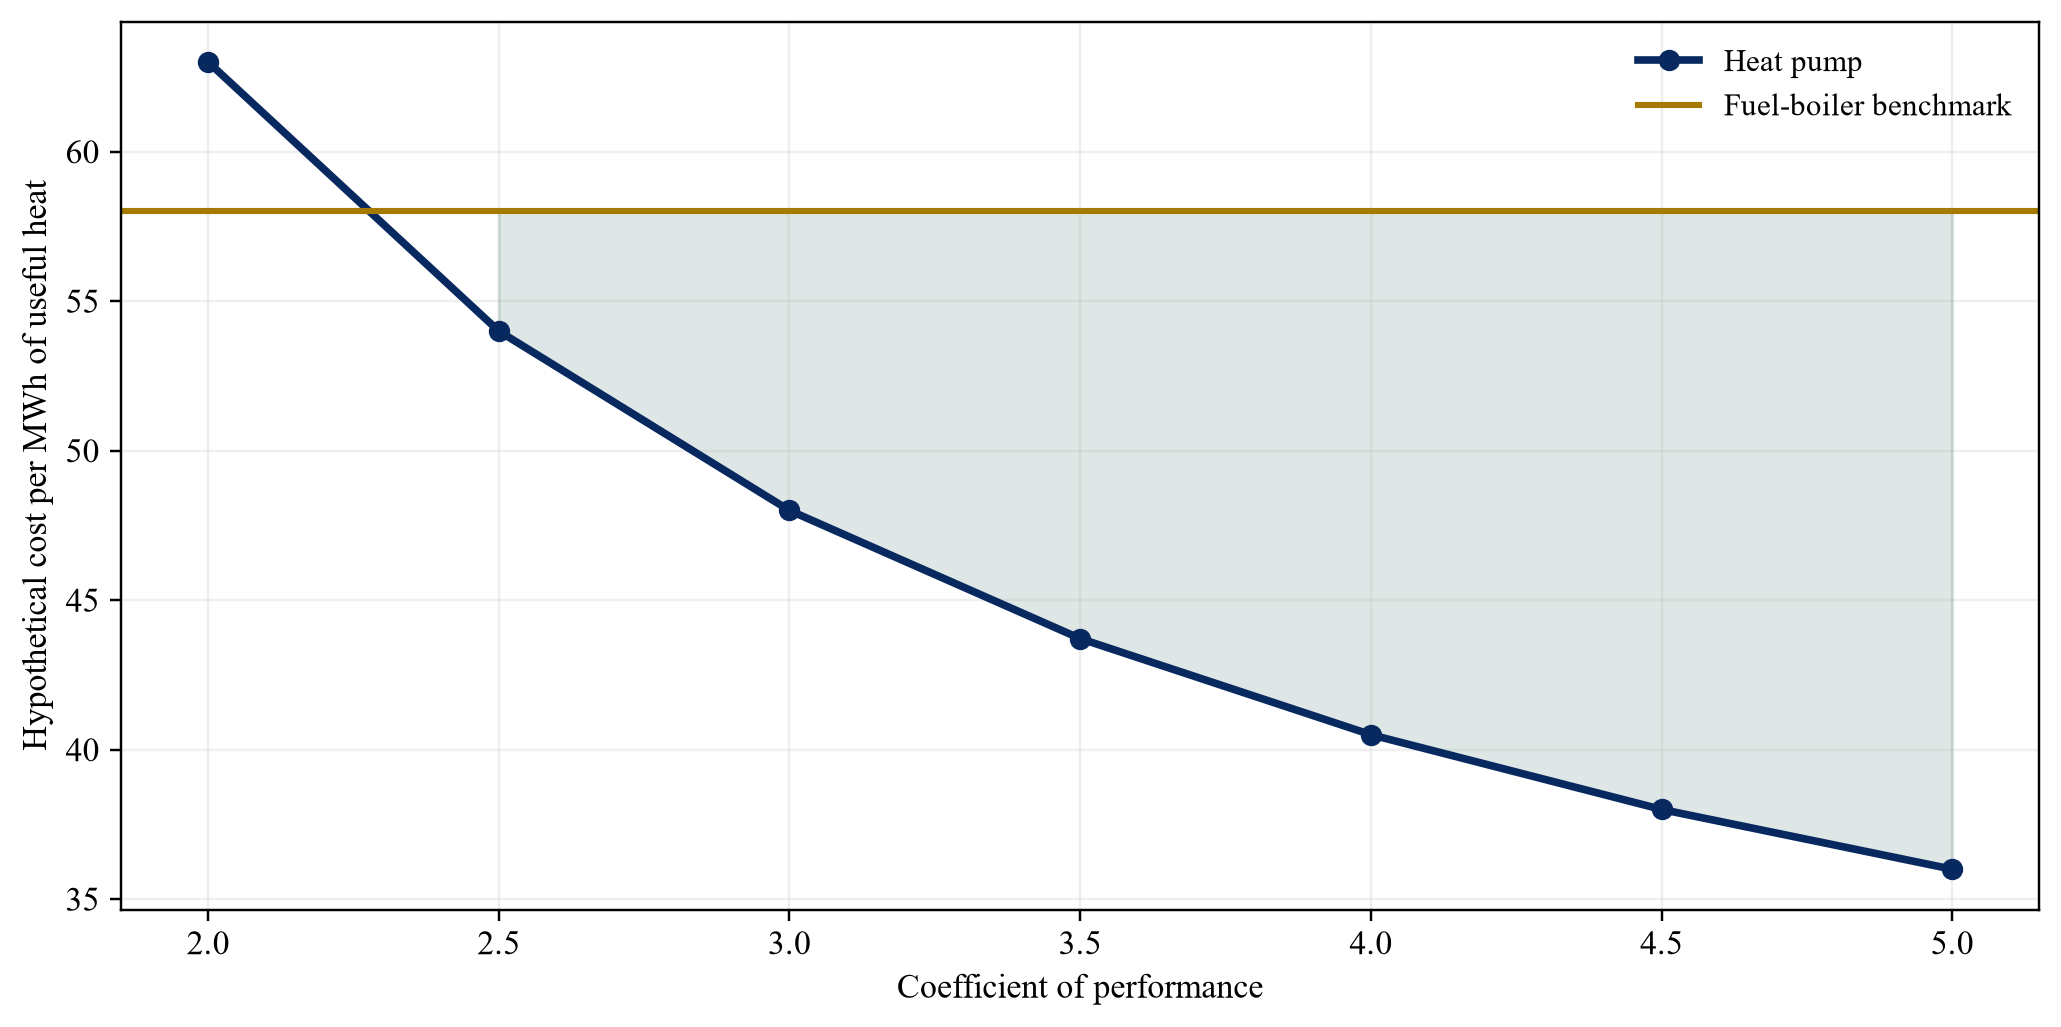
Wholly hypothetical; assumes electricity at 90 currency units per MWh, fixed non-energy cost of 18, and fuel-boiler benchmark of 58.
Table 2. Valuation risk and response matrix
| Exposure | Valuation effect | Evidence | Response |
|---|---|---|---|
| Temperature lift | changes electricity use and capacity | measured source and sink profile | reduce sink temperature and guarantee performance map |
| Utilisation | changes heat delivered per unit of capital | production schedule and load duration | size base load and stage capacity |
| Grid scope | adds capital and delay | utility study and site electrical audit | secure capacity before final commitment |
| Production tie-in | creates lost margin and completion risk | outage plan and interface design | bypass, inventory and acceptance plan |
| Tariff | changes operating savings | interval tariff and procurement terms | scenario model, storage and pass-through |
| Refrigerant | affects compliance and residual value | regulation, design and service capability | approved refrigerant strategy and lifecycle plan |
Proposed framework unless stated otherwise.
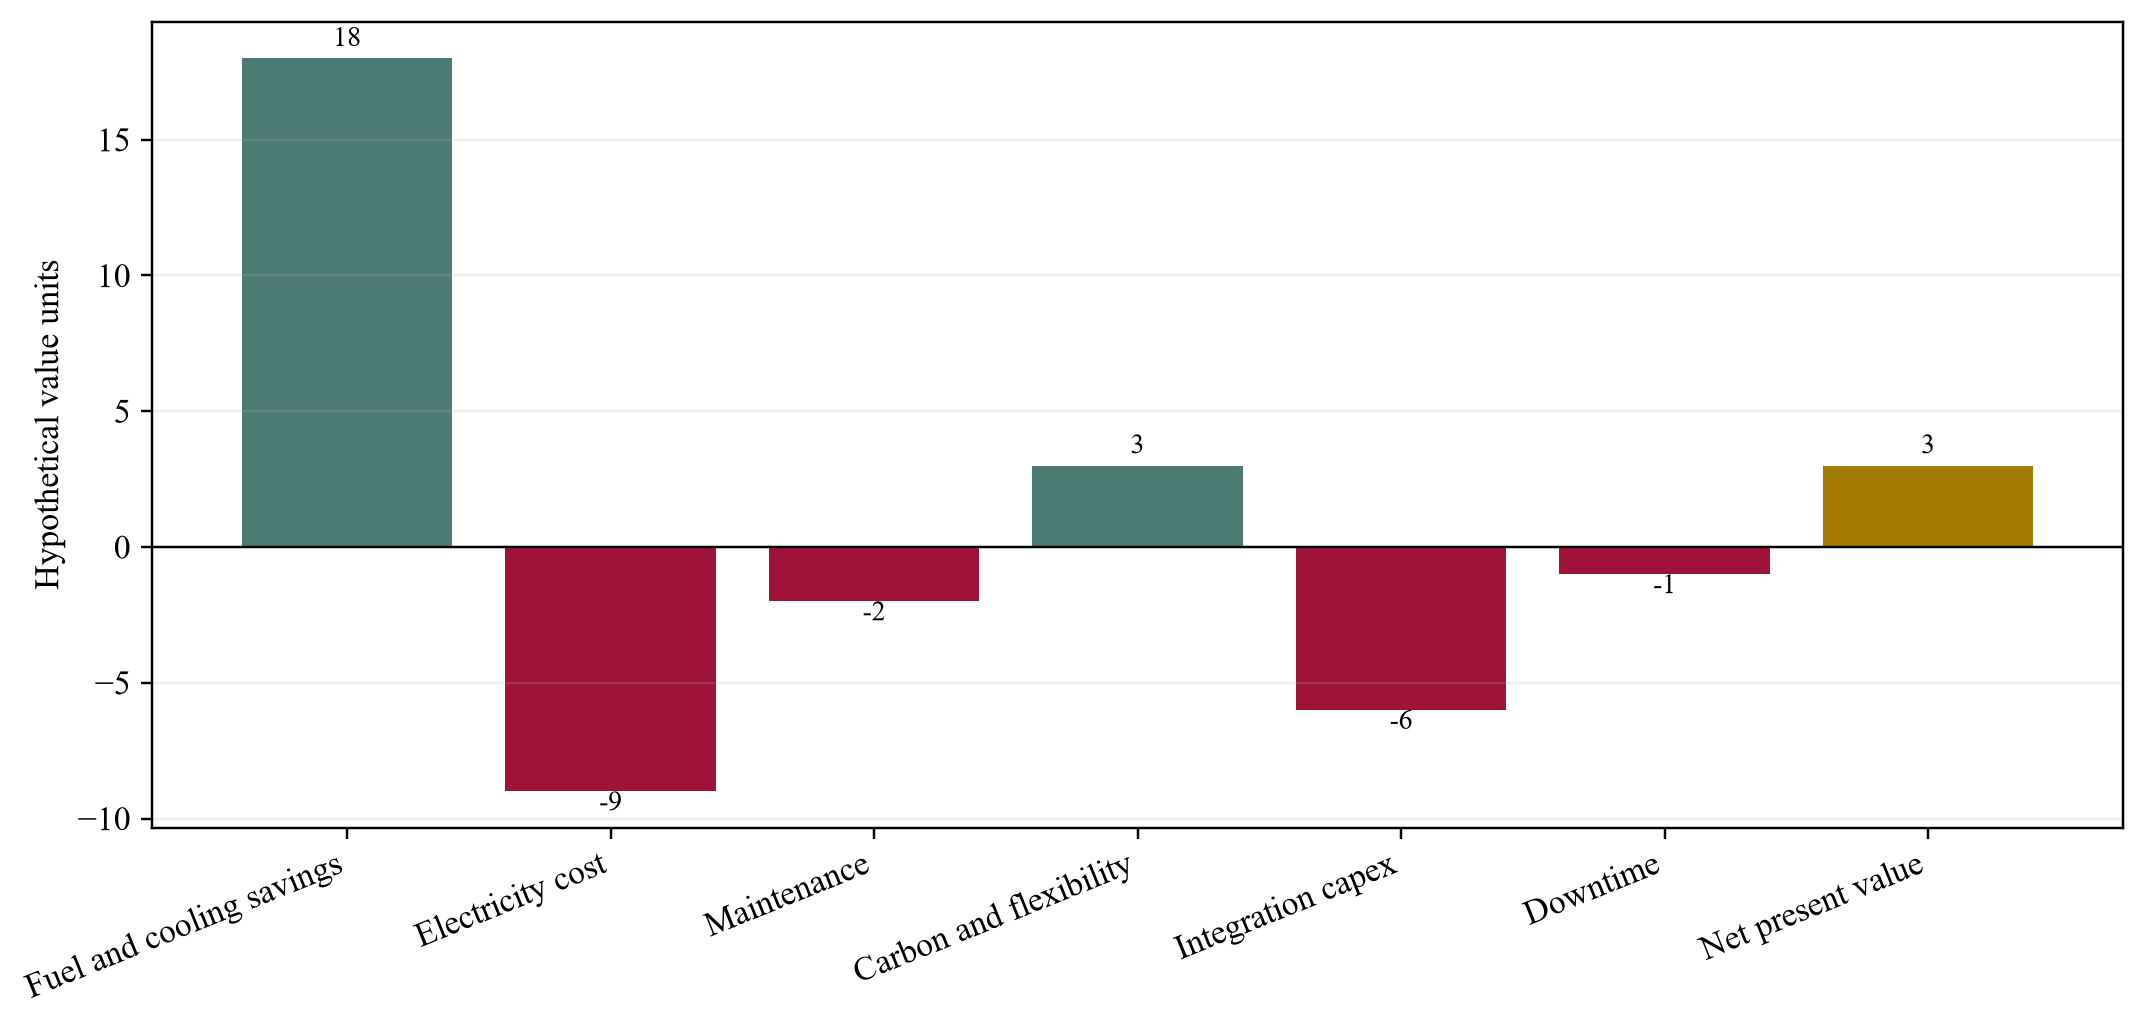
Wholly hypothetical; values describe no identified company or project.
Table 3. Hypothetical investment gates
| Gate | Evidence required | Maximum new capital at risk | Decision |
|---|---|---|---|
| Heat screen | reconciled source, sink and baseline | 0.2% of expected project cost | select duties |
| Concept design | performance map, grid screen and budget | 1.5% | approve front-end engineering |
| Front-end engineering | utility scope, safety, execution and bids | 6% | approve conditional procurement |
| Final investment | executed contracts, financing and outage plan | 100% | build and commission |
| Acceptance | measured output, input, availability and product quality | retained payment | accept or require remedies |
| Portfolio scale | operating history and updated economics | next site budget | replicate, redesign or stop |
All amounts and outcomes are illustrative and describe no identified project.
Appendix A Questions for the investment committee
1. Which useful heat service is being valued, and where is its measurement boundary?
2. Which measured source and sink temperatures support the design?
3. What performance map replaces the single design-point coefficient of performance?
4. Which efficiency and direct heat-recovery measures precede equipment sizing?
5. What grid capacity, tariff and connection capital are required?
6. Which fixed fuel, backup and maintenance costs remain after conversion?
7. How are simultaneous heating and cooling benefits measured and allocated?
8. What production downtime and validation sit in the approved case?
9. Which refrigerant, safety and lifecycle obligations apply?
10. Which grants or carbon assumptions remain conditional?
11. What evidence triggers each capital commitment and reapproval?
12. How will measured operating performance update the next portfolio decision?
References
- International Energy Agency, Heat Pump Monitor 2026, Key findings, 2026. https://www.iea.org/reports/heat-pump-monitor-2026/key-findings
- United States Department of Energy, Industrial Electrification Technologies Booklet, 29 April 2025. https://betterbuildingssolutioncenter.energy.gov/resources/industrial-electrification-technologies-booklet
- International Energy Agency, Renewables for Industry: Electrification of low-temperature heat and steam, 23 December 2025. https://www.iea.org/reports/renewables-for-industry
- IEA Heat Pumping Technologies TCP, Annex 58 Task 2: Integration Concepts, 2024. https://heatpumpingtechnologies.org/project58/task-2-integration-concepts/
- International Energy Agency, Can low-temperature heat in factories be electrified competitively?, 2025. https://www.iea.org/commentaries/can-low-temperature-heat-in-factories-be-electrified-competitively
- European Commission, F-gas legislation and Regulation (EU) 2024/573, updated 22 May 2025. https://climate.ec.europa.eu/areas-action/fluorinated-greenhouse-gases/f-gas-legislation_en
- IFRS Foundation, IAS 36 Impairment of Assets, accessed 2 October 2026. https://www.ifrs.org/issued-standards/list-of-standards/ias-36-impairment-of-assets/
- United States Department of Energy, Industrial Technologies Energy Earthshots and Industrial Heat Shot, accessed 2 October 2026. https://www.energy.gov/industrial-technologies/industrial-technologies-energy-earthshotstm
- International Energy Agency, Renewables 2023: Heat, 2024. https://www.iea.org/reports/renewables-2023/heat
- International Renewable Energy Agency, Innovation landscape for smart electrification: Decarbonising end-use sectors, 2023. https://www.irena.org/Publications/2023/Jun/Innovation-landscape-for-smart-electrification
- International Valuation Standards Council, International Valuation Standards, effective 31 January 2025. https://www.ivsc.org/standards/
About the Author
Authored by Chennakeshav Adya Independent Researcher
Chennakeshav (CK) is a corporate finance and investment banking executive with 25+ years of global experience in deal origination, structuring and execution across M&A, growth capital and corporate strategy. He has led value-creation mandates for founders, corporates and funds — bridging the boardroom view to hands-on execution and close.
His career spans Morgan Stanley, HSBC, Lloyds Banking Group, EWEC, ADQ portfolio companies and Emirates Growth Fund, across TMT, real estate, fintech, deeptech, cleantech, infrastructure and energy. He has partnered with C-suite leaders, private equity and venture funds, sovereign wealth funds and family offices to finance complex fund raises and scale-up ventures, and has led M&A due diligence, post-merger integration and business-transformation initiatives to create value.
At Matchpoint Partners he is Managing Partner, leading the firm's corporate finance, M&A and capital-raising practice. He holds an MBA from London Business School, an engineering degree from VTU and a Master of Laws (LLM, in progress) from UCL London.
An active start-up mentor, CK mentors at Techstars, DIFC FinTech Hive, Startup Grind, Founder Institute and IN5, serves as Entrepreneur Mentor in Residence (EMiR) at London Business School, and judges the Entrepreneurship World Cup.
Matchpoint profile: https://www.matchpoint-partners.com/team/ck-adya.html LinkedIn: https://www.linkedin.com/in/ckadya/
