
Introduction
A substation can be physically small and economically decisive. It may serve homes, hospitals, water pumping, transport, data centres, industrial plants and new generation. A flood can disable switchgear and controls. Extreme heat can reduce equipment capacity and accelerate insulation ageing. Wildfire can damage assets, block access or require precautionary de-energisation. Wind, debris, lightning and storm surge can affect several elements at once. Restoration can take longer than the initial event because specialist equipment, transport, testing and safe re-energisation are required.
The investment decision is difficult because the benefits of hardening are mostly avoided outcomes. Replacement-cost savings capture only one part. The larger value may sit in reduced customer interruption, protected critical services, retained network capacity, faster recovery and lower exposure to regulatory penalties. Some benefits become utility cash flow. Others accrue to customers or government. The valuation therefore needs an explicit bridge from engineering performance to economic value and then to financeable revenue or risk reduction.
1 Define the service boundary
Valuation should begin with the service delivered through the site. The boundary includes the substation's incoming circuits, transformers, busbars, protection, control, communications, auxiliary power, outgoing feeders and operational dependencies. It also includes the customers and network assets affected when those functions fail.
The service definition should specify maximum safe loading, firm capacity, restoration sequence, customer groups, critical facilities and available alternate supply. A project serving a hospital district or water system may have a different consequence profile from one serving flexible industrial load. Two sites with equal replacement cost can therefore have materially different resilience value.
The analysis should also identify interdependence. Loss of electricity can interrupt water, communications and transport. Those failures can then slow electricity restoration. The value boundary should capture dependencies that are evidenced and material while avoiding broad economy-wide claims that cannot be attributed reliably.
2 Separate hazard, exposure, fragility and consequence
Four concepts should remain distinct. Hazard describes the intensity and frequency of flood, heat, fire or storm. Exposure identifies the assets and service area in the hazard footprint. Fragility estimates the probability and severity of failure at a given intensity. Consequence measures the physical, operational and economic effect of that failure.
Combining these concepts too early can hide the source of value. A site may face frequent flooding but have effective barriers and low residual fragility. Another may face lower-frequency inundation with catastrophic consequences because the control building and transformers share the same elevation. A heat-exposed transformer can remain reliable at moderate loading yet become vulnerable when peak demand and ambient temperature coincide.
The investment case should show the chain for each hazard. This provides a traceable basis for engineering review, financial sensitivity analysis and later assurance.
3 Use forward-looking hazard evidence
Historical events provide observed evidence, but asset lives and financing periods extend into changing climate conditions. The assessment should combine site records, authoritative hazard maps, engineering studies and suitable climate projections. It should document the scenario, time horizon, spatial resolution and uncertainty of each input.
The UK National Policy Statement for electricity networks requires applicants to consider flooding at vital substations, higher temperatures, storms and climate-related ground effects [1]. The International Energy Agency describes heatwaves, wildfire, cyclones and floods as material threats across electricity systems [2]. FERC Order 896 requires planning for benchmark extreme heat and cold events in the bulk-power system [3]. These frameworks support forward-looking assessment without implying that one projection is certain.
The valuation should use several hazard paths. Central, severe and stress cases are more credible than a single return-period estimate. Review dates allow the project to adapt as evidence improves.
4 Map the substation failure chain
A hazard creates value loss through an operational sequence. Floodwater may first block access, then affect auxiliary systems, control panels and primary equipment. Heat can reduce rating, increase cooling demand and accelerate degradation. Wildfire can cause direct damage, smoke contamination, loss of communications or planned shutdown. Storms can damage incoming circuits, site structures and remote dependencies.
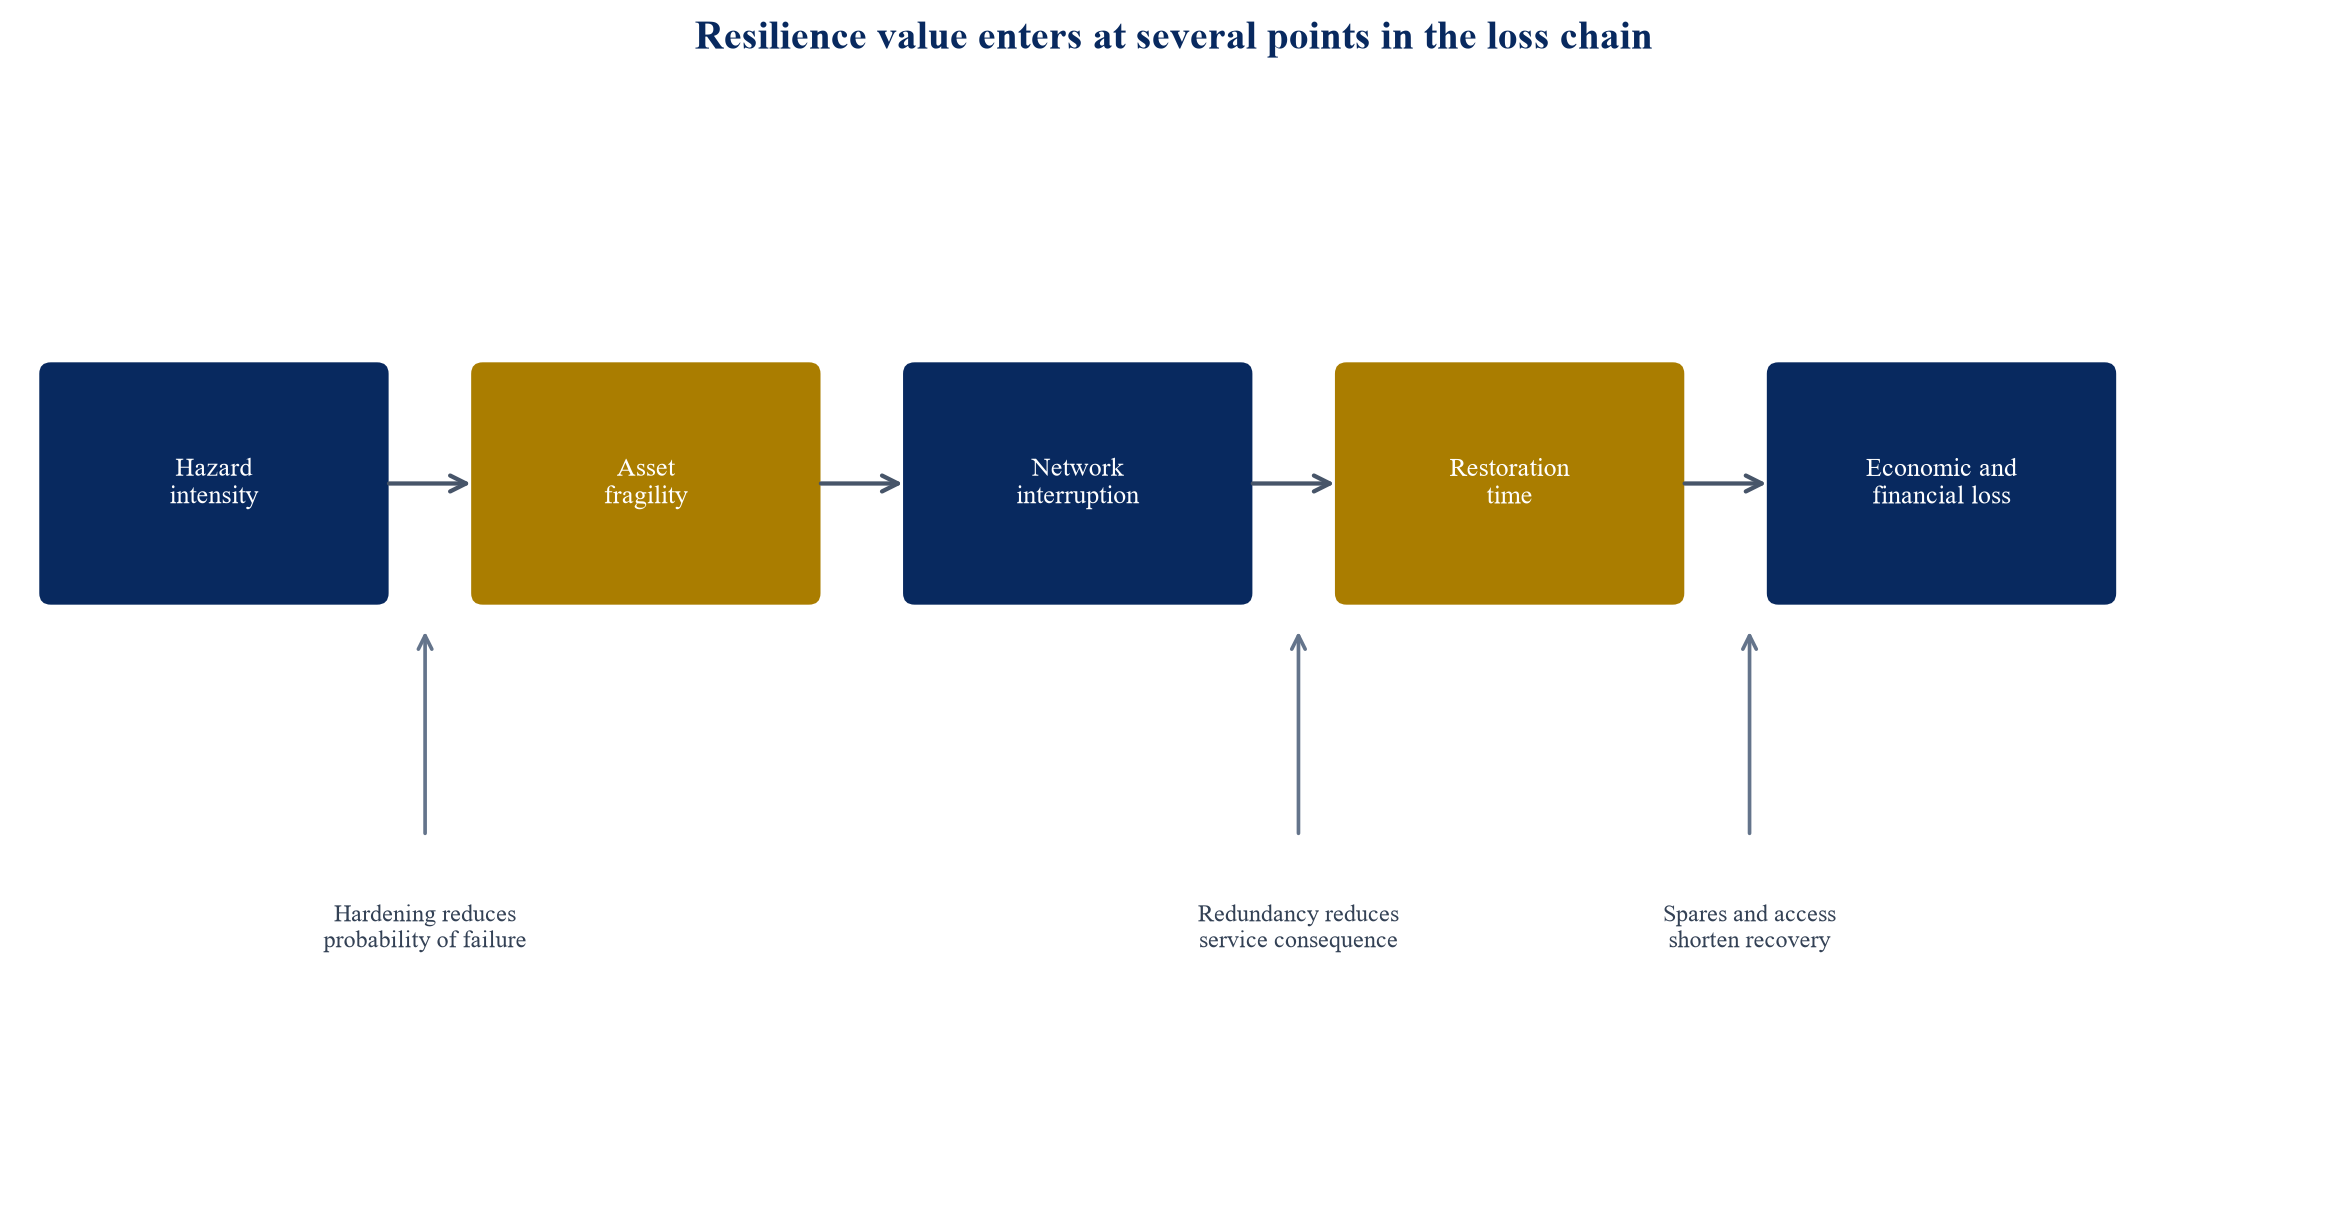
The diagram is an author-developed framework. It does not describe a specific substation or forecast a loss.
This chain identifies where each intervention acts. Barriers reduce flood entry. Elevated controls reduce fragility. Alternate feeds reduce interrupted load. Mobile transformers and pre-arranged access reduce restoration time. The valuation should avoid claiming the same benefit twice when measures overlap.
5 Establish the baseline condition
The counterfactual should describe the site without the proposed investment. It should include present asset condition, existing protection, maintenance, loading, redundancy, operating procedures, spares, access and planned replacement. A baseline that assumes no maintenance or unlimited deterioration can overstate benefit.
The analysis should distinguish committed projects from optional proposals. If a transformer replacement is already required for age or capacity, the resilience case should value the incremental cost and benefit of the hardened specification. If relocation is part of a wider network redesign, costs and benefits should be allocated consistently.
Baseline evidence can include inspection results, outage records, flood levels, temperature logs, fire maps, protection studies and restoration exercises. Missing evidence should become a data action, sensitivity or conservative assumption. It should not be concealed inside a single score.
6 Measure fragility by component
Substations contain components with different tolerances. Transformers, bushings, breakers, batteries, control panels, communications, cables, pumps and cooling systems may fail at different thresholds. The assessment should map components to hazard intensity and recovery requirements.
DOE's 2024 Large Power Transformer Resilience report explains that ambient temperature, cooling, overload and insulation ageing interact, and that transformer replacement can be constrained by specialised manufacturing and transport [4]. DOE guidance also identifies elevation, floodwalls, drainage, submersible equipment and relocation as flood-protection measures [5].
Fragility estimates can use manufacturer data, standards, engineering judgement and observed performance. Their provenance should be recorded. Correlated failure matters because several components can share the same elevation, building, cooling system or incoming route. A component-level view supports targeted investment and reduces the tendency to replace an entire site where a smaller intervention delivers most of the value.
7 Value flood resilience
Flood valuation should consider river, coastal, surface-water, groundwater and drainage failure. It should examine depth, duration, velocity, contamination, access and the sequence in which equipment becomes unsafe or unavailable. The UK ETR 138 approach links protection levels to the significance of network sites, and Ofgem has used compliance with that approach in its price-control framework [6].
Options include perimeter barriers, equipment elevation, raised control rooms, drainage, pumps, sealed entries, submersible components, alternate access and relocation. Each option has different failure modes and maintenance needs. A barrier can transfer water elsewhere or fail if gates are not closed. Pumps need power and testing. Elevation can protect controls while leaving transformers exposed.
Benefits include avoided equipment damage, reduced cleanup, shorter outage, safer access and preserved service. The model should include residual risk after protection and the probability that several defences fail together.
8 Value extreme-heat resilience
Heat affects both capability and asset life. High ambient temperature can reduce thermal headroom, increase losses, accelerate insulation ageing and raise the probability of failure when demand is high. Cooling equipment can also fail during the period when it is most valuable.
The economic model should connect temperature and loading to available capacity, expected ageing and interruption risk. Interventions can include additional cooling, larger radiators, shade, ventilation, higher-temperature designs, transformer uprating, load transfer, dynamic monitoring and demand response. DOE notes that cooling capacity and permissible overload depend on design, operating conditions and utility risk tolerance [4].
Benefits may appear as retained firm capacity, deferred replacement, fewer emergency load transfers and longer life. A life-extension benefit should be recognised only where the engineering model supports it. Heat and flood projects can interact because enclosures and barriers may affect ventilation and access.
9 Value wildfire resilience
Wildfire can damage equipment directly, contaminate insulation, disrupt communications, block access and threaten personnel. A substation can also become part of an ignition pathway. The assessment should therefore cover both incoming fire and utility-caused fire exposure.
Measures can include vegetation treatment, defensible space, fire-resistant materials, oil containment, separation, detection, remote monitoring, alternate routes and equipment choices with lower fire consequences. Utility wildfire plans in California use risk modelling, asset inspection, vegetation management, situational awareness and operational controls as part of an integrated programme [7].
The valuation should include liability and public-safety consequences where the causal pathway is evidenced. It should distinguish direct asset protection from broader line-related wildfire programmes. Precautionary de-energisation can reduce ignition risk while imposing interruption cost. That tradeoff belongs in the service model rather than being treated as zero-cost protection.
10 Value severe-storm resilience
Storm exposure includes wind, debris, lightning, hail, ice, storm surge and loss of connected lines or communications. Substation hardening cannot prevent every upstream or downstream failure. The site should therefore be analysed inside the network restoration plan.
Measures can include stronger structures, protected control buildings, improved lightning protection, secure auxiliary power, redundant communications, drainage, spare components and alternate feeds. Portable equipment and mutual-assistance arrangements can reduce duration after damage. Their value depends on transport access, compatible connections, trained crews and realistic mobilisation time.
Storm valuation should model common-mode conditions. A spare located in the same hazard zone may be unavailable. Two alternate feeds can share a vulnerable corridor. The investment case should state which dependencies remain exposed after the project.
11 Quantify expected annual physical loss
Expected annual physical loss combines the probability distribution of hazard intensity with asset fragility and repair or replacement cost. The calculation should include emergency works, debris removal, testing, environmental remediation, expediting and temporary equipment where applicable.
For each scenario, the model estimates loss before and after the intervention. The difference is an expected benefit. Discounting converts the stream into present value. The model should also show severe percentile outcomes because expected value can understate liquidity and solvency concerns.
Repair cost should reflect current procurement evidence and escalation. Long-lead equipment may require air freight, storage or temporary configuration. Salvage, insurance and public support should be shown separately. They affect who bears the loss and when cash returns, while the underlying economic damage remains.
12 Quantify energy not served
Energy not served links physical failure to service consequence. It should be modelled by hour or operational interval, recognising demand shape, alternate supply, network switching, embedded generation, storage and customer restoration priority. Average annual reliability indicators can obscure severe, local and long-duration events.
FERC's long-term planning framework includes mitigation of extreme weather and reduced congestion during outages among measurable transmission benefits [8]. NREL identifies load not served, customers interrupted, critical services and recovery time as resilience metrics [9]. These measures can be adapted to the substation level.
The model should avoid multiplying one average outage duration by one average load where restoration is staged. Critical and commercial customers may return at different times. A restoration curve provides a more accurate basis for customer damage and operational cost.
13 Apply customer interruption values carefully
Value of lost load and customer interruption cost convert service loss into money. Values vary by customer type, timing, duration, warning, geography and ability to adapt. Berkeley Lab's guidebook recommends customer-specific methods and warns against using average reliability indicators as a direct proxy for interruption cost [10].
For a portfolio screen, the utility can use published ranges and test sensitivities. For a major investment, customer surveys, sector data and critical-service analysis may be justified. Health, safety and statutory obligations should not be reduced mechanically to one monetary value.
The valuation should state whether interruption cost is a social benefit, a regulatory incentive or a utility cash flow. Customer benefit can support approval without automatically servicing debt. Financeability requires a mechanism through tariffs, incentives, contracts or public funding.
14 Include critical-service continuity
Hospitals, water systems, transport, telecommunications and emergency services can depend on one substation or on connected sites with shared vulnerabilities. The consequence assessment should identify critical loads, backup duration, fuel dependence and restoration priority.
Backup generation can reduce short outages while providing limited protection during long disruptions. A hospital generator may depend on fuel delivery, cooling and communications. A water pumping station can have storage that delays impact. These facts should shape the restoration curve.
Critical-service value can be presented through service-hours preserved, people served, emergency capability and avoided public expenditure. Monetary estimates should use documented methods and avoid claiming benefits outside the evidenced service boundary.
15 Build the integrated valuation equation
The project value can be expressed as the discounted sum of avoided physical loss, avoided interruption cost, reduced emergency expenditure, retained capacity, deferred replacement, insurance effects and eligible regulatory incentives, less capital cost, maintenance, financing cost and residual risk.
Table 1. Resilient-substation value components and evidence requirements
| Value component | Primary measure | Evidence required | Typical beneficiary | Financeability route |
|---|---|---|---|---|
| Avoided physical damage | Expected repair and replacement cost | Hazard, fragility, asset value and repair scope | Utility or insurer | Retained cash, insurance or reserve |
| Reduced interruption | Energy not served and duration-dependent customer cost | Load, switching and restoration model | Customers and economy | Incentive, tariff or public funding |
| Retained capacity | Firm capacity available during hazard | Thermal and power-flow studies | Utility and connecting customers | Allowed revenue or connection agreement |
| Faster restoration | Hours saved and emergency cost avoided | Logistics, spares and exercise evidence | Utility and customers | Opex saving, incentive or resilience contract |
| Deferred replacement | Timing and cost of avoided renewal | Asset-health and life model | Utility and consumers | Regulatory asset base or corporate cash flow |
| Insurance effect | Retention, premium and claim timing | Executed policy and insurer terms | Utility, lenders and insurer | Premium saving and liquidity reduction |
The table is an author-developed framework. Each project requires site-specific evidence and applicable regulatory treatment.
The equation should keep economic and financial value visible. A benefit-cost ratio can support public approval. Debt capacity depends on cash available to the borrower. The bridge between them is a central investment decision.
16 Model correlated and compound events
Flood, heat, wildfire and storms can affect several sites and dependencies together. Heat may coincide with peak demand. Wildfire can coincide with high winds and constrained access. Storm surge can arrive with wind damage and communications loss. Treating each risk as independent can understate the tail.
The portfolio model should include common hazard footprints, shared equipment, mutual-assistance demand, supplier concentration and network topology. It should also avoid adding mutually exclusive event losses as if they occur together every year.
Scenario analysis can represent compound conditions without claiming precise probabilities. A severe case can test loss of the site, one alternate feed, regional access and a delayed transformer. The result informs liquidity, spares and staged investment.
17 Recognise restoration time as an asset
Resilience value often comes from shortening the outage rather than preventing every failure. Restoration time depends on damage assessment, safe access, isolation, equipment availability, transport, civil works, testing, workforce and regulatory approval.
Large transformers can have specialised manufacturing and transport requirements [4]. Mobile substations, standardised interfaces, strategic spares, pre-negotiated logistics and mutual assistance can reduce duration. Their portfolio value should be allocated across the sites they protect.
The model should use a probability distribution for restoration time and show which intervention changes it. A nominal spare provides limited value if its route, permits, foundation, connections or testing plan are incomplete.
18 Compare hardening, redundancy and relocation
Hardening lowers the probability or severity of failure at the existing site. Redundancy lowers service consequence by providing another path. Relocation changes exposure and can enable wider network redesign. These strategies have different cost, time and residual risk.
The lowest-capital option may leave a severe tail. The highest-protection option may be inefficient if alternate supply already limits customer loss. The comparison should use common service outcomes and the same baseline.
Relocation can create land, planning, connection and environmental costs. It may also release constrained land or enable capacity expansion. Those benefits should be included only where the transaction and planning evidence supports them.
19 Value modular and staged investment
Uncertainty can make a staged programme more valuable than an irreversible full build. Early actions can improve drainage, monitoring, access, controls and emergency interfaces. Later stages can elevate equipment, add redundancy or relocate if hazard evidence, demand or regulation changes.
Real-option value arises when management can defer, expand, switch or abandon a stage after receiving new information. The model should show decision dates, triggers, sunk cost and the consequences of waiting. Delay is not free where exposure remains material.
A staged plan should preserve compatibility. Temporary barriers, foundations and interfaces should support the next stage rather than create stranded work. Procurement and planning lead times can require early commitment even when construction is deferred.
20 Build a transparent scenario model
The model should separate observed inputs, engineering estimates, regulatory assumptions and author-modelled scenarios. Every input should have a unit, source, date, owner and sensitivity. Outputs should include net present value, benefit-cost ratio, expected annual loss reduction, tail loss, energy not served, restoration time and funding gap.
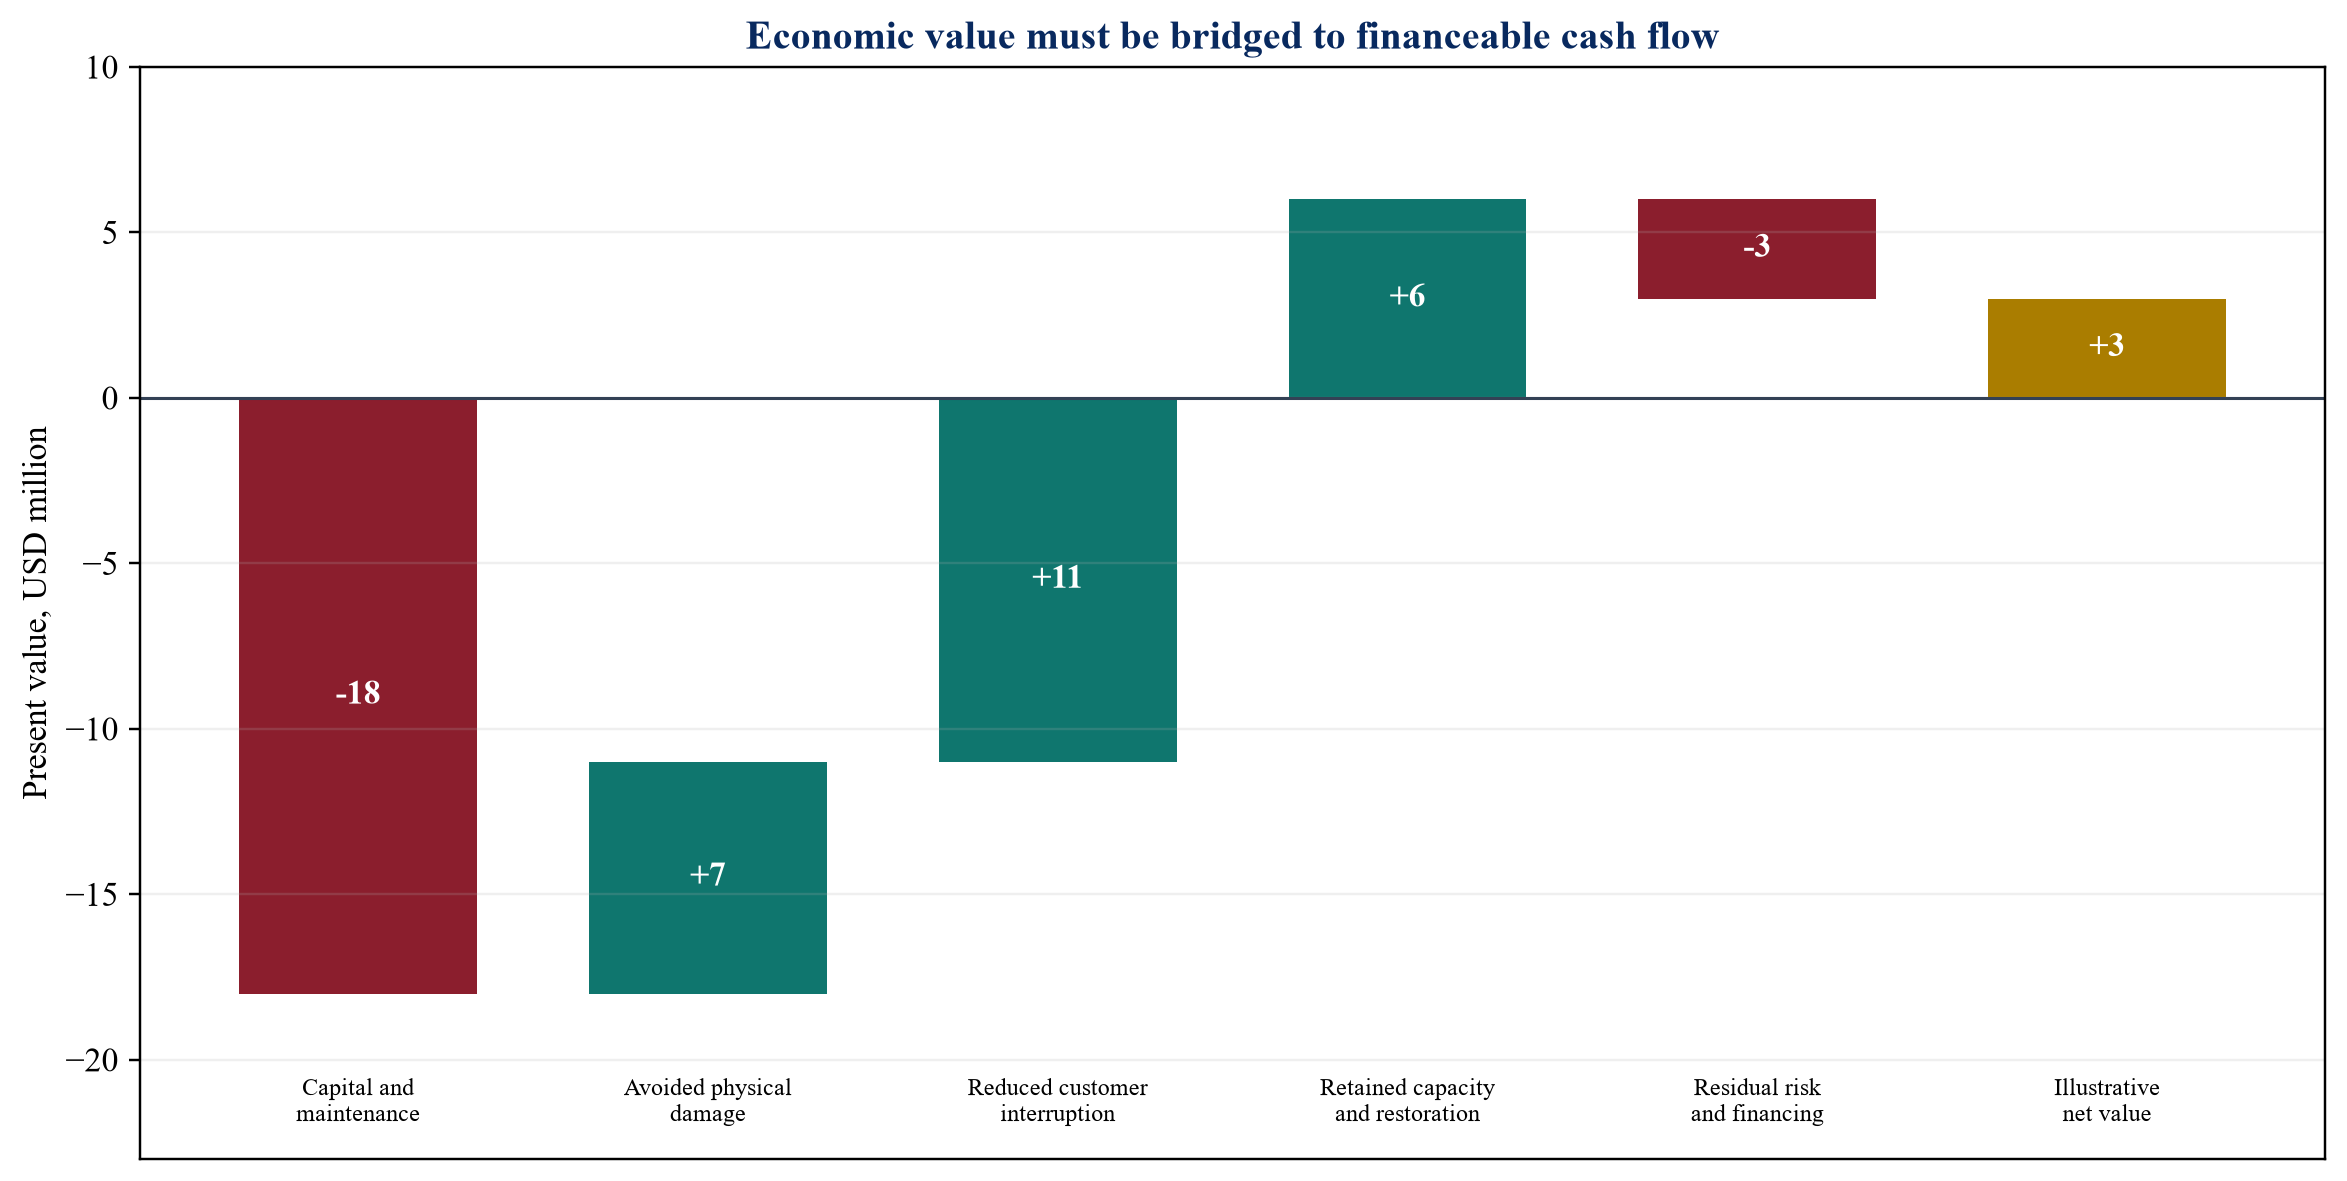
Values are hypothetical author-modelled assumptions in USD millions and do not represent a project, forecast or investment offer.
The example demonstrates the structure rather than a return target. Decision makers should receive the underlying scenario table and source register, not only the headline value.
21 Test cost and schedule risk
Substation works can require outages, specialist equipment, land access, planning consent and coordination with wider network programmes. Construction cost and schedule risk should therefore sit inside the valuation.
The model should test equipment inflation, civil-work uncertainty, outage windows, delay, contractor capacity and commissioning failure. Contingency should be linked to the maturity of scope and design. A generic percentage can be retained for screening, then replaced as evidence improves.
Delay can increase exposure and defer benefits. An accelerated project can incur premium cost. The investment committee should compare those effects explicitly.
22 Reflect regulatory treatment
Regulated utilities need a route from economic benefit to allowed revenue. The route can include capital allowances, output incentives, uncertainty mechanisms, re-openers, performance standards and prudence review. Ofgem's RIIO framework uses engineering justification and has provided funding mechanisms for climate resilience [11][12].
The case should identify which costs enter the regulated asset base, the allowed return, depreciation, efficiency challenge and timing. It should test disallowance, underspend sharing and performance penalties. A socially valuable project can remain difficult to finance if recovery is uncertain or delayed.
Regulatory engagement should begin with the evidence chain. Hazard, service consequence, option comparison and delivery plan allow the regulator to assess need and value for money.
23 Incorporate insurance without double counting
Insurance can reimburse physical damage and business interruption, subject to wording, deductibles, limits and timing. It reallocates loss and supports liquidity. It does not remove the underlying economic disruption.
The model should calculate gross loss, retained loss, expected recovery and timing separately. Premium or retention reductions can be included where supported by insurer terms. Expected claim proceeds should not be added to avoided loss from the same damage.
Hardening can improve insurability even where premium savings are modest. The utility should document protective measures, maintenance and residual exposure for underwriting and claims. The financing plan should cover the interval before recovery and the possibility of dispute.
24 Connect resilience to credit
Substation failure can reduce revenue, increase emergency expenditure, delay connections and pressure debt-service metrics. Lenders should understand the service concentration, hazard exposure, mitigation plan, insurance and liquidity.
Credit analysis should stress operating cash flow, capital overruns, claim delay, regulatory recovery and simultaneous damage elsewhere. Covenants and reserve tests may need headroom for emergency works. Project-financed assets should identify where substation availability affects contracted output or offtake.
Resilience expenditure can improve credit quality when it reduces a material, evidenced loss pathway. The case should avoid claiming a rating or pricing benefit without lender or agency evidence.
25 Select the financing structure
Funding can come from regulated revenue, corporate debt, green or resilience-linked instruments, project finance, government grants, insurance proceeds, customer contributions or public-private arrangements. The structure should follow the beneficiary and cash-flow route.
Table 2. Financing routes for resilient-substation programmes
| Route | Suitable expenditure | Cash-flow source | Principal risk | Evidence needed |
|---|---|---|---|---|
| Regulated capital allowance | Network hardening and replacement | Allowed tariff revenue | Disallowance or timing | Need case, option appraisal and delivery control |
| Corporate debt | Portfolio programme with stable utility cash flow | General utility revenue | Balance-sheet concentration | Stress-tested coverage and liquidity |
| Project finance | Dedicated connection or concession asset | Contracted or regulated project cash flow | Interface and availability risk | Direct agreement, performance regime and insurance |
| Government grant | Public resilience or critical-service benefit | Appropriated programme funding | Eligibility and milestone risk | Hazard evidence and verified public outcome |
| Customer contribution | Site-specific capacity or continuity benefit | Connection or service agreement | Benefit allocation and affordability | Contracted service and cost allocation |
| Resilience bond or labelled debt | Eligible portfolio with measurable outcomes | Utility or project cash flow | Use-of-proceeds and reporting credibility | Taxonomy, allocation register and outcome reporting |
The table is an author-developed decision framework. Availability and terms depend on jurisdiction, credit and executed arrangements.
The financing choice should not obscure asset economics. Labelled debt can broaden the investor base, while repayment still depends on cash flow and credit.
26 Allocate benefits across parties
Utilities, customers, insurers, governments and lenders receive different benefits. The utility may avoid repair cost. Customers avoid interruption. Government preserves critical services. Insurers reduce claims. Lenders reduce tail risk.
The funding plan should map each benefit to a contribution mechanism. Tariff recovery can socialise benefits across customers. A hospital or data centre may pay for dedicated redundancy. Government can fund public-service value that tariffs do not capture. Insurers may recognise verified protection in underwriting.
Allocation should follow causation and applicable law. The same benefit should not support several funding claims unless the rights and sharing rules are explicit.
27 Rank a portfolio of substations
A utility portfolio can contain hundreds of sites with different hazard, condition, capacity and consequence. Ranking should combine absolute service consequence, risk-reduction efficiency, deliverability and strategic importance.
The first screen can use hazard exposure, asset criticality, alternate supply, restoration time and critical customers. Detailed studies should then focus on high-consequence sites. Portfolio optimisation can select projects under capital, outage and workforce constraints.
Rankings should remain explainable. A complex model that cannot show why one site outranks another will be difficult to govern. The process should also prevent a few data-rich sites from displacing poorly documented sites whose uncertainty is itself material.
28 Use thresholds and decision rules
Decision rules can include mandatory safety or compliance projects, positive economic value, minimum tail-risk reduction, critical-service protection and readiness. Mandatory projects still require an efficient option and controlled delivery.
The investment committee should see both expected value and severe outcomes. A project with modest expected benefit may be justified where it removes a catastrophic single point of failure. Another with a high expected return may be deferred if the design is immature.
Thresholds should be approved before ranking where practical. This reduces the risk of tailoring assumptions to a preferred project.
29 Verify engineering and financial interfaces
Engineering models produce flood levels, thermal limits, failure probabilities, restoration paths and load flows. Financial models convert those outputs into cost, timing and funding. Interfaces should be documented and reviewed jointly.
Common errors include using nominal transformer capacity when heat reduces output, treating all interrupted load as one duration, applying asset replacement cost to a partial failure, and assuming immediate insurance recovery. A controlled interface register can identify the source, transformation and owner of each key input.
Independent review should focus on material assumptions and model logic. Review does not require duplicating every calculation. It should confirm that conclusions remain within the evidence.
30 Govern model updates
Hazard maps, load forecasts, asset condition, regulation and costs change. The valuation should have an owner, version control, approval record and scheduled refresh. Trigger events can include a major storm, observed near miss, equipment failure, new connection, insurer requirement or regulatory decision.
Observed outcomes should update fragility and restoration assumptions. If a barrier performs during a flood, the evidence should be recorded. If access or pumps fail, the model should change. Learning converts resilience spending into a better portfolio process.
Sensitive network information should be protected. Public reporting can describe governance, outcomes and aggregate investment without disclosing exploitable details.
31 Establish investment gates
The programme should move through evidence, design, funding and delivery gates. Early screening confirms service criticality and hazard. Concept selection compares hardening, redundancy and relocation. Detailed design confirms performance, interfaces and cost. Funding approval confirms revenue, financing and risk allocation.
Procurement should test supplier capacity, warranties, performance, spares and commissioning. Construction approval should confirm outage windows and emergency arrangements. Completion should require as-built evidence, testing, updated operating procedures and asset records.
A gate should have acceptance criteria and a named decision maker. Conditional approval should record the unresolved item, owner and date.
32 Implement a 180-day valuation programme
Days 1 to 30 should confirm service boundaries, hazards, asset condition and critical customers. Days 31 to 60 should develop fragility, network consequence and restoration scenarios. Days 61 to 90 should quantify physical loss, interruption, capacity and public-service value.
Days 91 to 120 should compare interventions, cost, regulatory treatment and funding. Days 121 to 150 should complete assurance, stakeholder review and procurement strategy. Days 151 to 180 should approve the portfolio, financing plan, delivery gates and reporting.
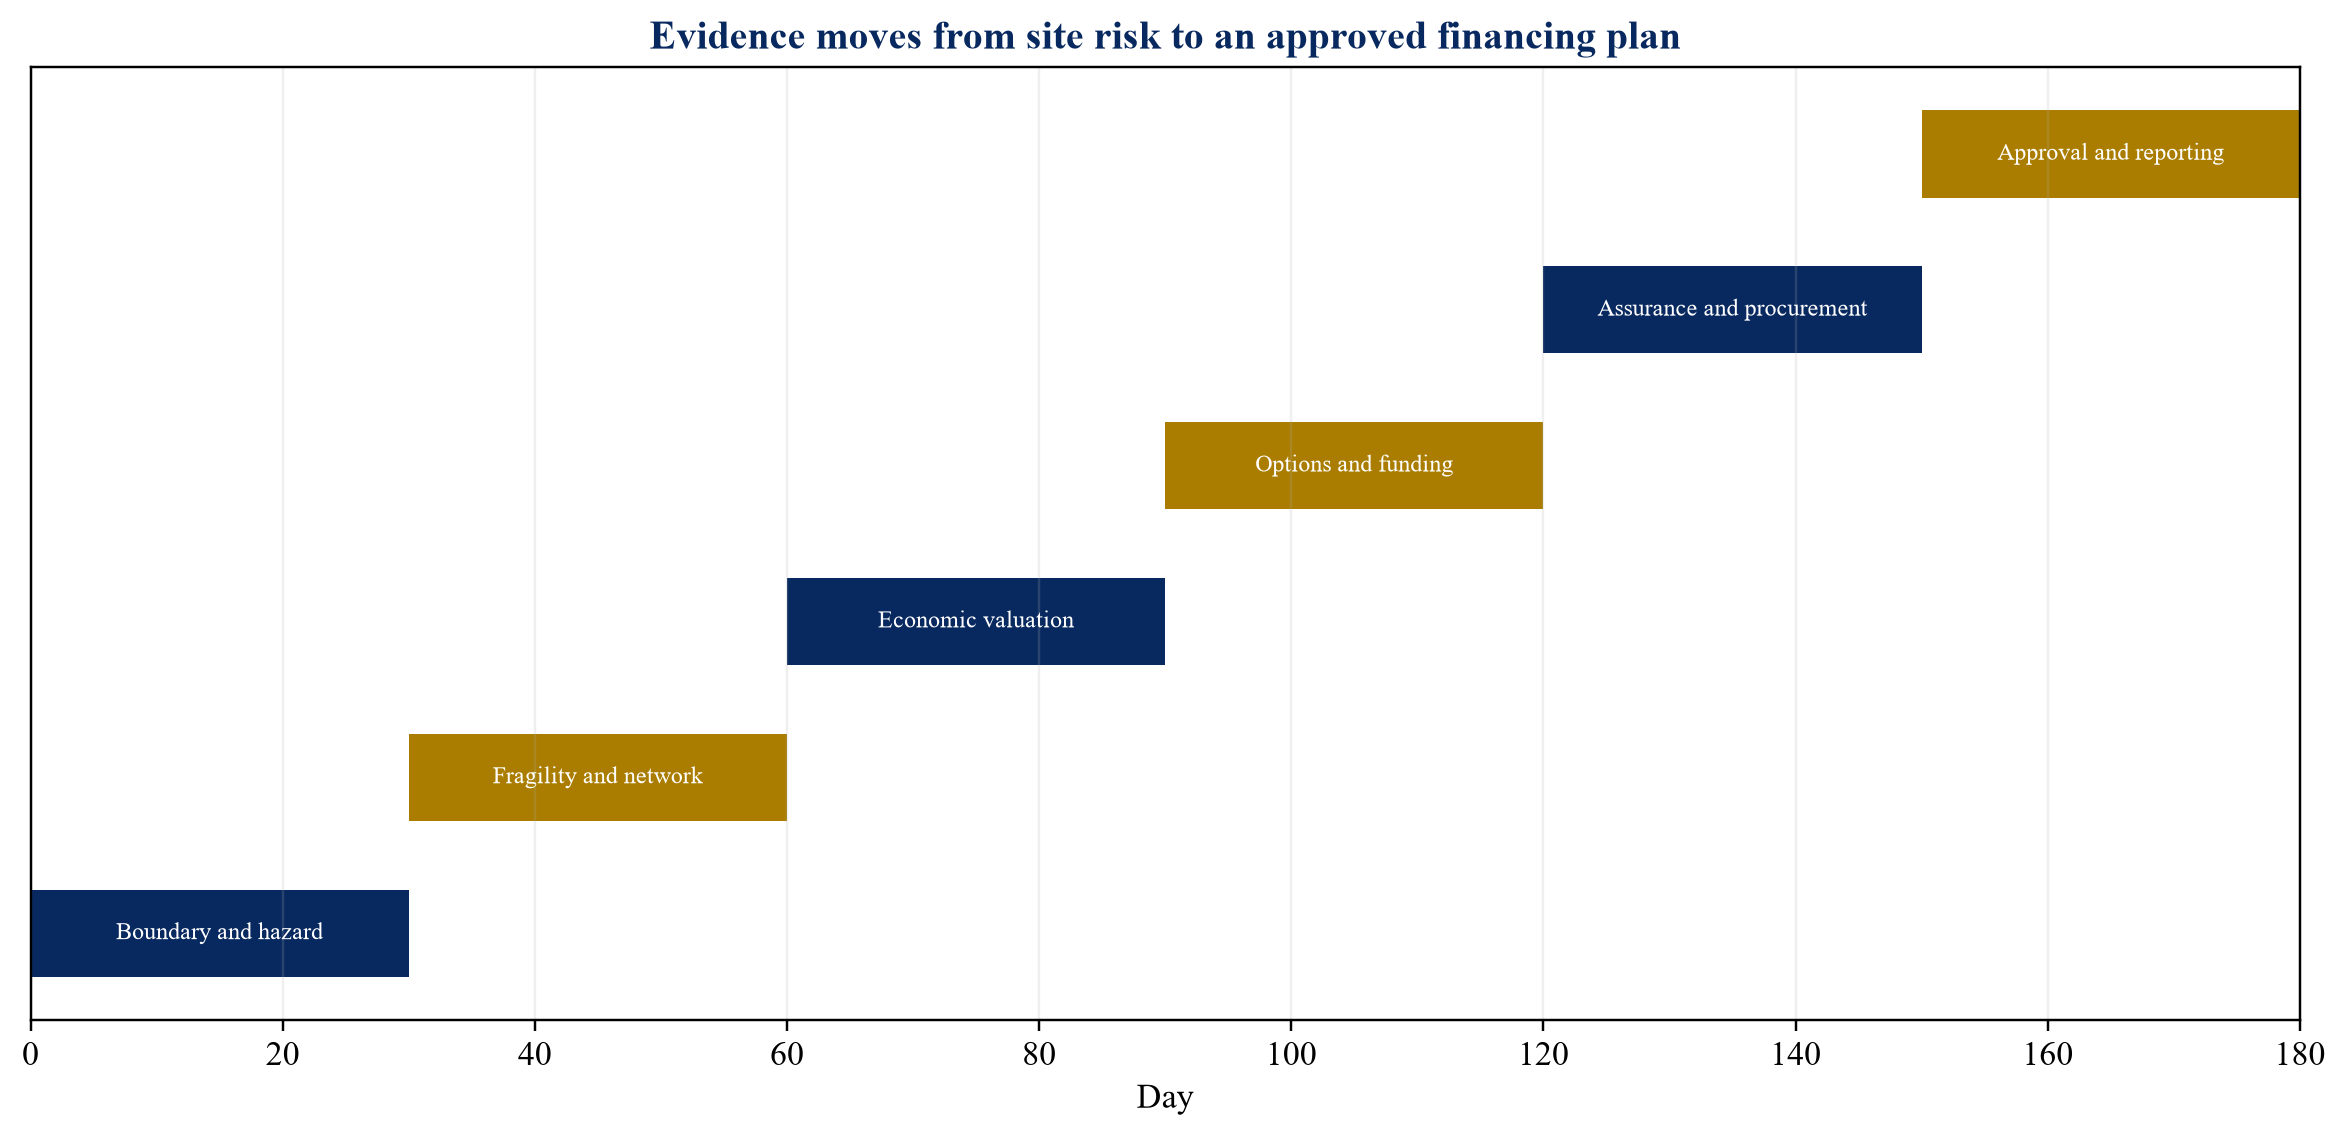
The roadmap is an author-developed implementation framework.
The timetable assumes data and decision makers are available. Complex network studies, planning consent or procurement can extend delivery. The 180-day output is an approved and evidenced programme rather than completed construction.
33 Track benefits after commissioning
Post-investment monitoring should confirm physical performance, maintenance, availability, capacity, restoration readiness and customer outcomes. Measures can include residual hazard exposure, asset condition, energy not served, critical-service continuity, exercise performance and insurance terms.
Benefits should be compared with the approved case using the same definitions. Avoided disasters cannot be observed directly every year, so leading indicators and event performance both matter. Maintenance of barriers, pumps, cooling and fire protection should remain funded throughout asset life.
Regulatory and financing reports should distinguish delivered outputs from estimated long-term benefits. This maintains credibility and supports future capital allocation.
34 Use data and digital monitoring proportionately
Sensors, weather feeds, transformer monitors, thermal imaging, water-level instruments and remote inspection can improve the evidence used in resilience valuation. Their role is to reveal asset condition, hazard intensity and operating margin early enough to change a decision. A large data platform has limited value where the utility lacks response thresholds, accountable owners or reliable communications.
The investment case should identify the decision supported by each data stream. A water-level alarm can trigger barrier closure or controlled isolation. Transformer temperature and dissolved-gas monitoring can support loading decisions and planned maintenance. Fire-weather and vegetation information can guide inspection and operational posture. Digital twins and machine-learning models can assist scenario testing where training data, model limits and engineering oversight are documented.
Cybersecurity, data quality and communications resilience remain part of the design. A monitor that fails during the same event as the asset can create false assurance. Benefits should be based on demonstrated decision improvement, reduced inspection cost or changed failure probability rather than the presence of technology alone.
35 Incorporate connection and growth value
Substations increasingly support new renewable generation, storage, transport electrification, industrial expansion and data-centre demand. Hazard exposure can therefore constrain both current service and future connections. A resilience project may preserve capacity that would otherwise require operational restrictions or an accelerated replacement.
Connection value should be supported by a credible queue, contract, forecast or network plan. The model can compare the timing of connections with and without the intervention, then calculate incremental allowed revenue, contribution or wider system value under the applicable regime. It should not assume that every announced project connects at full capacity.
Where a resilience project and capacity expansion share civil works, land or equipment, common costs should be allocated transparently. The combined programme may produce lower whole-life cost and fewer outages than separate projects. The analysis should retain separate benefit categories so the resilience case remains visible if demand changes.
36 Address procurement concentration
Transformer, switchgear, protection and control equipment can have long lead times and a limited supplier base. A hazard event affecting several utilities can increase demand when transport, labour and manufacturing are already constrained. Procurement resilience therefore influences both project delivery and restoration value.
The utility should assess supplier capacity, manufacturing location, critical materials, design standardisation, alternate vendors, storage and transport. Framework agreements can preserve access, while volume commitments create working-capital and obsolescence risk. Strategic spares should be selected using portfolio consequence and compatibility rather than asset count alone.
Contracts should specify performance, testing, documentation, warranty, cybersecurity, change control and delay remedies. Supplier financial health and insurance matter where replacement depends on long-term support. The valuation should include the cost of maintaining spares and the benefit of reducing severe restoration duration.
37 Apply resilience diligence in transactions
Acquisitions, concessions and project refinancings can transfer substation exposure that is absent from headline asset registers. Diligence should review hazard studies, asset condition, outage records, protection, access, spares, insurance, regulatory allowances and committed capital. It should also identify whether the seller's network provides redundancy that will disappear after separation.
The valuation impact can enter through forecast capital expenditure, working capital, insurance, completion conditions, price adjustment or specific indemnity. Known resilience gaps should be reflected in the integration plan and financing model. A buyer should avoid counting a regulatory allowance as value until eligibility, timing and obligations are verified.
Carve-outs require particular attention to control systems, communications, operating procedures and emergency support. Transitional arrangements should define decision rights and restoration responsibility during the period when systems remain shared.
38 Select options through a multi-criteria decision
Net present value provides one decision measure. Utilities also need to consider severe service loss, safety, compliance, delivery time, flexibility and residual exposure. A multi-criteria matrix can present these factors without converting every obligation into a monetary estimate.
Table 3. Illustrative resilient-substation option matrix
| Option | Expected-value efficiency | Tail-risk reduction | Delivery speed | Future flexibility | Residual exposure |
|---|---|---|---|---|---|
| Targeted flood barriers and drainage | 5 | 3 | 4 | 3 | 3 |
| Elevated controls and critical auxiliaries | 4 | 4 | 3 | 4 | 2 |
| Redundant supply and mobile interface | 3 | 5 | 2 | 5 | 2 |
| Full site relocation | 2 | 5 | 1 | 4 | 1 |
| Monitoring and operating changes | 4 | 2 | 5 | 5 | 4 |
Scores are hypothetical author-modelled examples on a one-to-five scale. They are not engineering findings or investment recommendations.
Weights should reflect approved objectives and legal obligations. The matrix should accompany the underlying evidence and financial model. A high composite score should not override a mandatory standard or an unresolved catastrophic failure mode.
39 Coordinate portfolio delivery
Several resilience projects can compete for the same engineers, outage windows, suppliers and regulator attention. Portfolio sequencing should therefore consider resource constraints and network interaction. Delivering adjacent sites together can reduce mobilisation cost, while simultaneous outages can create service risk.
The delivery plan should identify common designs, repeatable procurement packages, standard interfaces and site-specific exceptions. Early contractor involvement can improve buildability and cost evidence. Independent assurance should focus on high-consequence designs and departures from standard practice.
Benefits should begin only when the relevant protection is commissioned and maintained. Partial completion may reduce some exposure, but the model should avoid recognising the full outcome before critical dependencies are ready.
40 Finance a programme rather than isolated sites
A portfolio can diversify site-specific risk, support repeat procurement and create a predictable capital plan. It can also concentrate construction and balance-sheet exposure. The financing model should aggregate annual expenditure, allowed revenue, debt draw, interest during construction, reserve needs and commissioning dates.
Programme finance can use corporate facilities, regulated funding or a labelled issuance supported by an eligible asset register. Individual high-value sites may justify dedicated contractual or public funding. The utility should keep project-level evidence so portfolio aggregation does not hide weak cases.
Liquidity should cover cost overruns, emergency works and delays in regulatory or insurance recovery. Debt maturity should reflect the life of the funded assets and the revenue period. Short-lived monitoring systems and long-lived civil defences may require different treatment even when procured together.
41 Set board and regulator reporting
The board should receive hazard exposure, critical-service concentration, approved projects, delivery performance, residual risk, funding and evidence quality. Regulators need a clear account of need, option selection, consumer benefit, cost control and delivered outputs. Lenders require cash-flow, covenant, insurance and programme-risk information.
Reports should distinguish observed performance, engineering estimates and scenario outputs. They should show changes since approval, explain material variance and record decisions. A dashboard can summarise the portfolio, while detailed models and protected network information remain in controlled repositories.
Governance should assign ownership for asset resilience, financial valuation, regulatory recovery and benefit tracking. Internal audit or independent assurance can test the evidence chain. The objective is a repeatable decision process that improves after each project and event.
42 Recognise limitations
This framework does not provide an engineering design, climate forecast, insurance opinion, regulatory determination or investment recommendation. Each site requires qualified technical, legal, regulatory, insurance and financial review.
Hazard probability, fragility, outage consequence and restoration time are uncertain. Climate scenarios are conditional projections. Customer interruption values vary widely. Regulatory recovery and insurance depend on executed arrangements. The figures and tables use hypothetical author-modelled assumptions and should not be treated as observed performance or market terms.
Network security can limit disclosure. Protected information should be used through controlled diligence and governance channels.
Conclusion
The value of a resilient substation extends beyond the equipment saved during a storm. It includes service maintained, restoration accelerated, critical loads protected, capacity preserved and emergency cash avoided. Those benefits arise at different points in the hazard-to-value chain and accrue to different parties.
A credible investment case starts with the service boundary, then connects hazard, exposure, fragility, network consequence and restoration. It values physical loss and interruption separately, identifies the cash-flow route and tests severe portfolio conditions. It compares hardening, redundancy, relocation and staged options on a common basis.
The decisive financing question is whether the project turns a documented service risk into measurable outcomes and recoverable cash flow. When engineering evidence, regulatory treatment, insurance, credit and delivery governance are aligned, resilient-substation investment can be assessed with the same discipline as other long-life infrastructure while preserving its public-service purpose.
References
- UK Department for Energy Security and Net Zero, National Policy Statement for Electricity Networks Infrastructure EN-5, 2025. https://www.gov.uk/government/publications/national-policy-statement-for-electricity-networks-infrastructure-en-5-2025/national-policy-statement-for-electricity-networks-infrastructure-en-5-2025-accessible-webpage
- International Energy Agency, Climate Resilience, 2021. https://www.iea.org/reports/climate-resilience
- Federal Energy Regulatory Commission, Order No. 896: Transmission System Planning Performance Requirements for Extreme Weather, 2023. https://elibrary.ferc.gov/eLibrary/docinfo?accession_Number=20230615-3100
- US Department of Energy, Large Power Transformer Resilience, 2024. https://www.energy.gov/sites/default/files/2024-10/EXEC-2022-001242%20-%20Large%20Power%20Transformer%20Resilience%20Report%207-10-24.pdf
- US Department of Energy, How It Works: Electric Transmission and Distribution and Protective Measures, 2023. https://www.energy.gov/sites/default/files/2023-11/FINAL_CESER%20Electricity%20Grid%20Backgrounder_508.pdf
- Ofgem, Extreme Weather Resilience MSIP Consultation, 2022. https://www.ofgem.gov.uk/sites/default/files/2022-05/Extreme%20Weather%20Resilience%20MSIP%20ConDoc%20final.pdf
- California Public Utilities Commission, Utility Wildfire Mitigation Plans. https://www.cpuc.ca.gov/industries-and-topics/wildfires/utility-wildfire-mitigation-plans
- Federal Energy Regulatory Commission, Explainer on the Transmission Planning and Cost Allocation Final Rule, Orders 1920, 1920-A and 1920-B. https://www.ferc.gov/explainer-transmission-planning-and-cost-allocation-final-rule
- National Renewable Energy Laboratory, Valuing Resilience in Electricity Systems, 2019. https://www.nrel.gov/docs/fy19osti/74673.pdf
- Lawrence Berkeley National Laboratory, Estimating Power System Interruption Costs: A Guidebook for Electric Utilities, 2018. https://energyanalysis.lbl.gov/publications/estimating-power-system-interruption
- Ofgem, RIIO-ED2 Engineering Justification Paper Guidance, 2021. https://www.ofgem.gov.uk/guidance/riio-ed2-engineering-justification-paper-guidance
- Ofgem, RIIO-3 Final Determinations Overview Document, 2025. https://www.ofgem.gov.uk/sites/default/files/2025-12/RIIO-3-Final-Determinations-overview.pdf
- Ofgem, Climate Resilience Report: Fourth Round Reporting, 2025. https://www.ofgem.gov.uk/policy/ofgem-climate-resilience-report-fourth-round-reporting
- UK Department for Environment, Food and Rural Affairs, Climate Adaptation Reporting Fourth Round: Energy, 2025. https://www.gov.uk/government/publications/climate-adaption-reporting-fourth-round-energy
- International Energy Agency, Climate Resilience for Energy Security, 2022. https://www.iea.org/reports/climate-resilience-for-energy-security
- International Energy Agency, Electricity 2025: Reliability, 2025. https://www.iea.org/reports/electricity-2025/reliability
- International Energy Agency, Electricity 2026: Reliability, 2026. https://www.iea.org/reports/electricity-2026/reliability
- International Energy Agency, Electricity Grids and Secure Energy Transitions, 2023. https://www.iea.org/reports/electricity-grids-and-secure-energy-transitions
- World Bank, Lifelines: The Resilient Infrastructure Opportunity, 2019. https://documents1.worldbank.org/curated/en/775891600098079887/pdf/Lifelines-The-Resilient-Infrastructure-Opportunity.pdf
- World Bank, Strengthening New Infrastructure Assets: A Cost-Benefit Analysis, 2019. https://documents1.worldbank.org/curated/en/962751560793977276/pdf/Strengthening-New-Infrastructure-Assets-A-Cost-Benefit-Analysis.pdf
- US Department of Energy, Resilience Planning and Valuation. https://www.energy.gov/cmei/femp/resilience-planning-and-valuation
- US Department of Energy, Customer Damage Function Calculator, 2023. https://www.energy.gov/cmei/femp/articles/estimate-value-resilience-customer-damage-function-calculator
- Lawrence Berkeley National Laboratory, Estimated Value of Service Reliability for Electric Utility Customers in the United States, 2009. https://energyanalysis.lbl.gov/publications/estimated-value-service-reliability
- Lawrence Berkeley National Laboratory, A Hybrid Approach to Estimating the Economic Value of Enhanced Power System Resilience, 2021. https://eta-publications.lbl.gov/publications/hybrid-approach-estimating-economic
- Federal Emergency Management Agency, Benefit-Cost Analysis Guidance. https://www.fema.gov/grants/guidance-tools/benefit-cost-analysis
- North American Electric Reliability Corporation, Reliability Standards. https://www.nerc.com/standards/reliability-standards
- Intergovernmental Panel on Climate Change, Climate Change 2022: Impacts, Adaptation and Vulnerability. https://www.ipcc.ch/report/ar6/wg2/
- UK Department for Environment, Food and Rural Affairs, Climate Change Adaptation Reporting Fourth Round Guidance Summary, 2025. https://www.gov.uk/government/publications/climate-adaptation-reporting-fourth-round-guidance/climate-change-adaptation-reporting-fourth-round-guidance-summary
- Ofgem, Energy Network Indicators. https://www.ofgem.gov.uk/news-and-insight/data/data-portal/energy-network-indicators
- International Energy Agency, Modernising Grids in the Age of Electricity, 2026. https://www.iea.org/reports/modernising-grids-in-the-age-of-electricity
About the Author
Authored by Chennakeshav Adya Independent Researcher
Chennakeshav (CK) is a corporate finance and investment banking executive with 25+ years of global experience in deal origination, structuring and execution across M&A, growth capital and corporate strategy. He has led value-creation mandates for founders, corporates and funds — bridging the boardroom view to hands-on execution and close.
His career spans Morgan Stanley, HSBC, Lloyds Banking Group, EWEC, ADQ portfolio companies and Emirates Growth Fund, across TMT, real estate, fintech, deeptech, cleantech, infrastructure and energy. He has partnered with C-suite leaders, private equity and venture funds, sovereign wealth funds and family offices to finance complex fund raises and scale-up ventures, and has led M&A due diligence, post-merger integration and business-transformation initiatives to create value.
At Matchpoint Partners he is Managing Partner, leading the firm's corporate finance, M&A and capital-raising practice. He holds an MBA from London Business School, an engineering degree from VTU and a Master of Laws (LLM, in progress) from UCL London.
An active start-up mentor, CK mentors at Techstars, DIFC FinTech Hive, Startup Grind, Founder Institute and IN5, serves as Entrepreneur Mentor in Residence (EMiR) at London Business School, and judges the Entrepreneurship World Cup.
LinkedIn: https://www.linkedin.com/in/ckadya/ Matchpoint Partners: https://www.matchpoint-partners.com/team/ck-adya.html
This paper is part of a continuing series on the structure of private and alternative markets. The views expressed are the author's own. The paper is for information only, describes market structure in general terms, and does not constitute investment, legal, tax or regulatory advice or a recommendation in respect of any security, vehicle or counterparty.
