

1. The investment question
The decision is whether earlier knowledge of pump deterioration can change an operating or capital action before service, efficiency or asset value is lost. A monitoring device has limited economic value when it produces information after the intervention window has closed, when no accountable team receives it, or when maintenance cannot be scheduled.
The analysis therefore begins with failure modes, critical service, decision lead time and action. Data, models and dashboards follow that definition. Finance should test the cost of sensing, analysis, maintenance and outage against avoided loss, measured energy improvement and deferred or better-timed replacement.
2. Pump performance is a system outcome
A pump operates within a hydraulic system. Flow, head, static lift, friction, throttling, reservoir level, demand, parallel operation and control settings determine the duty point. A healthy pump can consume excessive energy in a poorly configured system; a deteriorated pump can remain hidden when operators compensate through speed or additional units.
The United States Department of Energy advises assessment of the complete pumping system and its changing requirements rather than isolated equipment [1]. Condition and efficiency analysis should retain this system boundary.
3. Reliability and energy share causes
Wear, cavitation, fouling, misalignment, bearing damage, seal degradation, impeller erosion, electrical imbalance, control instability and operation away from the best-efficiency region can affect both reliability and energy. The relationship is not uniform. Some failure modes increase vibration before measurable energy loss; others reduce hydraulic efficiency while vibration remains inconclusive.
A credible programme maps each monitored signal to a physical mechanism and expected decision. Correlation alone should not determine a maintenance action.
4. The value chain
Condition monitoring creates value through a chain: observable degradation, reliable signal, timely diagnosis, approved work, correct intervention, restored performance and sustained outcome. Weakness in any link can leave the programme technically active and economically ineffective.
The chain also separates leading indicators from realised value. An anomaly alert is a lead. A verified reduction in normalized kilowatt-hours per unit of hydraulic output, an avoided service interruption or a defensible extension of replacement timing is an outcome.
5. Service comes first
Water utilities must preserve quality, pressure, continuity, environmental compliance and safe operation. Energy optimisation cannot override minimum storage, treatment, fire-flow, redundancy or discharge requirements. Maintenance windows must reflect operational resilience and seasonal demand.
The programme should state the service constraint for every recommendation. An intervention that saves electricity while reducing standby capacity below an approved threshold is not an acceptable optimisation.
6. Decision architecture
The operating model connects the physical asset, sensor, data pipeline, analytic method, diagnostic owner, work-management system, maintenance team, energy meter and governance forum. Each interface needs an owner, timing requirement and evidence standard.
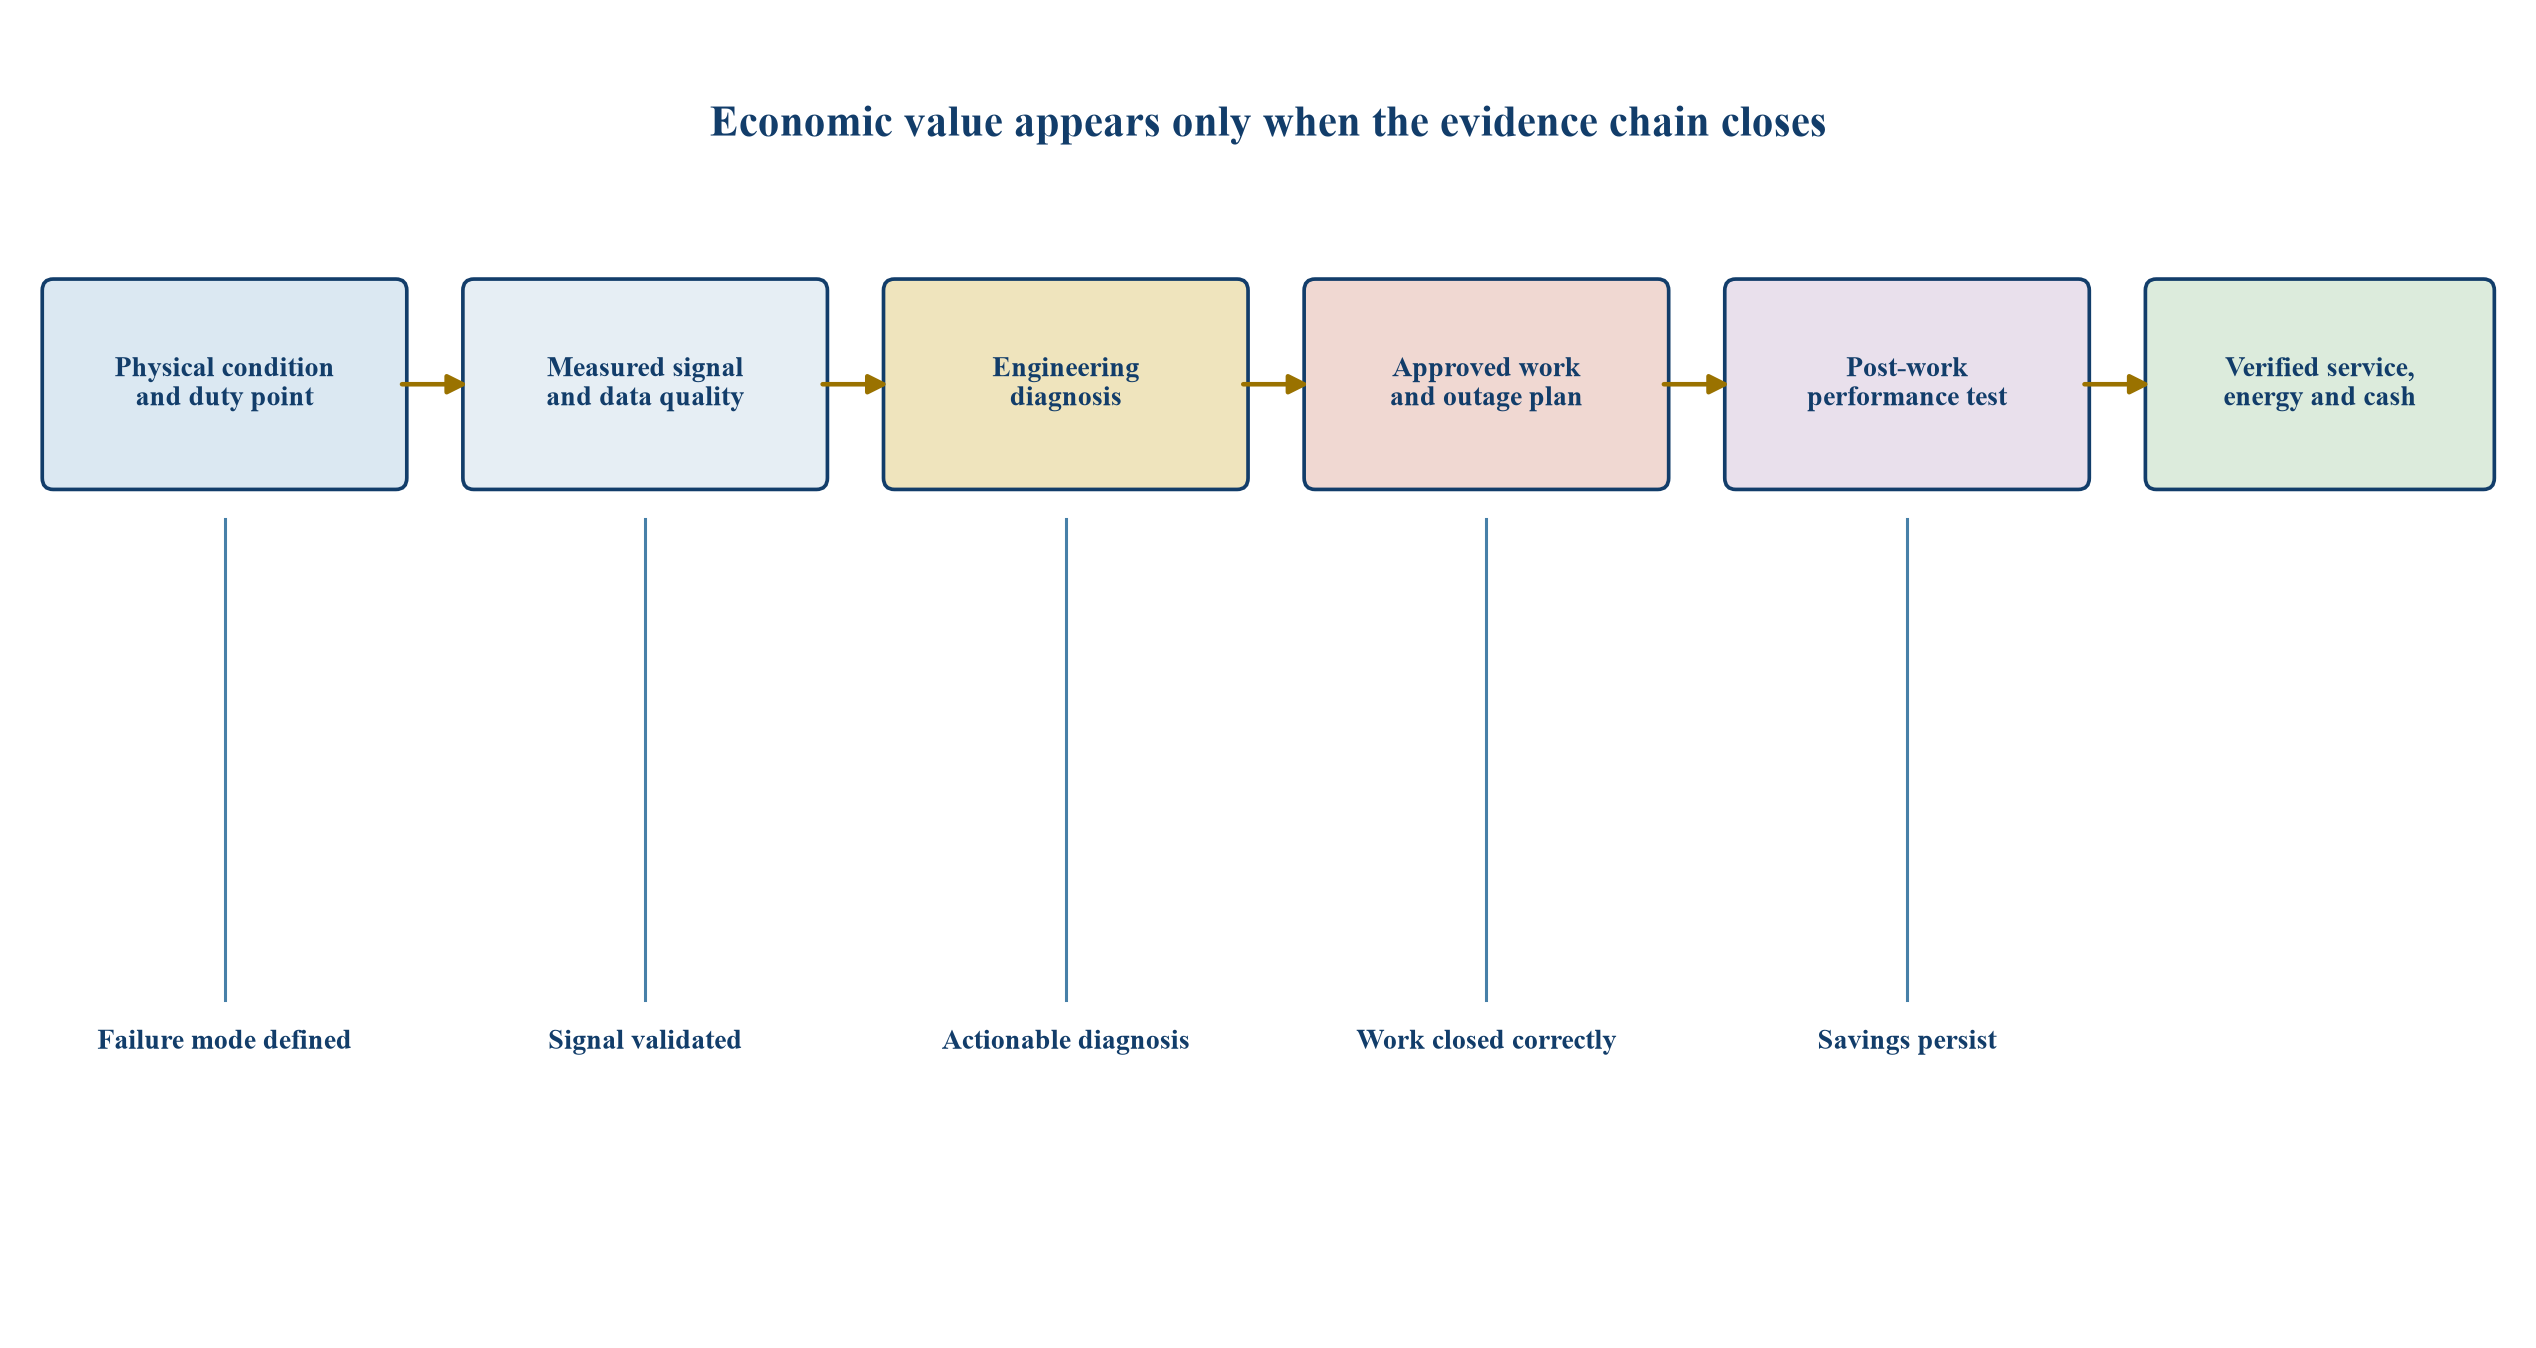
Generic decision architecture; actual instrumentation, thresholds and approvals depend on asset design, service criticality and jurisdiction.
7. Asset hierarchy
The asset register should connect stations, trains, pump sets, motors, drives, valves, instruments and common dependencies. Functional location matters because a failed auxiliary, suction condition or control element can create symptoms at the pump.
Identifiers should match the maintenance system, drawings, historian and financial asset register. Conflicting names prevent reliable joins and make it difficult to attribute cost, downtime or performance to the correct equipment.
8. Criticality
Criticality combines service consequence, redundancy, repair time, access, safety, environmental effect, spare availability and operational flexibility. High installed power does not automatically mean high criticality. A smaller single-point asset can carry greater service consequence than a large duty-standby station.
The criticality method should be approved and periodically reviewed. It determines monitoring depth, alarm response, spares, maintenance strategy and capital priority.
9. Failure-mode register
For each critical asset, the utility should identify credible failure modes, causes, detectable symptoms, lead time, consequence and intervention. The register links engineering knowledge to data requirements. It also exposes failures that current sensors cannot detect.
The register should distinguish gradual degradation from sudden events. Monitoring can improve decisions where a detectable interval exists; protection systems and redundancy address failures with little or no warning.
10. Hydraulic baseline
A baseline needs flow, suction and discharge pressure, speed, valve position, level, fluid properties and configuration. Without these variables, a change in electrical demand can be misread as deterioration when the pump is serving a different duty.
Testing should identify the operating envelope and repeatable comparison points. DOE tools such as MEASUR support field-data assessment of pump energy opportunities [2].
11. Wire-to-water efficiency
Wire-to-water efficiency compares electrical input with useful hydraulic output across the motor, drive and pump. It gives a system-relevant performance measure while retaining the need to inspect component causes.
Meter accuracy, power factor, flow uncertainty, pressure-tap location and transient conditions affect the calculation. Reported improvements should state the measurement boundary and uncertainty.
12. Best-efficiency region
Operating too far from the intended best-efficiency region can increase recirculation, vibration, heat, radial load and wear. The target is a safe operating range supported by manufacturer and system evidence, not a single universal point.
Duty profiles should show how much time each pump spends across its range. That distribution can inform sequencing, impeller selection, variable-speed control and replacement design.
13. Oversizing
Oversized pumps can create throttling, bypass flow, frequent starts or inefficient low-load operation. DOE guidance identifies system matching as a central performance issue [1]. Maintenance cannot recover the full value of a structurally mismatched design.
The decision set may include control changes, impeller trim, reconfiguration, smaller duty units or replacement. The business case should compare lifecycle cost, service flexibility and implementation risk.
14. Parallel pumping
Parallel units interact through the system curve. Adding a pump does not necessarily add proportional flow and can move all units to poorer efficiency. Unequal condition can also cause one unit to carry a different share of duty.
Monitoring should retain combination, speed and hydraulic context. Optimisation should test sequences under actual demand and reservoir conditions.
15. Variable-speed drives
Variable-speed drives can align output with demand and reduce throttling losses. EPA guidance advises examination of pump curves and operating data to determine where drives are cost effective [3]. Minimum speed, cooling, harmonics, resonance and cybersecurity also require engineering review.
Savings should be measured across representative demand periods. A drive installed on a pump dominated by static head may deliver less benefit than an affinity-law estimate suggests.
16. Vibration
Vibration analysis can reveal bearing defects, imbalance, looseness, misalignment, hydraulic excitation and resonance. Trending frequency and amplitude over comparable duty conditions is more informative than an isolated reading. DOE identifies vibration as a predictive-maintenance method for pumping systems [1].
Sensor placement, mounting, sampling rate and operating state must be controlled. A model should not combine incompatible locations or regimes without an explicit normalization method.
17. Motor current
Motor current signature and electrical measurements can indicate imbalance, rotor issues and load changes. They can also provide a lower-intrusion route for remote assets. Interpretation needs motor, drive and process context.
A current change may reflect hydraulic demand rather than damage. Diagnostic rules should use corroborating evidence before raising a work order.
18. Temperature
Bearing, winding, lubricant and enclosure temperature can show friction, cooling or electrical problems. Ambient temperature, load and ventilation influence readings. Thresholds should reflect equipment design and site conditions.
Rate of change and deviation from comparable units can supplement absolute limits. Safety protection remains separate from predictive analytics.
19. Lubricant evidence
Oil condition and wear particles can reveal contamination, overheating and component wear in suitable equipment. Sampling practice, laboratory method and interval determine comparability. Smaller or grease-lubricated pumps may need different evidence.
The programme should use analysis where the expected decision value exceeds sampling and interpretation cost. Every test should have a defined response to normal, caution and critical results.
20. Cavitation
Cavitation can damage impellers, reduce performance and create characteristic noise or vibration. Diagnosis should consider available suction head, level, temperature, blockage, valve position and operating point. Treating the vibration alone can miss the hydraulic cause.
Corrective action may involve suction conditions, operating range, controls or design. Replacing damaged parts without removing the cause can repeat the failure.
21. Leakage and seals
Seal and packing condition can affect reliability, water loss, housekeeping and shaft wear. Excessive tightening can also increase friction and energy use. DOE maintenance guidance connects seal practice with performance [1].
Inspection evidence should record leakage condition, intervention and post-work result. Automated monitoring can support prioritisation where leakage is difficult to observe continuously.
22. Alignment and balance
Misalignment and imbalance increase vibration, bearing load and power loss. Installation, foundation movement, piping strain and previous work can contribute. Alignment should be verified after relevant maintenance rather than assumed from work completion.
The close-out record should include method, tolerances, operating test and responsible sign-off. A completed work order without measurement is weak evidence of restored condition.
23. Fouling and wear
Deposits, corrosion, abrasion and impeller wear can reduce hydraulic efficiency gradually. Operators may preserve pressure by increasing speed or run time, shifting deterioration into the energy bill. Performance testing can identify this hidden compensation.
Material selection, water characteristics and duty cycle shape the degradation path. Intervention timing should balance cleaning or refurbishment cost with accumulated energy and reliability loss.
24. Data quality
Reliable analytics require calibrated sensors, synchronized time, known units, stable tags, complete records and flags for maintenance or abnormal operation. Missingness can be informative when it reflects communication or power problems, yet it should not be silently imputed.
The data-quality register should identify owner, test frequency, acceptable range and effect on each decision. ISO 55001:2024 gives specific attention to asset-management data and information [4].
25. Time alignment
Power, flow, pressure, speed, vibration and work events often come from different systems. Clock drift and aggregation can manufacture or hide relationships. The analytical pipeline should preserve source timestamps and document alignment.
Event studies need enough pre- and post-work data under comparable duty. Daily averages may conceal start-stop or transient problems.
26. Sensor assurance
Sensor failure can resemble asset failure. Drift, loose mounting, fouling, communication loss and scaling errors need detection. Cross-checking against portable instruments or independent process measures can establish confidence.
Critical alerts should expose the health of the monitoring channel. A model cannot provide reliable assurance when its own sensing path is unverified.
27. Model purpose
Models may detect anomalies, classify faults, estimate remaining useful life or recommend intervention. Each purpose has a different evidence burden. An anomaly model can rank inspections without proving a specific failure mode or life estimate.
The deployment record should state intended use, excluded use, training population, operating envelope, update process and human approval point.
28. False positives
False alerts consume engineering time, create unnecessary maintenance and weaken trust. Their cost includes outage, parts, access and opportunity. Threshold tuning should therefore consider consequence and action cost rather than statistical accuracy alone.
The programme should track alert-to-inspection, alert-to-work and confirmed-defect conversion. Suppressed alerts should remain auditable.
29. False negatives
Missed deterioration can create failure, service loss and safety consequence. Validation should include known failures, seeded tests where safe, back-testing and comparison with existing protection. Rare severe events require engineering judgement beyond model statistics.
High-consequence failure modes may need conservative limits, redundancy or periodic intrusive inspection even when analytics are available.
30. Remaining useful life
A remaining-useful-life estimate can support outage and spares planning. Precision is often limited by duty changes, maintenance history, environment and sparse failure data. Presenting a point estimate without uncertainty can create false confidence.
Decision bands can be more useful: continue monitoring, inspect at next opportunity, schedule intervention, or remove from service under approved criteria.
31. Human diagnosis
Operators and maintainers hold contextual knowledge about noise, access, process changes and previous interventions. Their input should be captured in structured records and tested against measurements. Informal knowledge that remains outside the system creates succession risk.
Analytics should support an accountable engineering decision. The approver should see relevant evidence, confidence, operational context and consequence.
32. Work-order closure
An alert creates value only if it leads to a completed decision. The work-management system should record diagnosis, action, parts, labour, outage, findings and post-work test. Closing an order as completed without defect and performance evidence breaks the learning loop.
Failure codes and intervention taxonomy should be consistent enough to evaluate model and maintenance effectiveness.
33. Verification hierarchy
Evidence can progress from alert acknowledgement to inspection, confirmed defect, completed intervention, restored condition, improved normalized performance and sustained outcome. The programme should report each stage separately.
This hierarchy prevents claims based solely on predicted failures. Verified value requires physical and operating evidence appropriate to the claim.
34. Outcome register
Table 1. Evidence required for common maintenance and energy claims
| Claim | Minimum evidence | Important qualification | Decision use |
|---|---|---|---|
| Degradation detected | Valid signal plus engineering diagnosis | Comparable duty and sensor health | Inspection or work priority |
| Failure avoided | Confirmed defect and documented intervention before functional failure | Counterfactual remains uncertain | Reliability learning and risk review |
| Efficiency restored | Repeat hydraulic and electrical test after intervention | Normalize flow, head, speed and configuration | Energy and lifecycle case |
| Asset life extended | Condition trajectory, engineering limit and revised intervention timing | Avoid unsupported point estimates | Capital plan and reserve timing |
| Energy saved | Metered baseline and reporting period with stated adjustments | State uncertainty and persistence | Budget, financing and payment |
35. Energy baseline
The baseline should represent expected energy under the service and operating conditions that would have occurred without the intervention. It needs a defined period, metering boundary, independent variables, exclusions and adjustment rules.
Weather, demand, source selection, reservoir levels, pressure targets, water quality and tariff can affect results. A simple before-and-after comparison is weak when these conditions change.
36. Normalization
Useful intensity measures include kilowatt-hours per unit volume and energy relative to hydraulic output. Volume-only measures can mislead when lift or pressure changes. Normalization should match the intervention and available data.
The calculation should be reproducible from retained source data. Material manual adjustments require explanation and approval.
37. Measurement boundary
A component boundary can verify pump or motor performance. A station boundary captures interactions and auxiliaries. A network boundary can show system outcomes while introducing more confounding variables. The claimed benefit should match the boundary.
Portfolio reports should not add overlapping savings from component and station analyses. A savings register should identify mutually exclusive measurement boundaries.
38. Metering plan
The plan should specify meters, accuracy, calibration, interval, data retention, communications and fallback. Temporary metering can support a test; permanent submetering supports persistence and operational control.
Ofwat has highlighted the value of robust and comparable asset-condition information for investment decisions [5]. Condition and energy data should be governed as investment evidence.
39. Intervention test
Pre- and post-work tests should use comparable operating points or a defensible model across the operating range. The protocol records valve state, unit combination, level, pressure, flow, speed, power and relevant environment.
Testing must respect service and equipment limits. The result should separate restored equipment performance from concurrent control or process changes.
40. Persistence
Initial improvement can erode through drift, changed schedules, bypassed controls or renewed wear. Persistence testing compares normalized performance over an agreed reporting period and investigates variance.
The maintenance plan should define recommissioning triggers and responsibility. Savings that are not sustained should not support recurring budget reductions.
41. Energy tariff
Cost savings depend on energy volume, demand charge, time-of-use price, power factor and contract terms. Moving pumping away from peak periods can reduce cost without reducing energy; an efficient intervention can reduce energy without proportional bill savings.
Finance should keep energy, demand, tariff and carbon effects distinct. Forecast tariffs are management estimates and should be sensitivity-tested.
42. Carbon accounting
Energy reduction can lower reported emissions depending on the accounting boundary and electricity factor. The carbon claim should use an approved factor and period. Renewable procurement can change reported emissions without changing physical consumption.
The investment case should show operational energy separately from carbon valuation. This preserves decision clarity as policy and reporting methods change.
43. Maintenance economics
Costs include sensors, installation, communications, software, integration, calibration, analyst time, inspections, planned work, spares and governance. Benefits can include energy savings, avoided emergency work, reduced consequential damage, service protection and better replacement timing.
Each benefit needs an evidence class and owner. Avoided-failure values should be scenario-based and not booked as realised savings.
44. Hypothetical business case
Table 2. Hypothetical programme economics under alternative evidence cases
| Case | Annual programme cost | Verified annual energy saving | Scenario-based reliability value | Decision interpretation |
|---|---|---|---|---|
| Weak evidence | USD 0.40m | USD 0.10m | Not quantified | Redesign measurement and workflow |
| Energy-led | USD 0.40m | USD 0.55m | Excluded | Fund where savings persist |
| Integrated | USD 0.55m | USD 0.60m | USD 0.45m expected-value estimate | Test assumptions and service evidence |
| High-cost deployment | USD 0.90m | USD 0.45m | USD 0.20m expected-value estimate | Narrow scope or restructure procurement |
These values are hypothetical and demonstrate decision logic only. They are not market benchmarks or expected results. A real case requires asset-level cost, tariffs, operational data and approved reliability scenarios.
45. Avoided failure
Avoided failure is a counterfactual. Evidence can show a defect and timely intervention; it rarely proves the exact date or consequence of failure without intervention. The model should use scenario ranges and confidence rather than record the entire consequence as realised value.
Benefits should avoid double counting repair, downtime, service and penalty pathways arising from the same event.
46. Emergency versus planned cost
Planned work may reduce mobilisation premium, collateral damage and service disruption. The comparison should include actual labour, parts, access, isolation and outage conditions. A planned intervention can still be expensive when redundancy is limited.
Historical emergency cost provides context but should be adjusted for scope and price. Small samples need cautious interpretation.
47. Asset-life decision
Condition evidence can support continued operation, refurbishment or replacement. Extension is defensible when deterioration limits, inspection frequency, failure consequence and fallback are understood. It should not become indefinite deferral without a funded end state.
Capital planning should record the changed timing, monitoring obligation and trigger that reverses the decision.
48. Repair, refurbish or replace
The choice should compare lifecycle energy, reliability, service fit, parts, support, downtime, embodied impact and future duty. A high-efficiency new pump may underperform if poorly matched. Refurbishment may restore performance when the system duty remains appropriate.
The options appraisal should use comparable service output and risk. Sunk cost should not determine the decision.
49. Portfolio prioritisation
Utilities may operate hundreds or thousands of pumps. Ranking should combine criticality, energy exposure, deterioration evidence, intervention feasibility and data readiness. Installed power alone favours large assets and can miss critical remote stations.
Portfolio waves allow the utility to learn before scaling. Early assets should be representative enough to test the operating model.
50. Capital allocation matrix
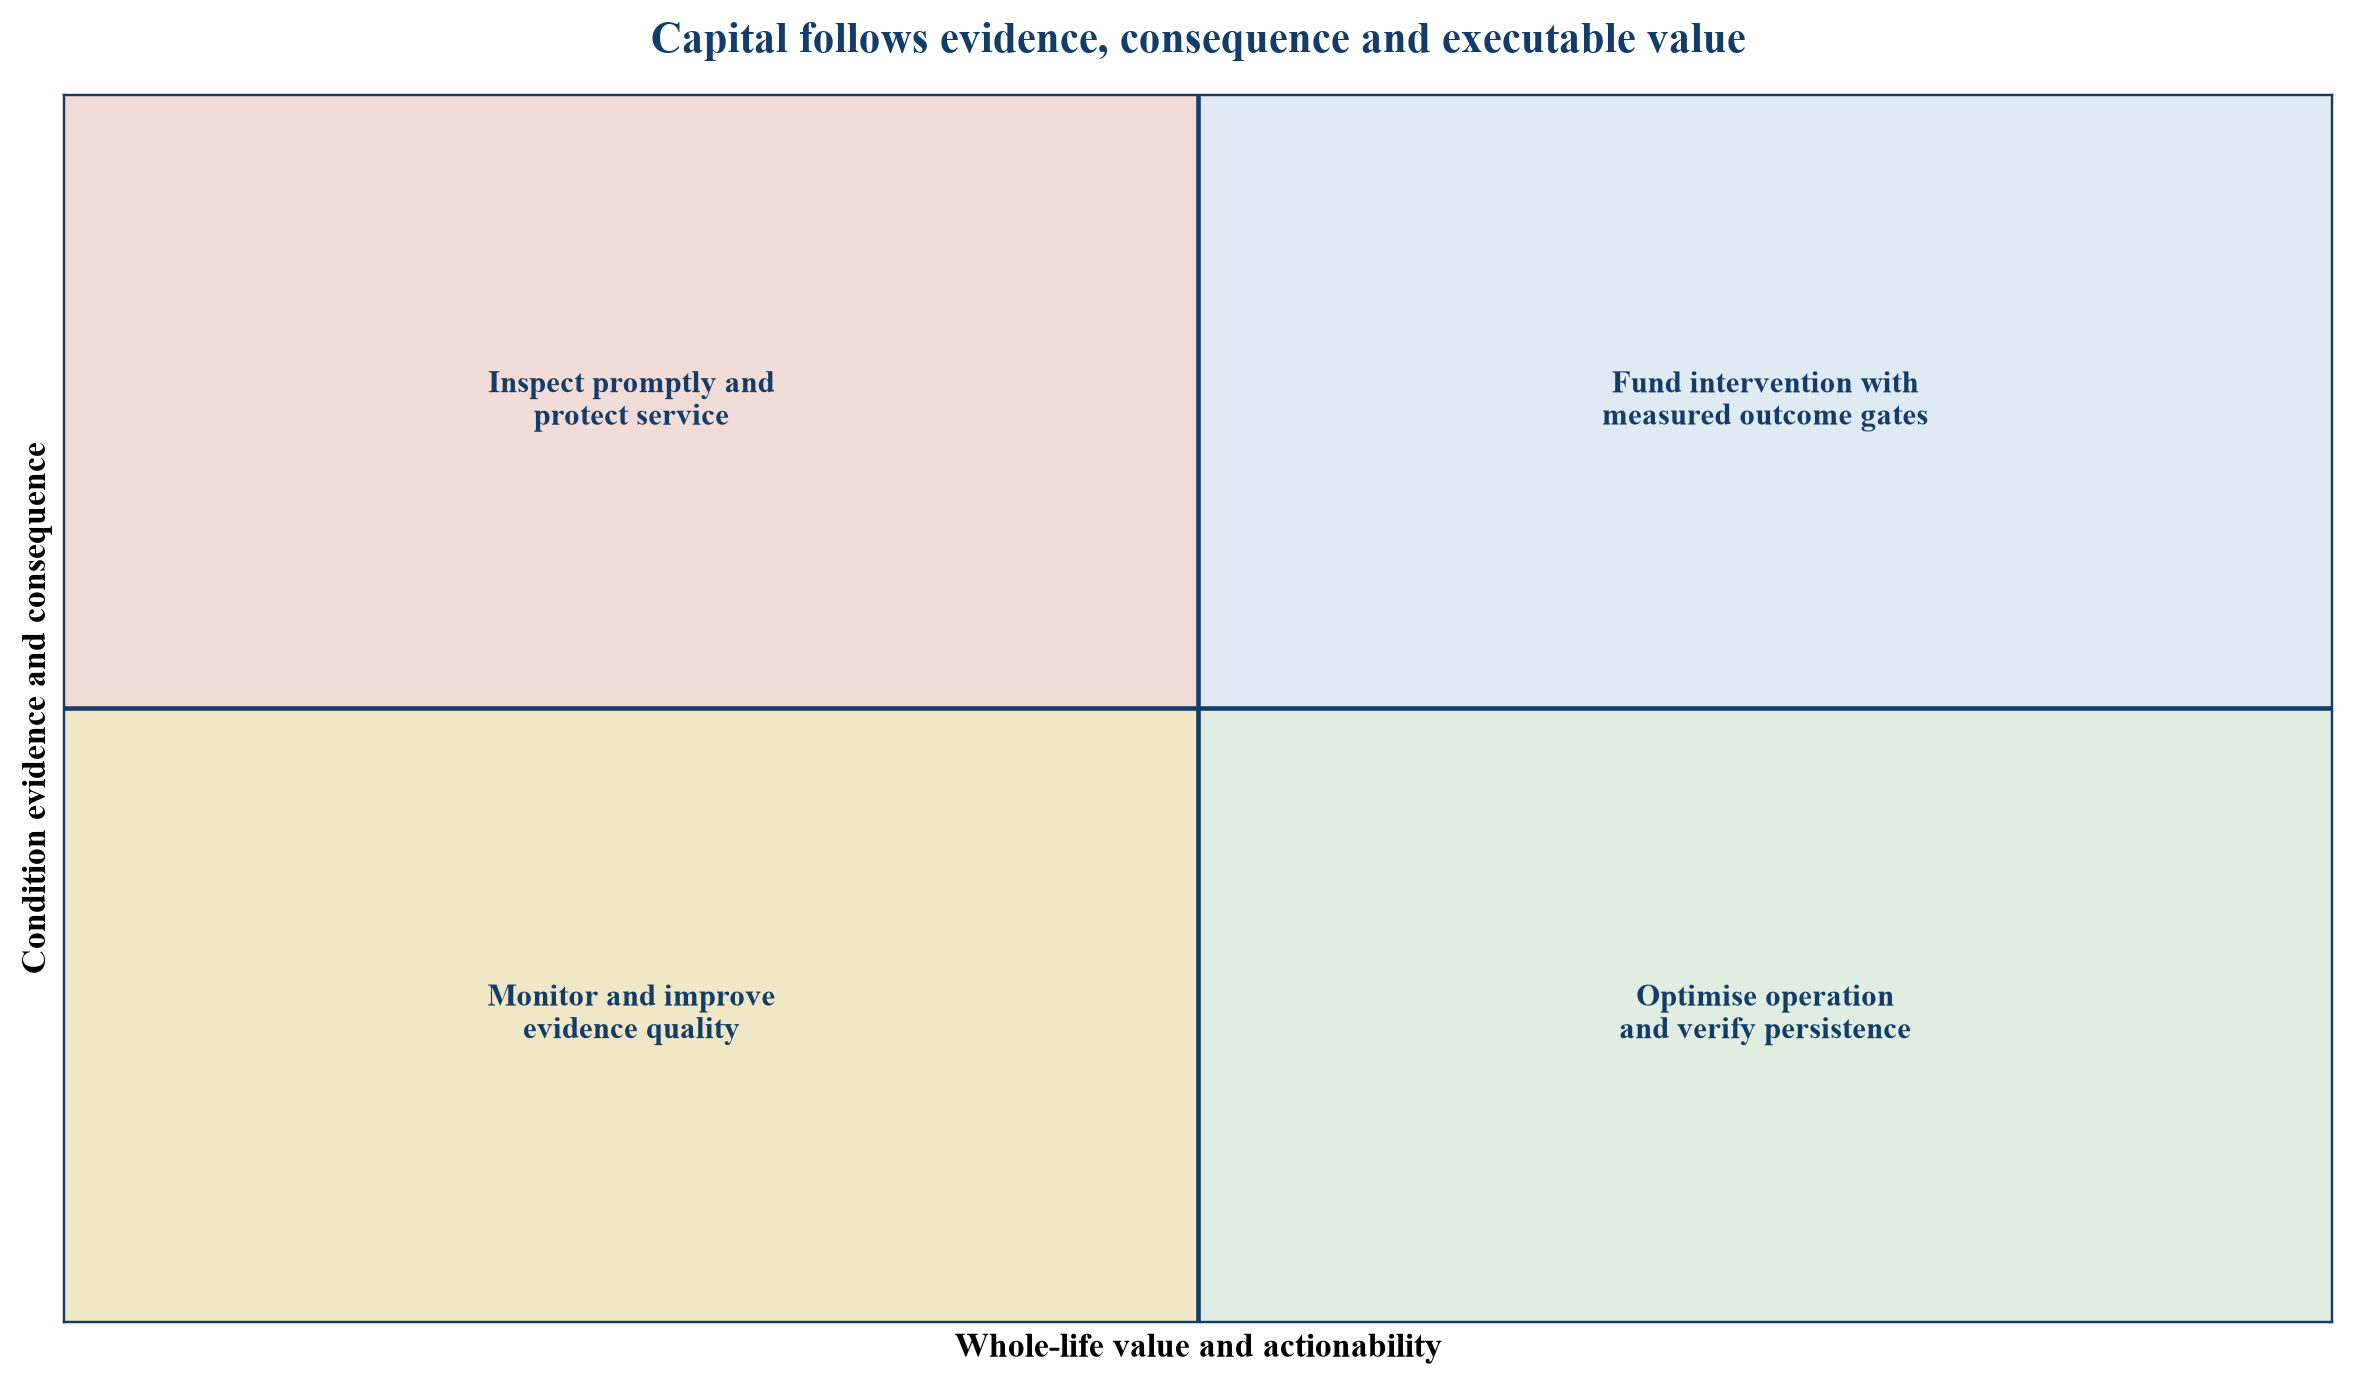
Illustrative matrix; thresholds and actions require utility approval and asset-specific evidence.
51. Budget integration
Monitoring, maintenance, energy and capital budgets often sit in different functions. A single intervention can create benefits and costs across all four. Governance should allocate the full case and prevent savings from being claimed by multiple programmes.
The annual plan should distinguish recurring programme cost, maintenance work, enabling data investment and asset replacement.
52. Financing structure
Energy-saving and reliability projects may use utility capital, public finance, green loans, sustainability-linked facilities, vendor finance or performance contracts. The structure should match the evidence, control and risk allocation of the project.
Debt repayment cannot depend on unverified avoided-failure claims. Metered energy savings can support a clearer cash pathway when tariff and persistence risks are addressed.
53. Performance contracts
A performance contract needs an agreed baseline, adjustment method, metering plan, savings calculation, operating obligations, exclusions, dispute process and persistence term. The provider should control enough of the solution to accept the allocated risk.
Guarantees should state remedy, cap and verification. Utility operating changes outside the provider's control need defined treatment.
54. Green and sustainability-linked finance
Eligible use-of-proceeds and performance targets require documentation aligned with the applicable financing framework. Energy efficiency can support a green rationale; lenders still need conventional credit analysis and reliable reporting.
Targets should avoid easy gains from boundary changes or reduced service. Independent review can strengthen credibility where material.
55. Project finance
For a concession or project-financed utility, reliability and energy affect operating cost, availability, reserves and covenant headroom. Diligence should test whether maintenance responsibilities, lifecycle allowances and handback obligations are aligned.
The base case should include recurring monitoring and calibration, not only initial installation. Downside cases should preserve essential maintenance rather than treat it as fully discretionary.
56. Acquisition diligence
A buyer should inspect asset hierarchy, criticality, failure history, energy data, monitoring coverage, alarm quality, work closure, spares and capital plan. A polished dashboard can conceal incomplete instrumentation or weak maintenance execution.
The valuation bridge should distinguish known remediation, recurring cost, evidence gaps and scenario exposure. Generic percentage discounts are weak substitutes for asset-level analysis.
57. Contract allocation
Supply, software and service agreements should define data ownership, access, uptime, calibration, model support, cybersecurity, performance, liability, transition and exit. Proprietary analytics can create dependency when raw data or model outputs cannot be exported.
The utility should retain enough information to operate safely and evidence decisions if a supplier changes.
58. Warranty
Equipment and service warranties should align with operating conditions, maintenance duties and measurement. A warranty can be lost through undocumented configuration or work. Predictive recommendations should not conflict with manufacturer requirements without approved engineering review.
Claims processes need retained baseline, alarms, inspections and intervention records.
59. Cybersecurity
Connected sensors, gateways, drives and cloud analytics expand the digital estate. Security architecture should cover identity, remote access, segmentation, updates, logging, supplier access and recovery. EPA notes that connected variable-speed drives can introduce third-party cyber risk [6].
Security controls should be designed with operational availability and safe fallback. Condition monitoring should not create an uncontrolled path into process control.
60. Safety and change control
Sensor installation, testing and maintenance can affect live electrical and hydraulic equipment. Approved isolation, permits, competent personnel and management of change apply. Analytical thresholds that influence operation also require controlled change.
The programme should document who can recommend, approve and execute changes. Automatic control based on a predictive model needs a higher assurance case than advisory analytics.
61. Operations engagement
Operators should help define failure signatures, usable alerts and maintenance windows. Their feedback can identify nuisance alarms and missing context. Adoption should be measured through decisions and work completion rather than dashboard logins alone.
Training should include the limitations of the evidence. Confidence should come from repeated verified outcomes.
62. Competence
The operating model may need vibration, electrical, hydraulic, data, reliability and financial skills. Utilities should define which capabilities remain internal and which are procured. Supplier expertise does not remove owner accountability.
Competence records, review rights and succession plans matter for programmes that continue over the asset life.
63. Spares
Earlier warning has limited value if critical parts, repair capacity or access are unavailable. The programme should connect predicted demand to spares policy and supplier lead times. Excess inventory also carries obsolescence and working-capital cost.
Critical spares decisions should use failure consequence, commonality, lead time, storage condition and interchangeability.
64. Outage planning
Planned intervention must fit network, treatment and seasonal constraints. The utility may need temporary pumping, storage, bypass, customer communication or regulatory approval. These costs belong in the business case.
Condition evidence can improve timing by increasing the available planning window. It does not eliminate outage risk.
65. Pilot design
A pilot should test the complete value chain across assets with known failure modes, adequate data and actionable maintenance. Selection solely for easy installation can produce a successful technical demonstration with little economic relevance.
Entry criteria, success measures, minimum duration, independent checks and scale decision should be approved before installation.
66. Scaling gates
Scale should follow evidence that alerts are valid, work is executed, outcomes are verified, cybersecurity is acceptable and unit economics remain attractive. Coverage targets alone can reward sensor deployment without value.
Successive waves should address harder sites and different duties. The economics should include central platform and local integration.
67. Procurement
Procurement should evaluate diagnostic transparency, interoperability, raw-data access, reference performance, support, calibration, integration, cyber controls and exit. Lowest sensor price can be misleading when installation and workflow dominate lifecycle cost.
Evaluation scenarios should require suppliers to show how an alert becomes a verified work and savings record.
68. Payment gates
Table 3. Illustrative stage gates for a condition-monitoring programme
| Gate | Evidence | Capital or payment response | Stop condition |
|---|---|---|---|
| Design accepted | Failure modes, criticality and measurement plan | Release design and integration spend | No actionable use case |
| Data commissioned | Calibrated signals and synchronized context | Release pilot service payment | Persistent material data failure |
| Diagnosis validated | Confirmed defects and controlled false-alert record | Release scale-design payment | No reliable decision signal |
| Intervention verified | Work closure and repeat performance test | Release outcome-linked amount | Unverified or adverse result |
| Persistence demonstrated | Normalized reporting-period savings | Release recurring benefit payment | Savings fail agreed test |
69. Governance
The steering forum should include operations, maintenance, asset management, energy, finance, digital, cybersecurity and procurement. It should approve criticality, evidence standards, interventions, benefit recognition and scale.
Decision rights should be written. Technical suppliers should not certify their own financial outcome without the agreed review.
70. Board reporting
Board reporting should show critical coverage, validated alerts, work conversion, recurring defects, service events, normalized energy, verified savings, programme cost, capital changes and unresolved exposure. Leading and lagging measures should remain distinct.
The board should see data limitations and management estimates that affect investment decisions.
71. Assurance
Assurance should test data lineage, calibration, model use, work evidence, savings calculations, access controls and reported outcomes. Sampling should reflect materiality and criticality. Independent engineering and financial review may both be needed.
Assurance findings should connect to corrective action and capital release. A report without closure evidence does not complete the gate.
72. Regulatory interface
Asset-health and service obligations vary by jurisdiction. Ofwat's priority-assets programme seeks robust, comparable condition and historical-investment data for water-sector decisions [5]. Other regulators and public authorities use different frameworks.
Utilities should map the programme to current reporting, resilience, efficiency and assurance requirements. The paper does not provide jurisdiction-specific regulatory advice.
73. Common failure patterns
Weak programmes install sensors before defining decisions, train models on unlabelled events, use unnormalized energy, close alerts without findings, count predicted failures as savings, omit calibration, and scale before work processes function. These patterns create attractive dashboards and weak investment evidence.
The corrective response is a narrower, testable scope with explicit failure modes and outcome gates.
74. Red flags
Red flags include conflicting asset identifiers, unexplained missing data, thresholds changed without approval, alerts concentrated outside staffed hours, work orders closed without inspection, savings based on bill totals alone, and repeated interventions without restored performance.
Material red flags should stop benefit recognition and may stop scale until resolved.
75. Diligence request list
The request should cover asset register, criticality method, drawings, pump curves, duty history, failure and work records, sensor inventory, calibration, model documentation, alarms, energy meters, tariffs, baselines, interventions, savings register, suppliers, cyber review, capex plan and governance minutes.
Representative raw evidence and site inspection should supplement summaries.
76. Implementation roadmap
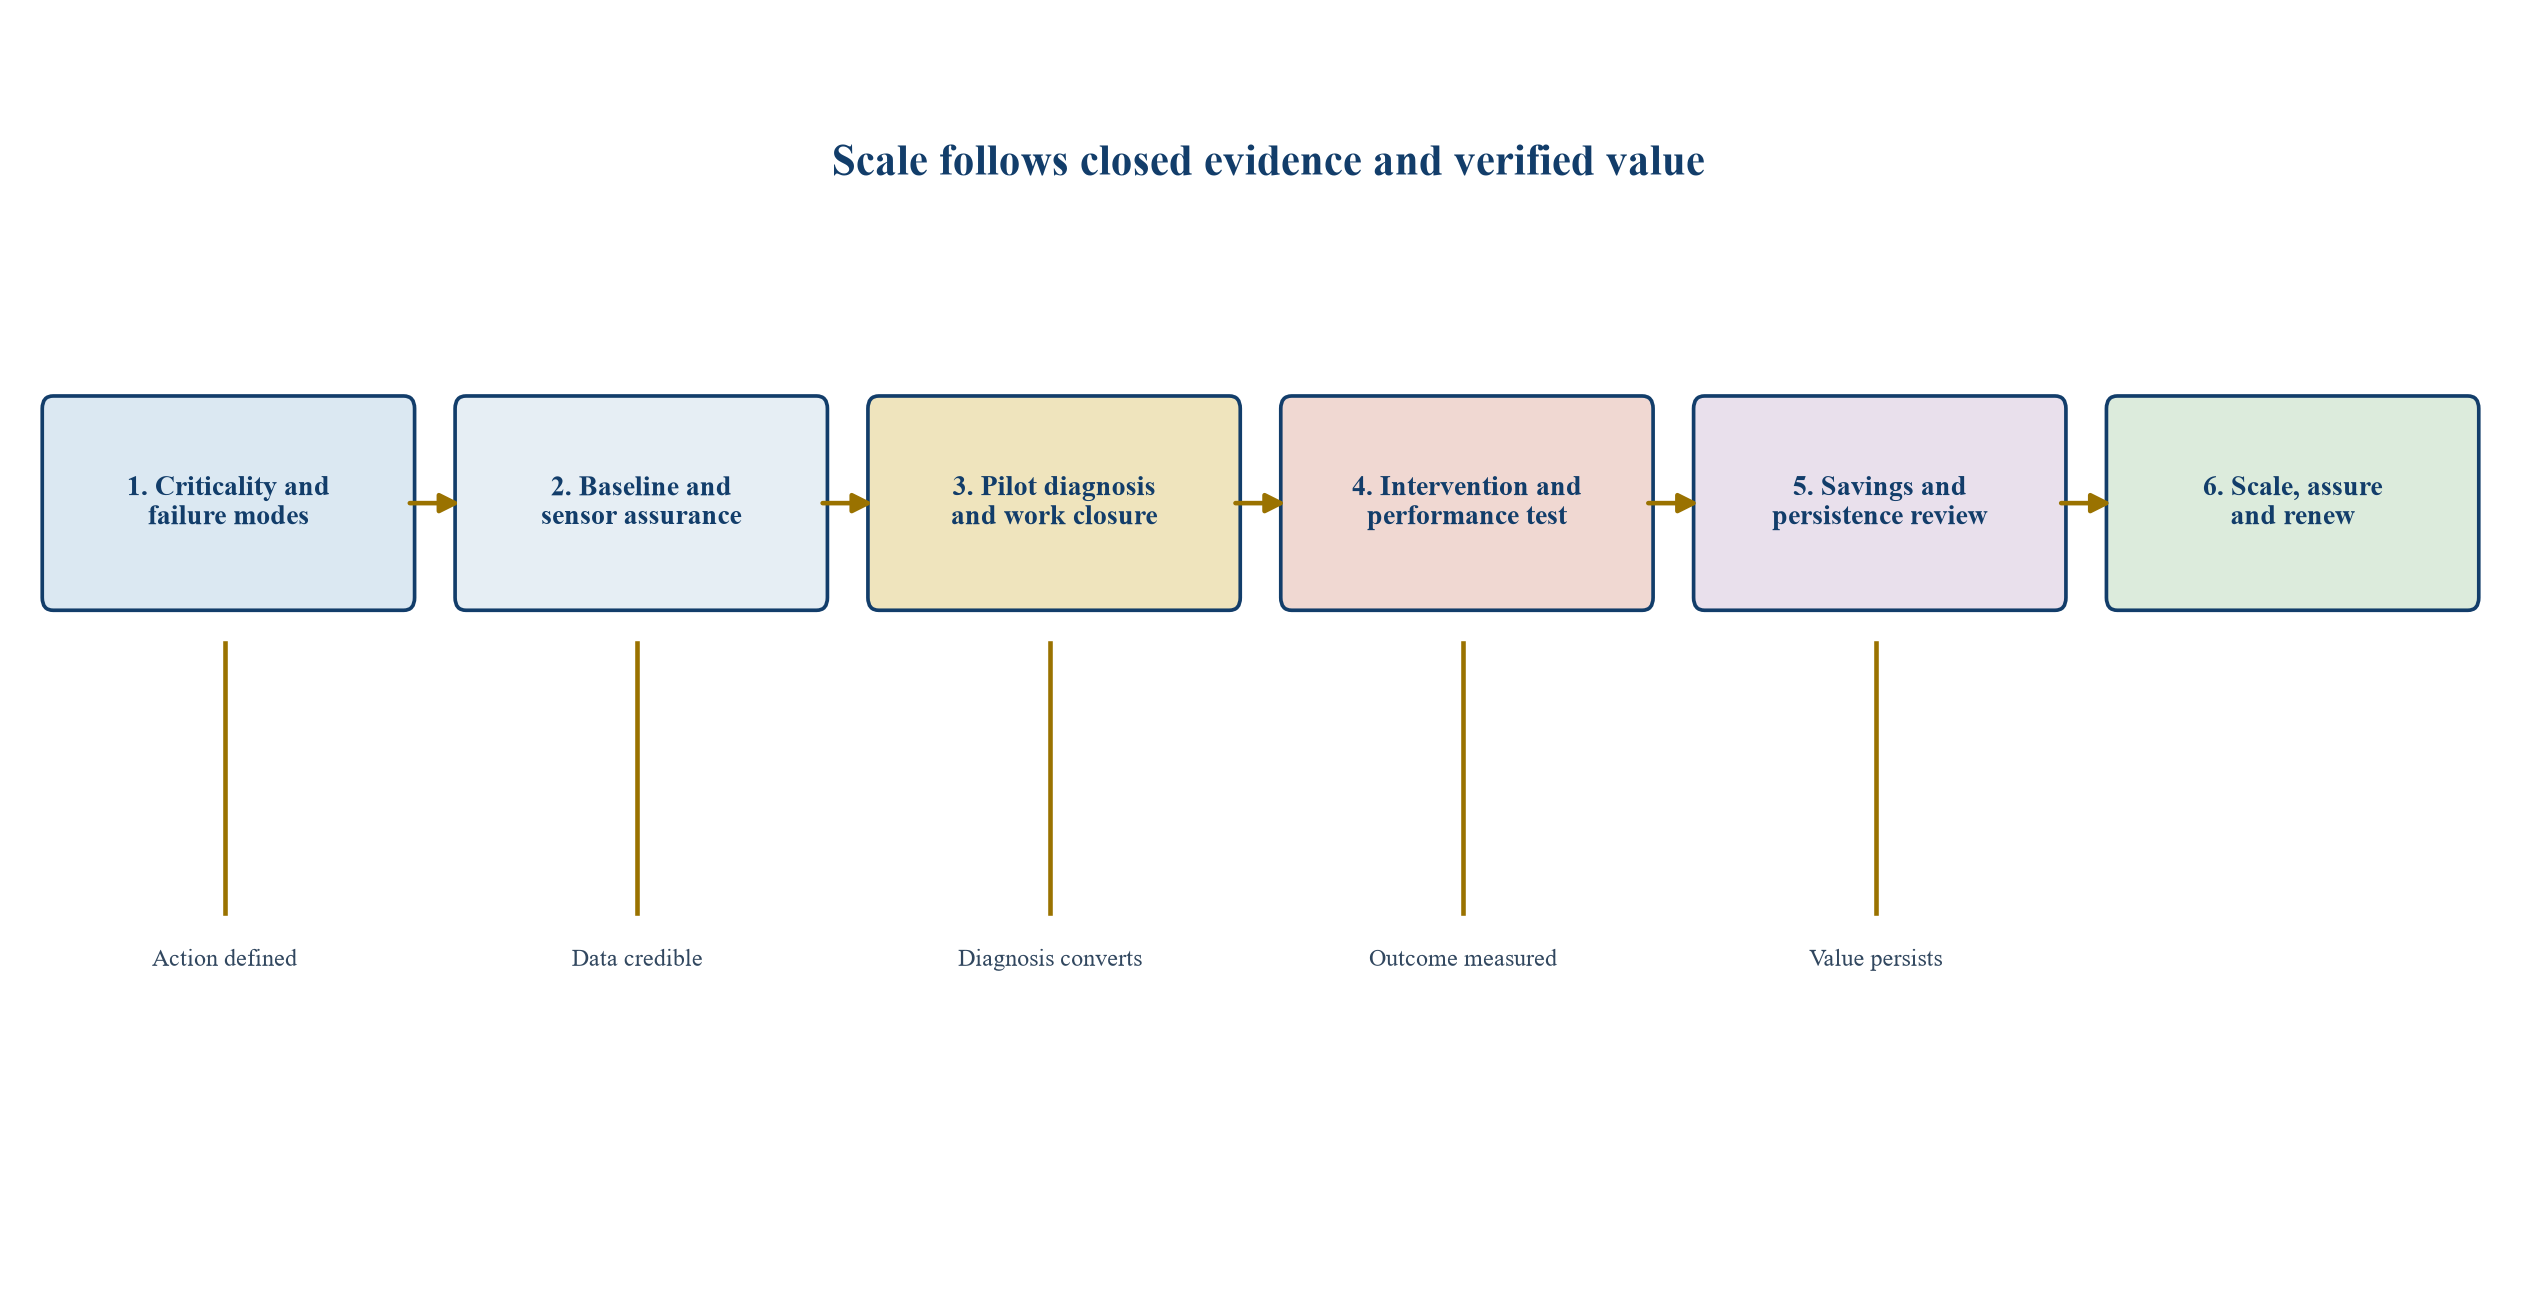
Generic roadmap; timing depends on asset access, data history, operating conditions and procurement.
77. First 90 days
The first phase should reconcile assets, approve criticality, select failure modes, validate measurement points, define baseline and test work-system integration. It should also establish cybersecurity and supplier terms before connecting field devices.
The output is an approved pilot with measurable decisions, not a fleet-wide technology commitment.
78. Twelve-month programme
The programme should pass through seasonal operating conditions, validate interventions, calculate normalized savings, review persistence and decide scale. It should update the capital plan with evidence from actual condition and performance.
Benefits should be recognized under the approved hierarchy. Scenario value should remain separate from verified cash savings.
79. Decision rule
Proceed when the failure mode is material, the signal is credible, lead time is actionable, work can be executed safely, the outcome can be measured and whole-life value exceeds full programme cost under reasonable sensitivities. Scale after persistence and governance are demonstrated.
Redesign or defer when data cannot distinguish condition from duty, alerts do not convert to verified work, or savings cannot be separated from service and operating changes.
80. Conclusion
Condition monitoring can connect pump health, energy and capital decisions when the evidence chain is complete. The decisive disciplines are system context, sensor assurance, engineering diagnosis, work closure, normalized measurement and persistence. Predictive labels alone do not create value.
The strongest programme defines the intervention before collecting data, protects essential service, funds the operating model, tests claims independently and releases capital against verified outcomes. This turns maintenance from an activity record into a source of defensible operating and investment performance.
81. Minimum viable evidence pack
The minimum pack for an investment decision should contain the asset and functional location, service criticality, failure mode, operating envelope, sensor and calibration record, alert history, engineering diagnosis, work order, intervention cost, pre- and post-work test, energy calculation, uncertainty and approval. Missing fields should remain visible rather than be replaced by undocumented assumptions.
This pack allows finance, engineering and assurance teams to test the same claim from source evidence. It also supports later review when operating conditions, suppliers or staff change.
82. Sensitivity discipline
The financial case should test electricity price, demand, hydraulic duty, degradation rate, maintenance cost, false-alert burden, implementation delay, persistence and discount rate. Reliability scenarios should vary event frequency, consequence and intervention effectiveness without presenting uncertain outcomes as observed facts.
The committee should identify the assumptions that change the decision. Where a single uncertain parameter drives approval, a targeted test or narrower pilot can have greater value than immediate scale.
83. Transfer across geographies
The technical chain applies across markets, while energy tariffs, water regulation, labour, procurement, cyber obligations, service standards and financing differ. A programme built in one jurisdiction should therefore be revalidated before transfer. Asset age and climatic conditions can also change failure patterns and operating ranges.
Cross-utility benchmarks are useful for questions and portfolio screening. Asset-specific evidence remains necessary for capital commitment and reported savings.
References
- United States Department of Energy. Improving Pumping System Performance: A Sourcebook for Industry, Second Edition. https://www.energy.gov/sites/default/files/2014/05/f16/pump.pdf
- United States Department of Energy. MEASUR. https://www.energy.gov/cmei/ito/measur
- United States Environmental Protection Agency. Power Resilience Guide for Water and Wastewater Utilities. Updated May 2023. https://www.epa.gov/waterresilience/power-resilience-guide-water-and-wastewater-utilities
- International Organization for Standardization. ISO 55001:2024, Asset management; Asset management system; Requirements. July 2024. https://www.iso.org/standard/83054.html
- Ofwat. Priority assets. https://www.ofwat.gov.uk/regulated-companies/price-review/asset-health/priority-assets/
- United States Environmental Protection Agency. Energy Efficiency for Water Utilities. https://www.epa.gov/sustainable-water-infrastructure/energy-efficiency-water-utilities
- United States Department of Energy. Pump Systems. https://www.energy.gov/cmei/ito/pump-systems
- United States Department of Energy. Maintain Pumping Systems Effectively, Pumping Systems Tip Sheet Number 5. October 2005. https://www1.eere.energy.gov/manufacturing/tech_assistance/pdfs/maintain_pumping_systemsts5.pdf
- United States Environmental Protection Agency. Energy Efficiency in Water and Wastewater Facilities. https://www.epa.gov/statelocalenergy/energy-efficiency-water-and-wastewater-facilities
- United States Environmental Protection Agency. Energy Management Guidebook for Wastewater and Water Utilities. https://nepis.epa.gov/Exe/ZyPURL.cgi?Dockey=P1003Y1G.TXT
- United States Department of Energy. Wastewater Energy Management Toolkit. https://betterbuildingssolutioncenter.energy.gov/wastewater-energy-management-toolkit
- United States Department of Energy. Wastewater Measure Evaluation. https://betterbuildingssolutioncenter.energy.gov/wastewater-measure-evaluation
- United Kingdom Environment Agency. Mechanical, Electrical, Instrumentation, Control and Automation: increasing operational efficiency. https://www.gov.uk/flood-and-coastal-erosion-risk-management-research-reports/mechanical-electrical-instrumentation-control-and-automation-meica-increasing-operational-efficiency
- United Kingdom Government. Water and treated water. https://www.gov.uk/government/publications/water-and-treated-water/water-and-treated-water
- National Institute of Standards and Technology. Digital twins. https://www.nist.gov/digital-twins
About the Author
Chennakeshav (CK) is a corporate finance and investment banking executive with 25+ years of global experience in deal origination, structuring and execution across M&A, growth capital and corporate strategy. He has led value-creation mandates for founders, corporates and funds — bridging the boardroom view to hands-on execution and close.
His career spans Morgan Stanley, HSBC, Lloyds Banking Group, EWEC, ADQ portfolio companies and Emirates Growth Fund, across TMT, real estate, fintech, deeptech, cleantech, infrastructure and energy. He has partnered with C-suite leaders, private equity and venture funds, sovereign wealth funds and family offices to finance complex fund raises and scale-up ventures, and has led M&A due diligence, post-merger integration and business-transformation initiatives to create value.
At Matchpoint Partners he is Managing Partner, leading the firm's corporate finance, M&A and capital-raising practice. He holds an MBA from London Business School, an engineering degree from VTU and a Master of Laws (LLM, in progress) from UCL London.
An active start-up mentor, CK mentors at Techstars, DIFC FinTech Hive, Startup Grind, Founder Institute and IN5, serves as Entrepreneur Mentor in Residence (EMiR) at London Business School, and judges the Entrepreneurship World Cup.
LinkedIn: https://www.linkedin.com/in/ckadya/
Profile: https://www.matchpoint-partners.com/team/ck-adya.html
