
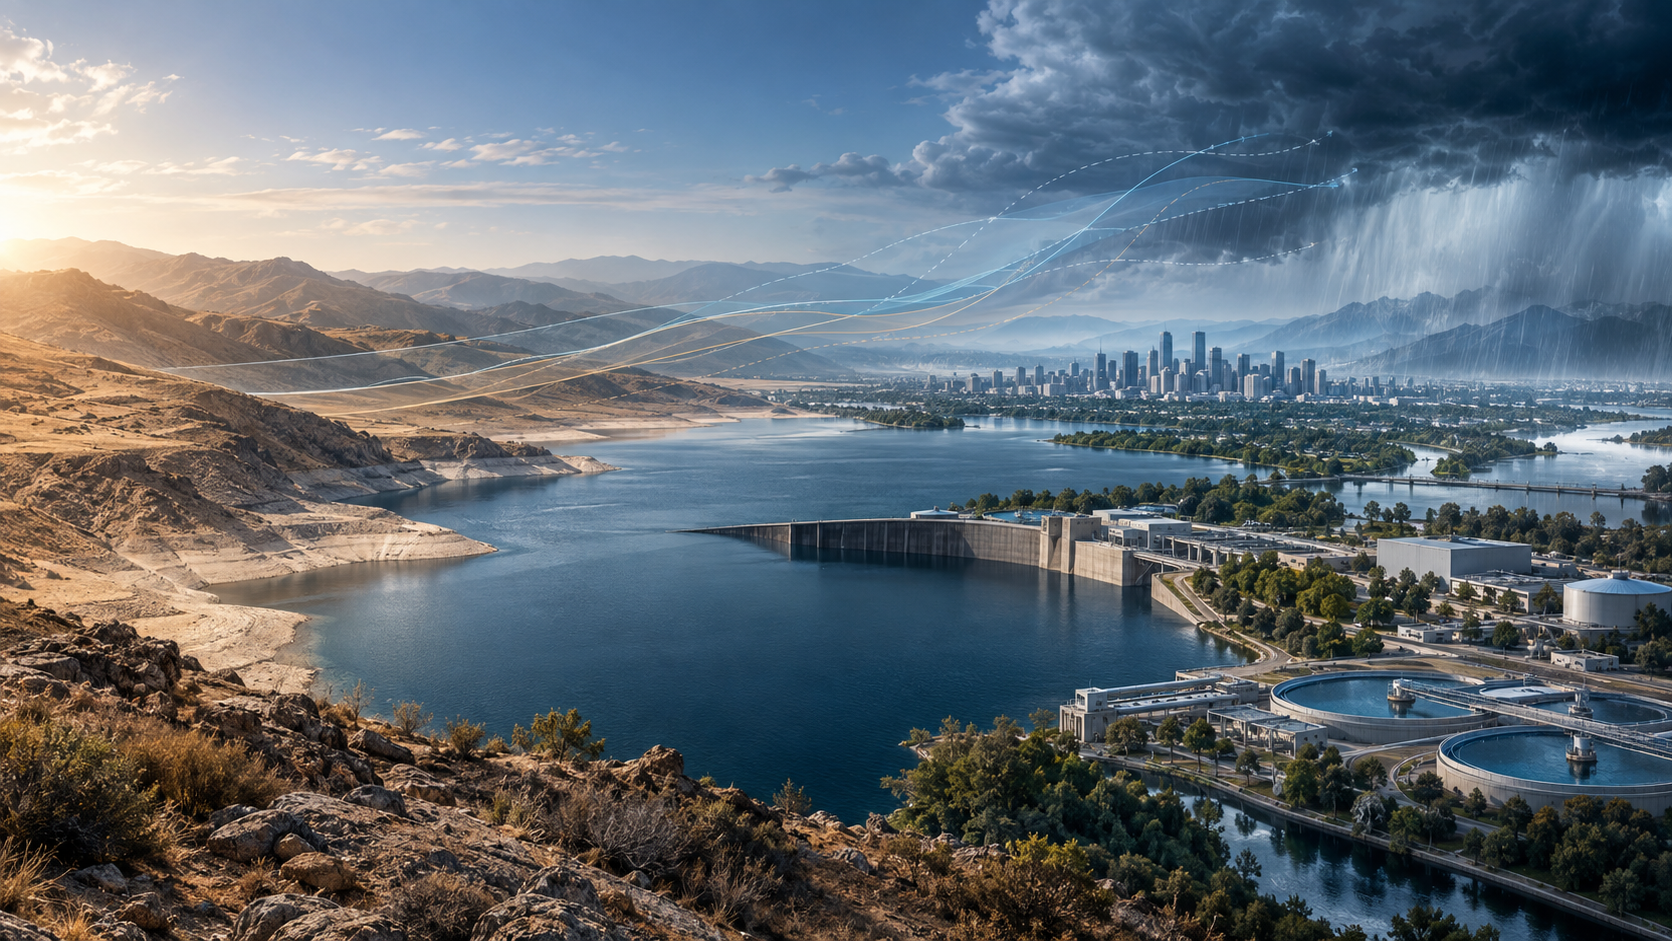
1. The planning decision
The central decision is not simply how much water a region may consume in a future year. It is which portfolio of supply, demand and network measures should be authorised now, which should be prepared for later, and what evidence should trigger each commitment. Capacity planning therefore combines engineering reliability, customer demand, environmental limits, financing capacity and institutional execution.
A defensible plan links every investment to a service outcome under specified conditions. It shows the consequence of acting too early, acting too late and choosing an option that performs poorly outside the central forecast.
2. Why history can mislead
Historic demand data remain valuable, but their explanatory relationships can change. Temperature, rainfall, restrictions, tariffs, leakage, household composition, tourism, industrial load and customer behaviour interact. A model calibrated to a stable period can understate peaks or overstate persistent growth when those relationships shift.
The planning question is whether the historic data-generating process remains representative. When it does not, extrapolation can create false precision. The remedy is a transparent combination of observed evidence, causal drivers, plausible scenarios and explicit uncertainty.
3. Climate volatility and water systems
The IPCC identifies climate-related changes in water availability, variability and extremes, including effects on urban water supplies and reservoir inflows [1]. A utility can face hotter demand peaks, lower dependable yield, more intense rainfall, deteriorating source quality and operational disruption within the same planning horizon.
These effects can be correlated. High temperature may increase demand while reducing surface-water availability. Heavy rainfall may replenish storage while simultaneously impairing raw-water quality or damaging assets. Capacity therefore needs to be tested as a system rather than as isolated annual averages.
4. Capacity has several meanings
Water capacity may refer to source yield, abstraction, treatment, conveyance, storage, distribution, reuse, desalination, emergency interconnection or demand reduction. A system can possess nominal capacity while lacking dependable capacity at the location and time of need.
Planners should state the capacity definition, unit, duration, availability condition, quality specification and delivery point. A headline volume without these attributes cannot support an investment decision.
5. The supply-demand balance
Ofwat describes water-resource planning as maintaining the long-term balance between supply and demand, with statutory plans covering at least 25 years [2]. The balance is an accounting framework, but each component carries uncertainty. Deployable output, outage, leakage, demand, headroom and environmental reductions may change together.
The balance should therefore be shown across scenarios and critical periods. Annual totals can conceal short seasonal failures, local constraints and multi-year drought exposure.
6. Decision architecture
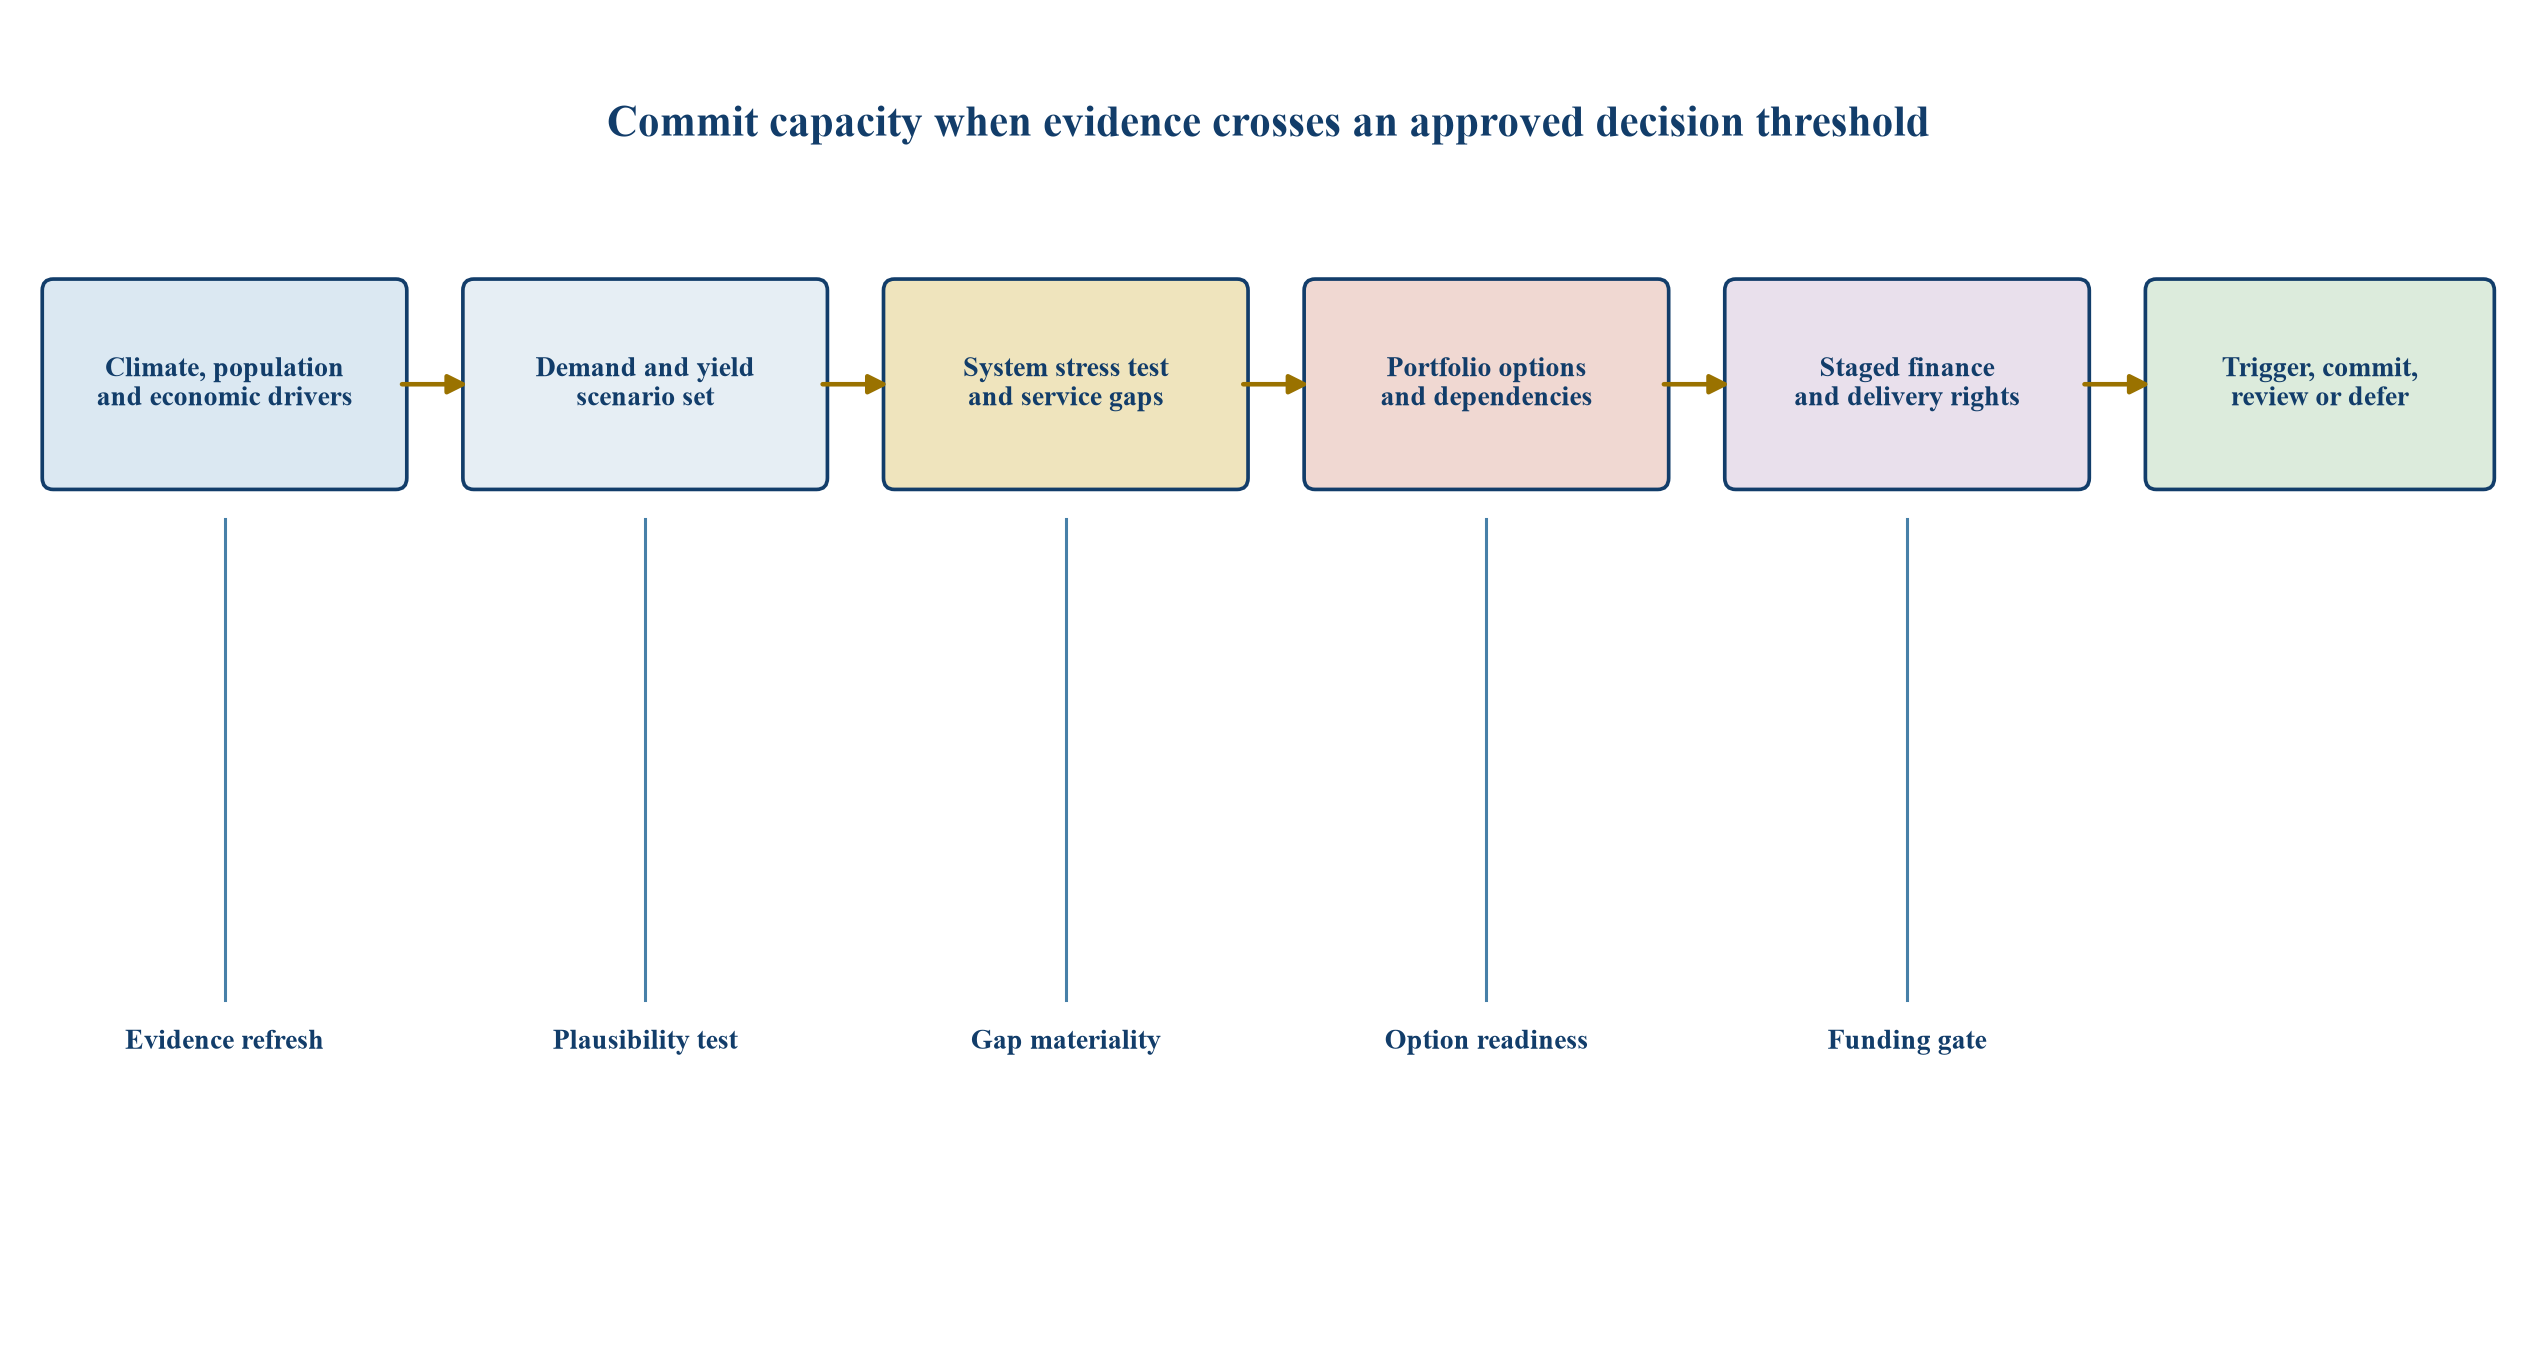
Generic framework; actual scenarios, thresholds and approvals depend on local law, hydrology, service standards and financing.
7. Start with service outcomes
The plan should define the reliability, water-quality, environmental and customer outcomes to be protected. These outcomes determine the stress events and performance metrics. A portfolio designed only to meet expected annual demand may fail a drought, treatment-outage or local-pressure standard.
Outcome definitions should specify geography, customer class, duration and acceptable recovery. They should also identify obligations that cannot be traded away through economic optimisation.
8. Segment demand
Aggregate consumption should be decomposed into household base use, weather-sensitive household use, commercial activity, industry, public services, tourism, construction, data centres and other material loads. Each segment has different drivers, elasticity and peak characteristics.
Segmentation improves both forecasting and intervention design. A conservation tariff may influence discretionary household use while leaving critical industrial or institutional demand largely unchanged.
9. Separate trend from weather
A demand model should distinguish structural growth from short-term weather response. Population, occupancy, appliance efficiency, economic composition and network leakage influence the baseline. Temperature, humidity, rainfall and restrictions influence temporary deviations.
The distinction matters because a sequence of hot years can be mistaken for permanent trend. A cool or wet calibration period can create the opposite error.
10. Population uncertainty
Population projections depend on migration, household size, development completion and occupancy. Regional totals may also conceal where new demand appears within the network. A system can have sufficient overall capacity and still require local reinforcement.
Planning should use multiple demographic cases and reconcile them with permitted development, connection applications and observable construction. Forecast governance should prevent aspirational development pipelines from becoming committed demand without evidence.
11. Economic and industrial demand
Industrial demand can be concentrated, discontinuous and contract-sensitive. A new semiconductor facility, energy project, food plant or data centre can change the load profile more than gradual household growth. Announced projects should be classified by development maturity, water intensity, connection rights and curtailment arrangements.
The forecast should preserve the difference between an enquiry, a permitted project, a financed project and an operating customer. Capacity rights should be priced and governed accordingly.
12. Peak demand
Peak-day and peak-hour demand can drive treatment, storage and network investment even when annual consumption is flat. Climate volatility can change the frequency, duration and spatial pattern of peaks. The model should test consecutive hot days, night-time recovery and simultaneous tourism or industrial load.
Peak reduction can have higher capacity value than the same annual volume saved at low-stress times. Demand programmes should therefore be measured against system coincidence.
13. Leakage as a capacity source
Leakage reduction can create deployable capacity, but its yield depends on network condition, pressure, detection, repair capacity and persistence. A theoretical leakage saving is not equivalent to a dependable source unless it survives operational verification.
The portfolio should distinguish identified leakage, economically recoverable leakage and verified sustained reduction. Financing should follow measured delivery and account for rebound or deterioration.
14. Demand management
Demand management includes metering, tariffs, efficiency devices, building standards, customer engagement, industrial reuse and restrictions. Its value depends on additionality, persistence, timing and customer acceptance. A programme may reduce average use while leaving the critical peak largely intact.
Ofwat's planning framework explicitly considers reducing demand alongside increasing supplies [2]. The investment case should compare both on a common service basis.
15. Source yield
Source yield should reflect hydrology, licence conditions, environmental requirements, asset availability and water quality. Historic abstraction or plant nameplate capacity can overstate dependable output. Climate stress may reduce yield directly or change the treatment burden.
Each source should be represented by a range of output states and correlated dependencies. Sources that share a catchment, power system or intake may fail together.
16. Water quality as capacity
Poor raw-water quality can constrain production before physical water availability becomes scarce. Algal blooms, salinity, turbidity, wildfire effects and contaminant events can increase treatment needs or cause outages. Quality-related derating belongs in the capacity model.
Investment options may include pretreatment, blending, alternative intake, process redundancy and source protection. Their value should be assessed under the same scenarios as new volume.
17. Environmental constraints
Abstraction limits can tighten as ecological evidence, legal standards and climate conditions change. A plan should identify which yield depends on regulatory permissions and what happens if those permissions are reduced or delayed.
Environmental constraints are decision variables with governance and timing, rather than residual adjustments. Early engagement and alternative pathways can reduce the risk of late portfolio failure.
18. Compound stress
The system should be tested against compound events such as drought plus heat, source outage plus demand peak, flood plus water-quality deterioration, or power disruption plus low storage. Independent stress assumptions can materially understate vulnerability when drivers are correlated.
Scenario narratives should explain the causal chain and duration. The objective is a credible operating challenge, not an arbitrary multiplication of conservative factors.
19. Scenario set
Table 1. Illustrative scenario architecture for capacity planning
| Scenario | Demand state | Supply state | Operating challenge | Planning use |
|---|---|---|---|---|
| Stable transition | Moderate growth and efficiency | Expected yield | Deliver planned improvements | Base sequencing |
| Hot-growth pressure | High population and repeated heat | Moderately reduced yield | Persistent peaks and local constraints | Accelerated demand and network actions |
| Dry-system stress | Moderate demand | Low multi-year yield | Storage depletion and environmental limits | Strategic supply and transfer test |
| Compound shock | High peak plus critical load | Source and power disruption | Short-duration service failure | Emergency and redundancy design |
| Low-demand transition | Efficiency and slower growth | Expected yield | Stranded or underused assets | Deferral and modularity test |
The scenario set should be small enough to govern and broad enough to expose different decisions. Each scenario needs a coherent combination of drivers rather than independent high and low switches.
20. Probabilities and plausibility
Decision makers may request a probability for every scenario, but long-horizon climate, technology and policy changes can make precise probabilities fragile. Probability ranges can be useful where evidence supports them. Robustness testing can support decisions when it does not.
The board should see which conclusions depend on probability assumptions and which options perform acceptably across the whole plausible set.
21. Headroom
Planning headroom covers uncertainty that is material to the supply-demand balance. It should be derived transparently and should not become a blanket percentage that hides weak inputs. Double counting can occur when conservative demand, conservative yield and an additional margin address the same uncertainty.
Headroom should be decomposed by source and reviewed as evidence improves. Some uncertainty can be reduced through monitoring or option development rather than physical capacity.
22. Forecast error
Back-testing should compare prior forecasts with actual demand and explain errors by driver. The purpose is governance and model improvement, rather than retrospective blame. A model can miss because assumptions changed, data were weak or relationships were unstable.
Error analysis should include annual volume, peak timing, geography and customer segment. Persistent bias should change the model or decision margin.
23. Model ensembles
An ensemble can compare econometric, end-use, machine-learning and scenario models. Agreement across methods provides useful evidence, while divergence identifies assumptions requiring attention. Complexity does not guarantee better decisions.
Every model should have documented data, transformations, limitations, validation and approved use. Machine-learning forecasts require particular care when future conditions extend beyond the training range.
24. Data architecture
The planning dataset should connect customer demand, weather, leakage, source yield, water quality, outages, development and asset constraints. Time, location, units and revisions must be controlled. Aggregated data can conceal the operating mechanism.
The model should preserve lineage from reported result to source evidence. This allows assurance, refresh and challenge when conditions change.
25. Monitoring leading indicators
Useful indicators include per-capita consumption, peak coincidence, storage trajectory, source recovery, groundwater level, leakage persistence, connection commitments, industrial project maturity and environmental restrictions. Each indicator should map to a decision.
A dashboard without pre-agreed action thresholds can create observation without adaptation. Trigger governance should specify owner, review frequency, evidence window and permitted response.
26. Adaptive pathways
An adaptive pathway sequences decisions under uncertainty. Near-term actions protect resilience and preserve future choices. Later actions are activated when observable conditions show that the current pathway is insufficient or another path has become preferable.
EPA climate-resilience guidance emphasises risk assessment and adaptation strategies, while its financial-resilience work highlights scenario analysis and flexible approaches [3][4]. The pathway converts those principles into capital governance.
27. No-regret actions
No-regret actions provide value across most plausible scenarios. Examples may include leakage control, meter data improvement, source monitoring, critical maintenance, emergency planning, land protection and option design. Their case still requires cost, deliverability and outcome evidence.
The label should not excuse weak economics. It means the action is robust to uncertainty, not that it is free or universally beneficial.
28. Option creation
Option creation may include permitting, land acquisition, pilot treatment, interconnection design, environmental studies, procurement frameworks and reserved manufacturing capacity. These expenditures can reduce lead time without committing the full project.
Their value is the decision flexibility created. The approval paper should state the future right, expiry, cost and conditions under which the option will be exercised or abandoned.
29. Modular capacity
Modular treatment, reuse, desalination or storage can align increments with observed need. Modularity may reduce stranded-capacity risk, though unit costs, interfaces and operating complexity can be higher.
The comparison should include scale economics, delivery time, site constraints, expansion disruption and financing. A modular design has value only when later modules can actually be permitted, connected and funded.
30. Strategic capacity
Large reservoirs, transfers and desalination plants can provide strategic resilience beyond near-term utilisation. Their case depends on system value, option scarcity and long lead times. Low initial utilisation does not automatically mean waste if the asset protects an outcome that smaller measures cannot.
The investment decision should separate expected utilisation value, resilience value and future option value. Each component needs evidence and governance.
31. Portfolio construction
The portfolio should combine demand, leakage, network, source, storage, transfer, reuse and emergency measures. Diversification is valuable when options respond differently to stress. A portfolio of projects sharing the same power, catchment or contractor may appear diverse while retaining common failure exposure.
Dependencies should be mapped before optimisation. Portfolio value arises from delivered system performance rather than project count.
32. Capacity economics
Table 2. Hypothetical economics for alternative capacity pathways
| Pathway | Initial commitment | Indicative dependable capacity | Earliest service | Decision interpretation |
|---|---|---|---|---|
| Demand and leakage programme | USD 120m | 70 units | 2 years | Fund in stages against verified persistence |
| Modular reuse | USD 260m | 110 units | 4 years | Preserve expansion right for later modules |
| Regional transfer | USD 780m | 260 units | 8 years | Secure permits and route before full commitment |
| Strategic desalination | USD 1,150m | 330 units | 7 years | Test power, intake, brine and utilisation risk |
The figures are hypothetical and illustrate decision structure only. They are not benchmarks, expected results or descriptions of a real project. A specific case requires local cost, yield, schedule, regulatory and financing evidence.
33. Levelised cost limitations
A levelised unit cost can support comparison, but it can omit timing, reliability, peak contribution, network location, flexibility and correlated risk. A lower average cost option may have less value during the event the plan must survive.
The decision model should show both unit economics and system contribution. Assumptions about utilisation and discount rate need particular scrutiny for large assets.
34. Avoided cost
Demand reduction and leakage control may avoid treatment, pumping, network and source investment. Avoided cost should be counted only when the relevant capacity can genuinely be deferred or cancelled. Savings that do not change an approved capital or operating decision are weaker benefits.
The financial model should identify the affected project, timing and probability of avoidance. This guards against double counting.
35. Stranded-capacity risk
Stranding can result from lower demand, regulation, technology, cost escalation, environmental constraints or a better alternative. The risk is greatest when commitment is large, irreversible and based on one forecast.
Mitigation includes staging, modularity, flexible contracts, transferable equipment, multiple uses and decision gates. The residual risk should be visible to lenders and equity providers.
36. Delay risk
Deferral preserves capital but can create service, cost and schedule exposure. Long-lead infrastructure may need commitment before the central forecast shows a deficit. The decision should compare the cost of early capacity with the expected and tail cost of late delivery.
Critical-path permitting, land, connection and procurement activities can be advanced separately from construction to reduce delay risk.
37. Real-options logic
Real-options analysis values the ability to wait, expand, contract, switch or abandon. It is useful when uncertainty is material and management can respond. The analysis should specify the action right and observable trigger rather than attaching an abstract option premium.
Governance determines whether the option is real. An expansion right without land, permit, interface or funding capacity may have little practical value.
38. Financing structure
Financing should follow risk allocation and stage. Early studies may require sponsor or public funding. Construction can use project finance, corporate debt, regulated capital or blended structures where revenue and delivery risks support them. Contingent capacity may benefit from availability arrangements or option payments.
The capital structure should remain resilient under slower demand, delayed commissioning, cost overrun and adverse climate conditions.
39. Revenue and tariff risk
Water infrastructure often recovers cost through regulated tariffs, public budgets or contracted charges. Capacity built ahead of utilisation can create affordability and political pressure. Demand reduction can also reduce volumetric revenue while improving resilience.
The business model should reconcile conservation incentives with fixed-cost recovery. Scenario analysis should show bills, coverage and liquidity under different demand paths.
40. Lender diligence
Lenders should review demand evidence, dependable yield, licence and environmental conditions, construction interfaces, revenue recovery, reserve policy and climate stress. They should distinguish project completion from system usefulness.
Covenants can require reporting on triggers, option readiness and resilience metrics. A debt structure that assumes uninterrupted high utilisation may be poorly matched to adaptive capacity.
41. Equity case
Equity investors should understand the source of return, regulatory or contractual protections, downside allocation and reinvestment needs. Growth in demand can support value, but resilience assets may earn through availability or regulated service rather than merchant volume.
The valuation should test multiple utilisation paths and terminal assumptions. Climate resilience should be connected to cash-flow protection, not treated as an unsupported premium.
42. Public value
Capacity decisions affect health, economic continuity, environmental outcomes and regional development. These benefits may not be fully captured in project cash flow. Public support can be justified when the benefit and accountability are explicit.
The appraisal should separate financial, economic and distributional effects. Transparency helps prevent broad public-value language from masking weak delivery.
43. Procurement model
Procurement can bundle design, construction, operation and performance, or allocate them separately. The chosen model should match uncertainty. A rigid output specification may be unsuitable when future modules or operating regimes are uncertain.
Contracts should address change rights, data access, interface ownership, performance testing, climate assumptions and termination. Competitive tension should be preserved where later phases remain optional.
44. Performance payment
Payment should connect to dependable service, quality, availability and sustained capacity where measurable. Construction milestones alone do not prove system value. Demand programmes need credible baselines and persistence tests.
The measurement and verification plan should be agreed before bids are compared. It should cover data, weather normalisation, customer changes and independent review.
45. Delivery capacity
An ambitious portfolio can exceed permitting, engineering, contractor, supply-chain and operating capacity. Programme sequencing should reflect scarce skills and common interfaces. Simultaneous projects can compete for the same land, power or approvals.
The capacity plan therefore requires an execution-resource plan. Delivery constraints can change which portfolio is optimal.
46. Regional interdependence
Transfers and shared sources can improve resilience, but they create counterparty and governance dependencies. The same regional drought may reduce export availability. Allocation rules during scarcity should be specified in advance.
Ofwat's regional planning approach recognises the value of coordinated solutions and water trading [2]. Contractual rights must still survive the stress event.
47. Emergency capacity
Emergency capacity includes temporary treatment, tankering, interconnections, reserve wells, mutual aid and demand restrictions. It can reduce the need for permanent redundancy when mobilisation is credible.
Plans should test logistics, quality, duration, customer priority and command authority. A listed emergency measure without exercised capability is weak evidence.
48. Climate data selection
Climate scenarios should be relevant to the asset location, timescale and decision. Downscaled projections can support utility planning, according to EPA financial-resilience guidance [4]. Their limitations and model range should remain visible.
Selection should avoid choosing one climate path because it supports a preferred project. Multiple plausible states should test robustness and adaptation.
49. Stress-test matrix
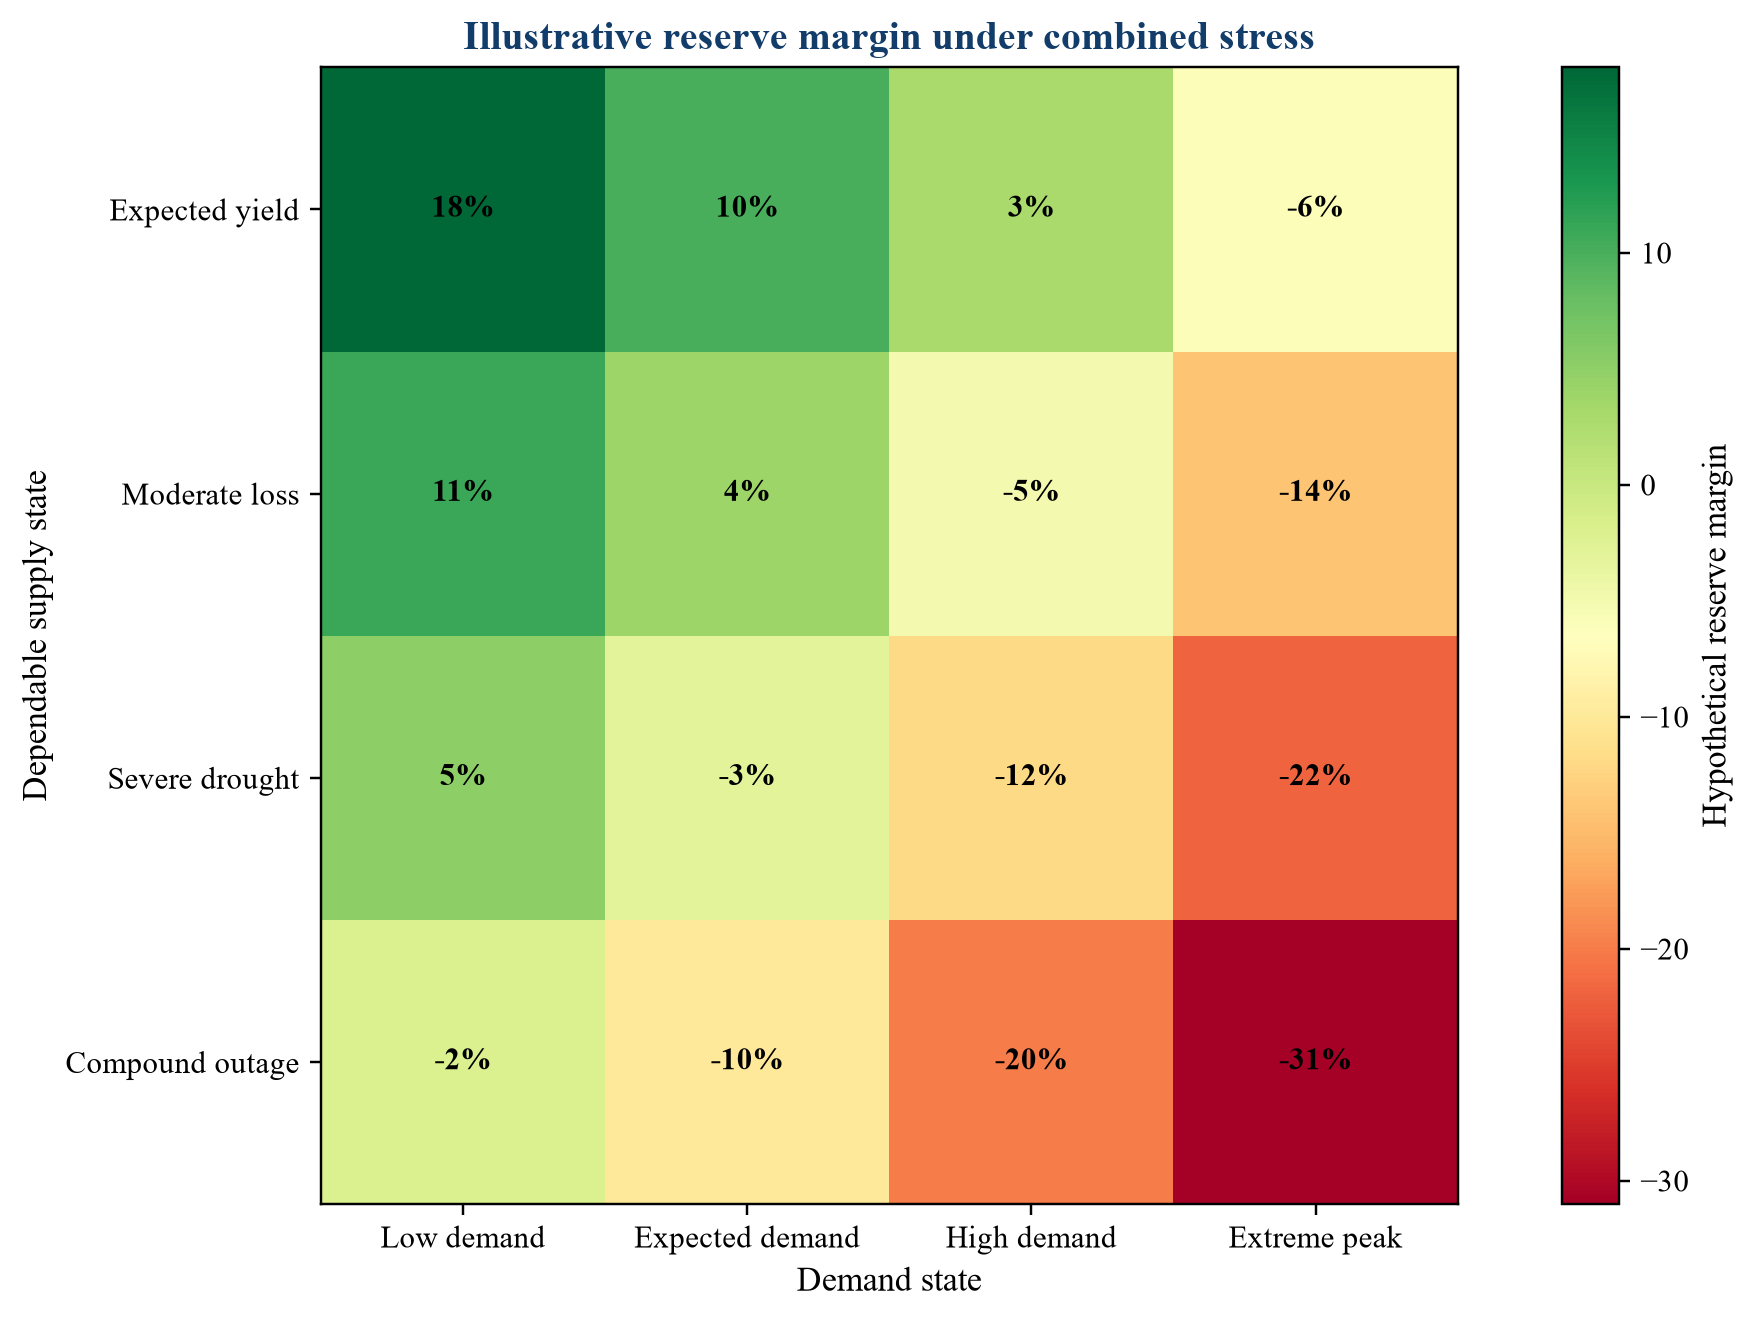
Illustrative index only; values do not describe an actual utility, market or forecast.
The matrix makes correlation and tipping points visible. It should be repeated by zone and critical period rather than treated as one system-wide answer.
50. Sensitivity design
Sensitivity analysis should vary the drivers that can change the decision: demand growth, peak response, yield, schedule, cost, power price, tariff recovery and option readiness. Arbitrary percentage movements provide less insight than causal ranges.
Results should show when the preferred portfolio changes. That boundary is more useful than a large volume of unchanged outputs.
51. Decision triggers
Triggers should be observable, material and early enough to permit action. Examples include a sustained demand threshold, storage trajectory, licence decision, connection commitment, drought indicator, project cost movement or delay in another option.
A trigger should specify measurement, period, owner and authority. It should also identify conditions requiring review rather than automatic commitment.
52. Trigger dashboard
Table 3. Illustrative capacity trigger register
| Trigger | Evidence window | Decision | Lead time protected | Governance owner |
|---|---|---|---|---|
| Peak demand exceeds pathway band | Two summer seasons | Advance modular capacity | Four years | Utility investment committee |
| Dependable yield falls below approved range | Updated hydrology and licence review | Accelerate transfer option | Six years | Water resources director |
| Critical industrial load reaches financial close | Executed connection and credit package | Reserve local treatment and network capacity | Three years | Commercial and capital committee |
| Demand programme under-delivers | Independent persistence test | Expand supply portfolio | Five years | Board resilience committee |
| Strategic project cost exceeds tolerance | Validated market bids | Redesign, rephase or select alternative | Decision-specific | Programme sponsor |
The register connects evidence to authority. It should be updated as options, lead times and market conditions change.
53. Governance cadence
The board should approve the scenario set, service standard, portfolio, triggers and risk appetite. Management should refresh evidence and recommend action at a defined cadence. Independent assurance should test material models and benefit claims.
Governance should allow timely decisions during emerging stress while preserving accountability. Emergency authority and later ratification need clear boundaries.
54. Model risk management
The forecasting and optimisation models should have owners, approved uses, validation, change control and limitations. Inputs and assumptions should be versioned. Material changes should be reproducible.
Model risk increases when outputs become embedded in financing or regulatory commitments. Independent challenge should focus on the decision sensitivity of assumptions.
55. Implementation roadmap
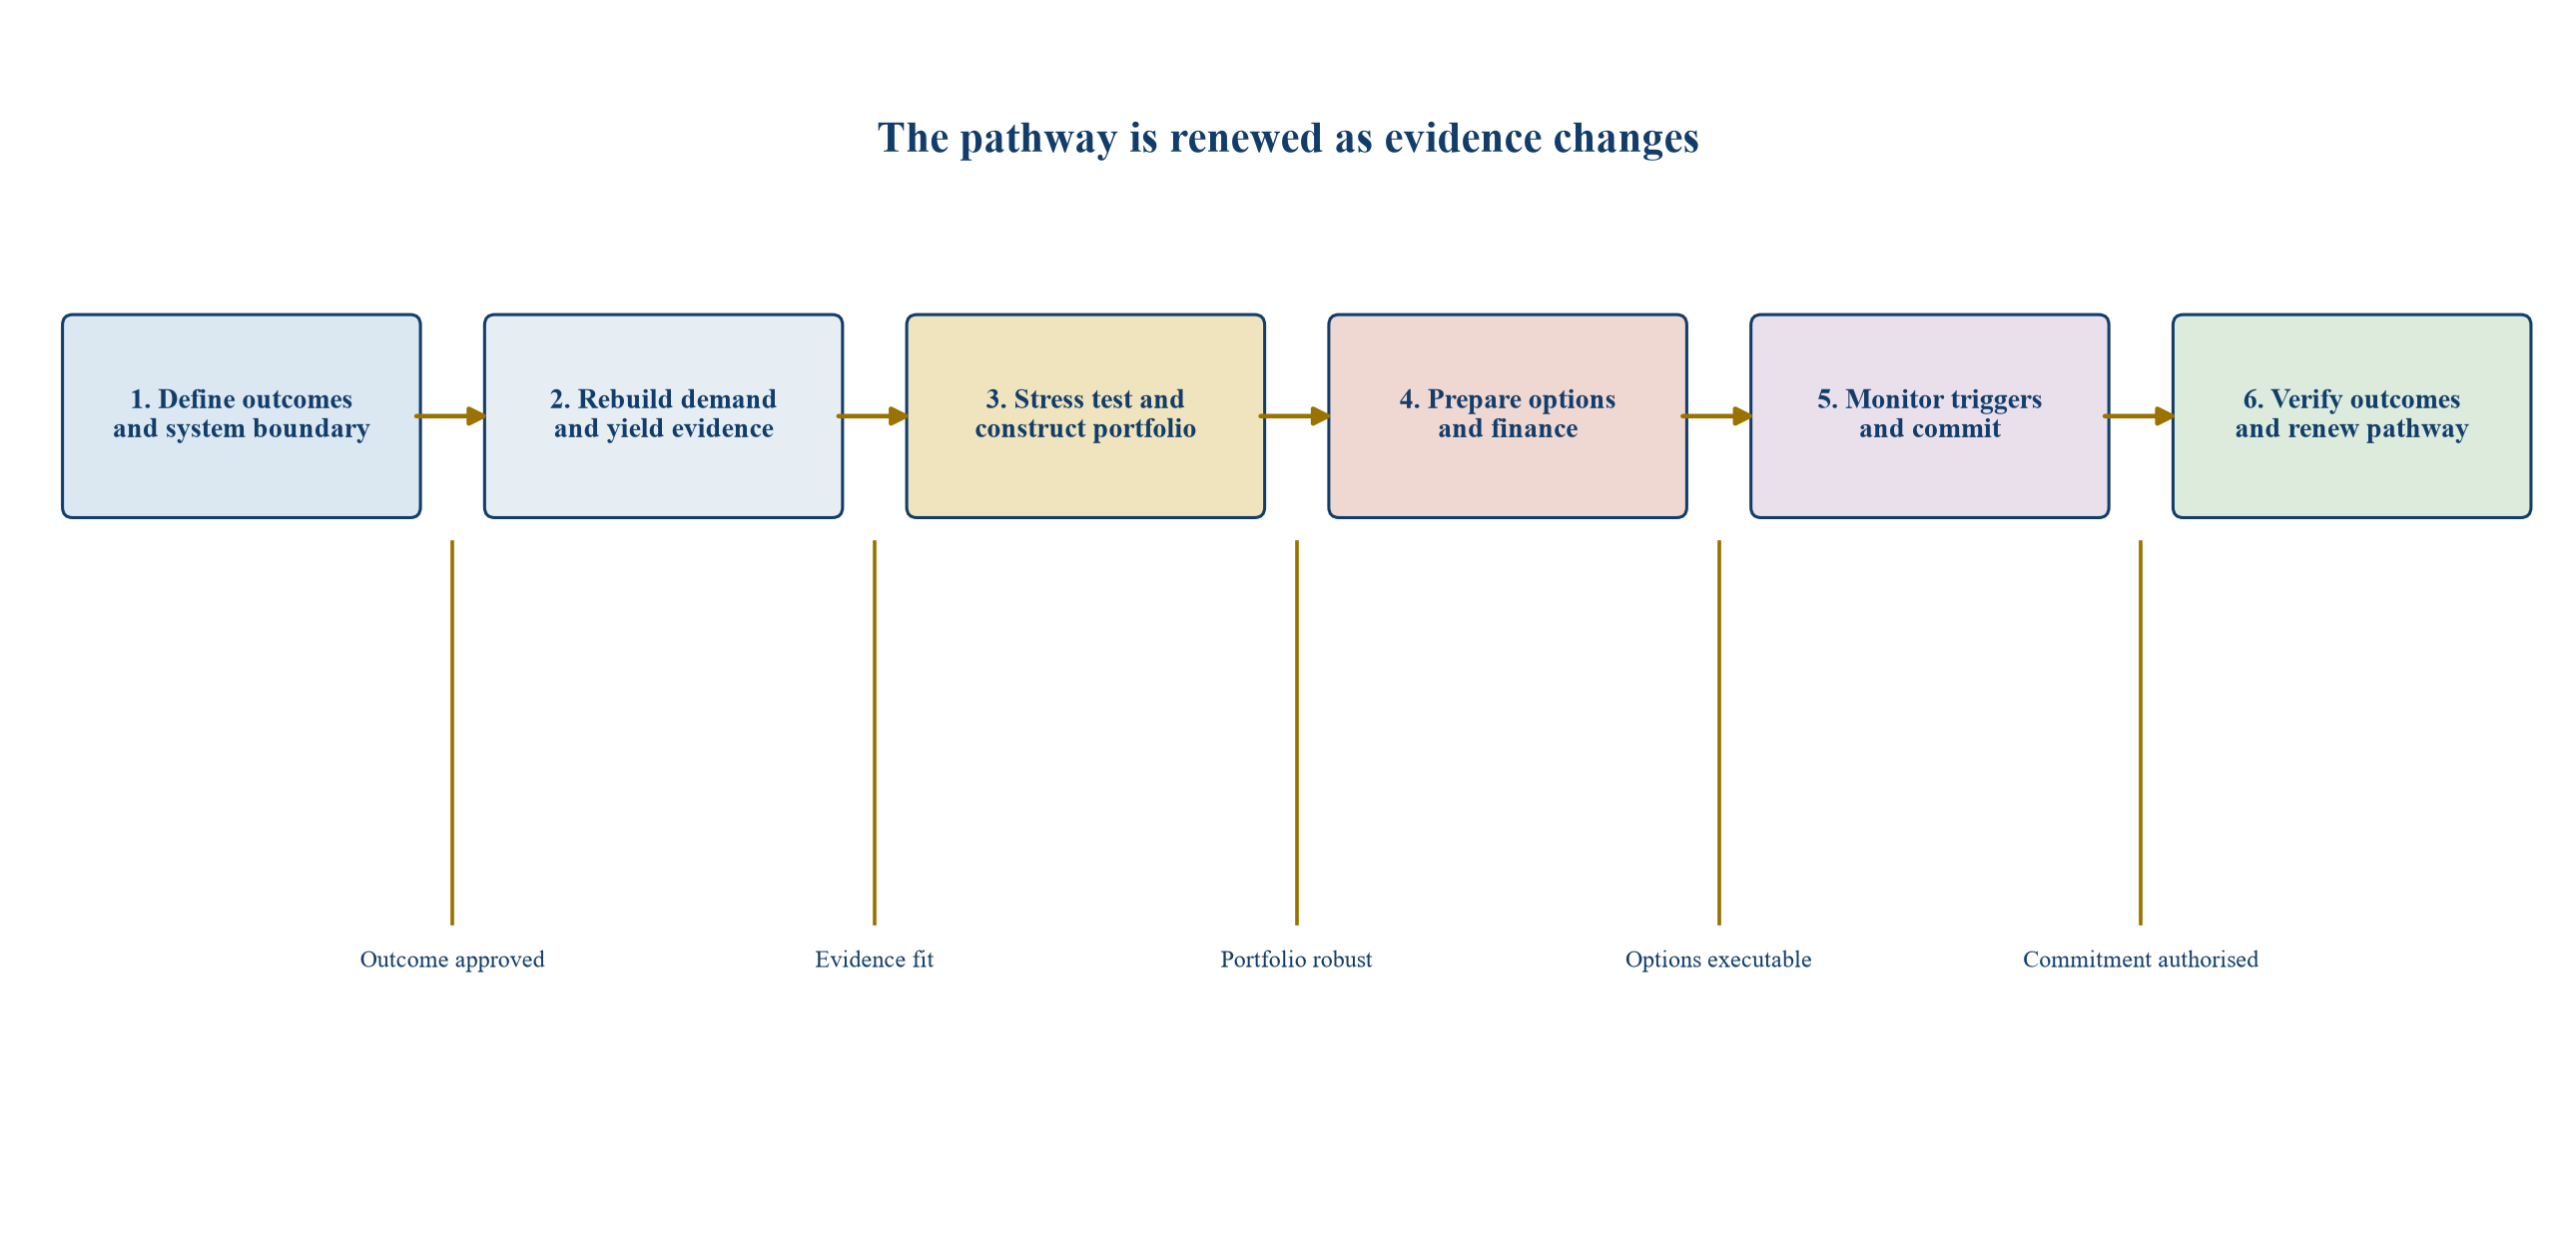
Generic roadmap; timing depends on data readiness, permits, option lead times, procurement and financing.
56. First 90 days
The first phase should reconcile demand, weather, leakage, yield, quality, outages, development and existing projects. It should define service outcomes, critical zones, model ownership and immediate data defects. Historic forecasts should be back-tested.
The deliverable is a decision baseline, not a new single-point forecast. It should identify current vulnerabilities, option lead times and decisions that cannot wait for perfect information.
57. Six-month programme
The programme should build the scenario set, stress-test the system, screen portfolio options, establish trigger metrics and begin high-value option-development work. Finance, regulation, operations and customer teams should participate with engineering.
The investment committee should receive a comparison of current policy, robust pathway and alternative portfolios, with assumptions and unresolved evidence clearly stated.
58. Twelve-month programme
Within twelve months, the utility should have an approved adaptive pathway, funded near-term actions, executable contingent options and a monitoring cadence. Procurement and financing documents should preserve staging rights and data access.
The programme should also test emergency response and establish independent assurance for material forecasts and benefits.
59. Common failure patterns
Common failures include extrapolating one historical trend, using annual averages for peak decisions, counting announced developments as certain, treating nameplate capacity as dependable yield, assuming demand savings persist, ignoring correlated failure and postponing long-lead options until a deficit is certain.
Each failure can be addressed through explicit evidence classes, scenarios, dependencies and gates.
60. Diligence request list
The diligence pack should include historic demand by segment and zone, weather data, forecast versions, model validation, leakage evidence, source-yield methodology, licences, water-quality constraints, outage records, development commitments, service standards, capital projects, option studies, procurement plans and financing assumptions.
Site inspection and interviews should test whether documented capacity is operationally available. Data-room completeness does not establish physical deliverability.
61. Investment committee questions
The committee should ask which outcome is at risk, under which scenario, when action becomes irreversible, which assumptions change the decision, how options are preserved, what triggers commitment, who owns delivery and how customers bear cost.
It should also ask what evidence would justify deferral. A balanced decision process tests both investment and non-investment cases.
62. Transfer across geographies
The framework applies across regulated utilities, municipal systems, industrial zones and private concessions. Hydrology, tariffs, governance, data quality, environmental law and financing differ. The method should transfer, while parameter values and decision rights require local evidence.
Arid systems may emphasise desalination, reuse and power dependency. Wetter systems may still face drought, quality, storage and environmental constraints.
63. Role of analytics and AI
Analytics can improve segmentation, anomaly detection, weather response, asset performance and scenario exploration. AI models can help identify nonlinear patterns, but extrapolation beyond training data is dangerous when climate relationships shift.
Decision-grade use requires lineage, validation, monitoring and human accountability. The model should support adaptive judgement rather than conceal assumptions behind technical complexity.
64. Innovation governance
New treatment, reuse, storage, sensing and forecasting technologies should enter through a controlled evidence pathway. Pilots need hypotheses, comparison methods, operating conditions, data rights and exit criteria. Successful pilots should demonstrate system contribution and integration readiness.
Innovation value depends on adoption and dependable performance. A demonstration without a route to procurement, permitting and finance provides limited capacity value.
65. Conclusion
Historic demand is evidence, but it is no longer a sufficient decision rule where climate, population, technology and source conditions are volatile. Water-capacity planning becomes more defensible when it replaces a single forecast with a governed set of plausible states, system stress tests, portfolio options and observable commitment triggers.
The strongest pathway funds no-regret resilience, prepares long-lead options and commits irreversible capital only when evidence supports the decision. It also recognises the cost of delay and protects service outcomes that cannot wait for certainty.
For every material capacity decision, the approval should record the outcome protected, scenario coverage, dependable contribution, key dependencies, trigger, financing gate, accountable owner and next review date. This keeps capital allocation connected to changing evidence throughout the planning horizon.
66. Assurance of the demand baseline
The demand baseline should be independently reconciled to billed consumption, bulk meters, production, storage movements and leakage estimates. Differences need an explained water balance rather than an unexplained adjustment. The review should test meter coverage, estimated readings, customer classification, vacancy, illegal use and boundary changes. Where historical records are incomplete, the limitation should remain visible in the forecast range.
Baseline assurance also requires consistent weather normalisation. A selected reference year can materially influence apparent efficiency and growth. The committee should see the unadjusted record, the normalisation method and the sensitivity of the capacity decision to that choice.
67. Distributional and affordability effects
Demand measures and capacity charges can affect customer groups differently. Higher fixed charges may improve revenue stability while placing pressure on low-consumption households. Scarcity tariffs can reduce discretionary use while creating hardship where basic needs or cooling requirements are high. Industrial curtailment may protect household supply while affecting employment and economic output.
The pathway should include affordability analysis, essential-use protections and transparent allocation principles. Distributional effects should be considered alongside engineering and financial efficiency, particularly where public support or regulated cost recovery is requested.
68. Power-water dependency
Treatment, desalination, pumping and reuse can create significant power dependency. A capacity option that improves water resilience while concentrating electricity exposure may transfer rather than reduce system risk. The stress test should examine grid outage, fuel constraints, power-price volatility and renewable intermittency where relevant.
Mitigation may include storage, backup generation, diversified connections, demand response, energy recovery and contractual protection. The financial case should show energy intensity and cost under each operating state, including low utilisation and emergency operation.
69. Updating the pathway after a shock
A drought, flood, contamination event, major customer connection or project delay should trigger a structured pathway review. The review should separate temporary disturbance from evidence of a changed long-term relationship. Immediate operational action may be required before the investment forecast is revised.
The post-event record should capture observed system performance, forecast error, emergency measures, customer response and asset constraints. This evidence can strengthen future scenarios and reveal options whose practical value differed from the plan.
70. Reporting to capital providers
Capital providers need a concise bridge from climate and demand evidence to cash flow, covenant resilience and capital timing. Reporting should show the approved scenarios, dependable capacity, utilisation range, trigger status, project readiness, cost exposure, tariff or contractual recovery and material changes since approval.
The report should distinguish realised operating evidence from assumptions and future management actions. This discipline supports informed financing decisions and reduces the risk that broad resilience claims substitute for measurable project performance.
71. Land and corridor preservation
Future capacity frequently depends on land, intake locations, pipeline corridors, grid connections and rights of way that can become unavailable long before construction is approved. Preserving these physical options can be a proportionate early action when the full project remains contingent. The decision should document acquisition or reservation cost, expiry, alternative use and environmental implications.
Option preservation also needs community and planning engagement. A corridor that exists only on an engineering map may not be executable. Early surveys, stakeholder mapping and legal diligence can reveal fatal constraints while capital exposure is still limited.
72. Contracting for uncertain volumes
Offtake, bulk-supply and operating contracts should recognise that required volumes may change across the pathway. Minimum-payment obligations can transfer stranded-capacity risk to the buyer, while fully merchant exposure can weaken financeability. A balanced structure may combine availability payment, variable volume, staged capacity and reopening rights tied to defined events.
The contract should specify quality, pressure, delivery point, curtailment, force majeure, indexation and scarcity allocation. Scenario analysis should test the obligations under low demand, high demand and supply disruption before financial close.
73. Intergenerational capital allocation
Long-life water assets distribute benefits and costs across generations. A project may protect future customers while creating near-term tariff pressure, or defer investment while leaving later customers a more expensive emergency solution. Appraisal should show the timing of benefits, financing burden, asset life and residual value under each pathway.
Intergenerational analysis strengthens governance because it makes the consequences of delay and overbuild explicit. It should remain grounded in service outcomes and credible asset performance rather than relying on a distant terminal value.
74. Independent assurance scope
Independent assurance should test the demand baseline, climate inputs, source-yield method, scenario coherence, model implementation, option deliverability, cost estimate and trigger design. The assurer should report material limitations and whether they could change the decision. A general review statement provides less value than issue-specific evidence.
Assurance should be repeated when a trigger is crossed, a material model changes or a project moves into irreversible commitment. Continuity of evidence helps the board understand why the pathway has changed.
75. Executive decision record
The final decision record should fit the complexity of the investment while remaining usable. It should state the protected outcome, current supply-demand position, scenario range, preferred pathway, near-term commitment, preserved options, critical assumptions, downside exposure, customer impact, financing source, triggers and accountability.
Appendices can hold model detail, but the main record should show how evidence leads to action. This creates a durable reference for future boards, regulators, lenders and programme teams when conditions differ from the original forecast.
References
- Intergovernmental Panel on Climate Change. Climate Change 2022: Impacts, Adaptation and Vulnerability, Chapter 4: Water. https://www.ipcc.ch/report/ar6/wg2/chapter/chapter-4/
- Ofwat. Water resource planning. https://www.ofwat.gov.uk/regulated-companies/resilience-in-the-round/water-resource-planning/
- United States Environmental Protection Agency. Drought Response and Recovery for Water Utilities. https://www.epa.gov/waterutilityresponse/drought-response-and-recovery-water-utilities
- United States Environmental Protection Agency. Climate Change in the Drinking Water and Wastewater Sectors and the Impact on Financial Resilience, Insurability, and Credit and Investment Quality. 2024. https://www.epa.gov/system/files/documents/2024-02/final-workgroup-report_508-compliant.pdf
- United States Environmental Protection Agency. Climate Ready Water Utilities Adaptation Strategies Guide for Water Utilities. https://nepis.epa.gov/Exe/ZyPURL.cgi?Dockey=P100MEZT.TXT
- World Bank. Building the Resilience of WSS Utilities to Climate Change and Other Threats: A Road Map. https://documents.worldbank.org/curated/en/425871546231664745/pdf/133227-29-12-2018-11-56-40-W.pdf
- Ofwat. RAPID: securing customers' future water supplies in AMP8. https://www.ofwat.gov.uk/rapid-securing-customers-future-water-supplies-in-amp8/
- Ofwat. Water resources market information. https://www.ofwat.gov.uk/regulated-companies/markets/water-bidding-market/water-resources-market-information/
- Environment Agency. Water resources planning guideline. https://www.gov.uk/government/publications/water-resources-planning-guideline
- Environment Agency. Meeting our future water needs: a national framework for water resources. https://www.gov.uk/government/publications/meeting-our-future-water-needs-a-national-framework-for-water-resources
- Ofwat. Drought and water resource management plans. https://www.ofwat.gov.uk/households/drought/
About the Author
Chennakeshav (CK) is a corporate finance and investment banking executive with 25+ years of global experience in deal origination, structuring and execution across M&A, growth capital and corporate strategy. He has led value-creation mandates for founders, corporates and funds — bridging the boardroom view to hands-on execution and close.
His career spans Morgan Stanley, HSBC, Lloyds Banking Group, EWEC, ADQ portfolio companies and Emirates Growth Fund, across TMT, real estate, fintech, deeptech, cleantech, infrastructure and energy. He has partnered with C-suite leaders, private equity and venture funds, sovereign wealth funds and family offices to finance complex fund raises and scale-up ventures, and has led M&A due diligence, post-merger integration and business-transformation initiatives to create value.
At Matchpoint Partners he is Managing Partner, leading the firm's corporate finance, M&A and capital-raising practice. He holds an MBA from London Business School, an engineering degree from VTU and a Master of Laws (LLM, in progress) from UCL London.
An active start-up mentor, CK mentors at Techstars, DIFC FinTech Hive, Startup Grind, Founder Institute and IN5, serves as Entrepreneur Mentor in Residence (EMiR) at London Business School, and judges the Entrepreneurship World Cup.
LinkedIn: https://www.linkedin.com/in/ckadya/
Profile: https://www.matchpoint-partners.com/team/ck-adya.html
