
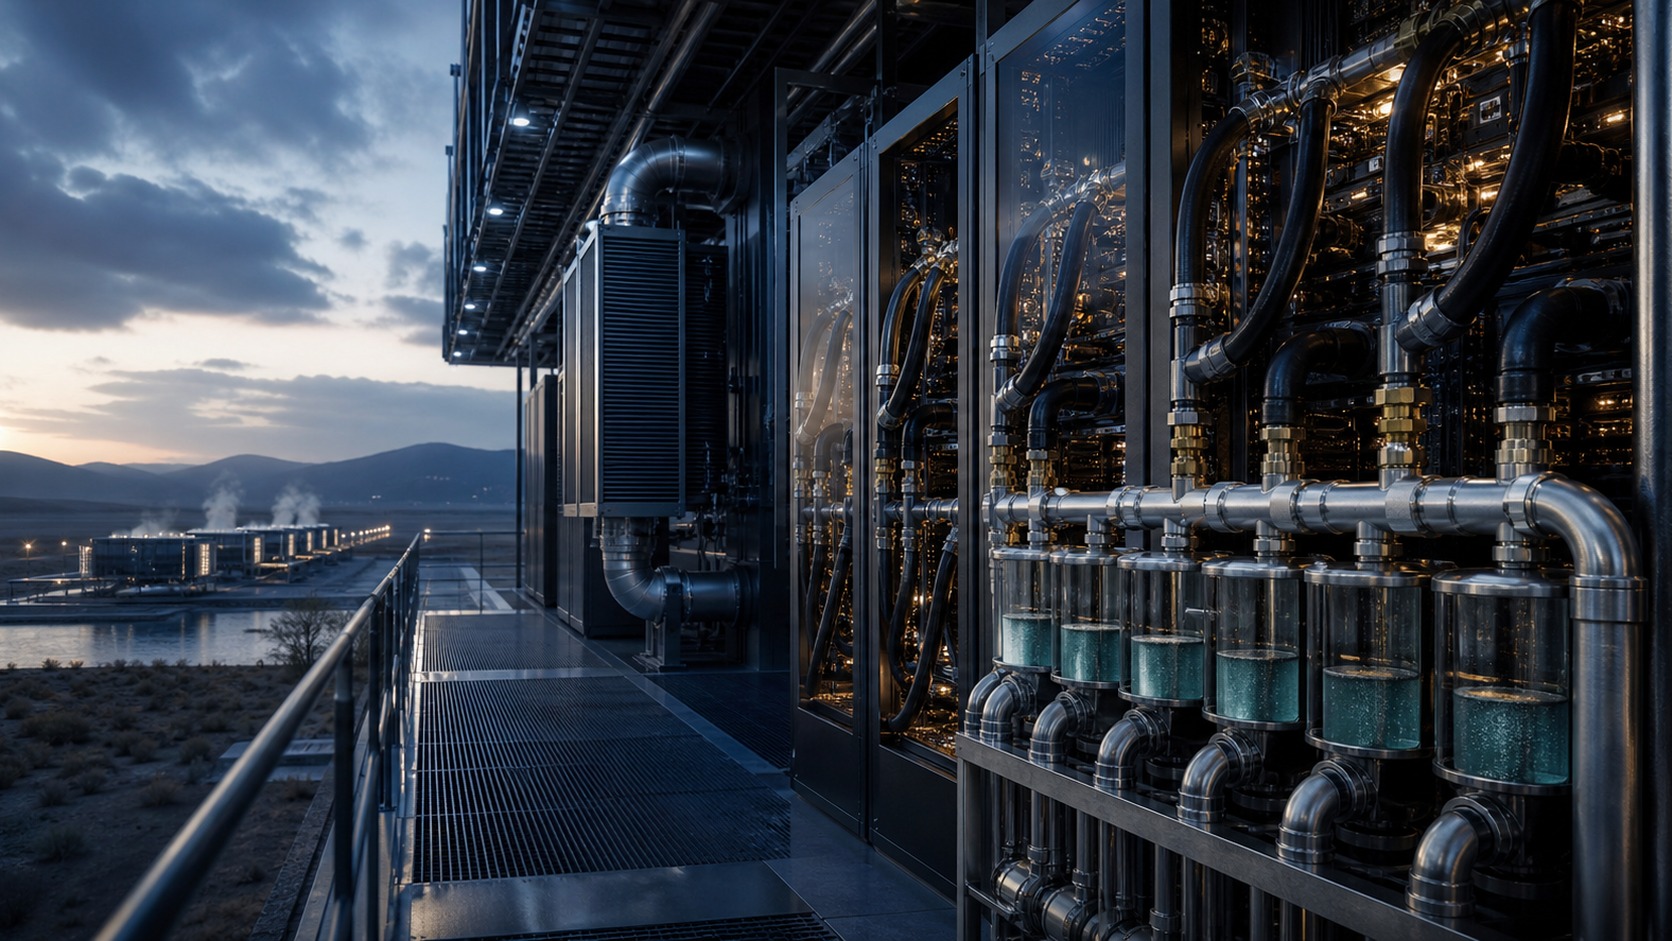
1. Begin with the heat load
Every watt consumed by computing equipment becomes heat within the data-centre system. Cooling investment begins with the heat that must be captured, transported and rejected under normal, peak, degraded and emergency conditions.
Average facility load is an inadequate design basis. Artificial-intelligence racks can concentrate far more heat than conventional enterprise equipment. The design file should include rack power, workload profile, diversity, deployment ramp, inlet and coolant requirements, server tolerance, maintenance state and future hardware generations.
Heat follows several boundaries. Fans or liquid move heat from chips. Room or row systems collect it. Facility water or refrigerant transports it. Chillers, dry coolers or cooling towers reject it. The method used at one boundary does not determine the total water result.
Direct-to-chip liquid cooling can remove heat efficiently from high-density processors. The liquid loop can remain closed, yet a cooling tower used at the final heat-rejection stage still consumes water. A dry cooler can reduce direct water consumption while using more electricity or losing performance at high ambient temperature.
The investment committee should approve a heat-load envelope before comparing vendors. The envelope should cover beginning and mature occupancy, maximum design day, degraded equipment, loss of water, loss of power, partial plant availability and customer service requirements.
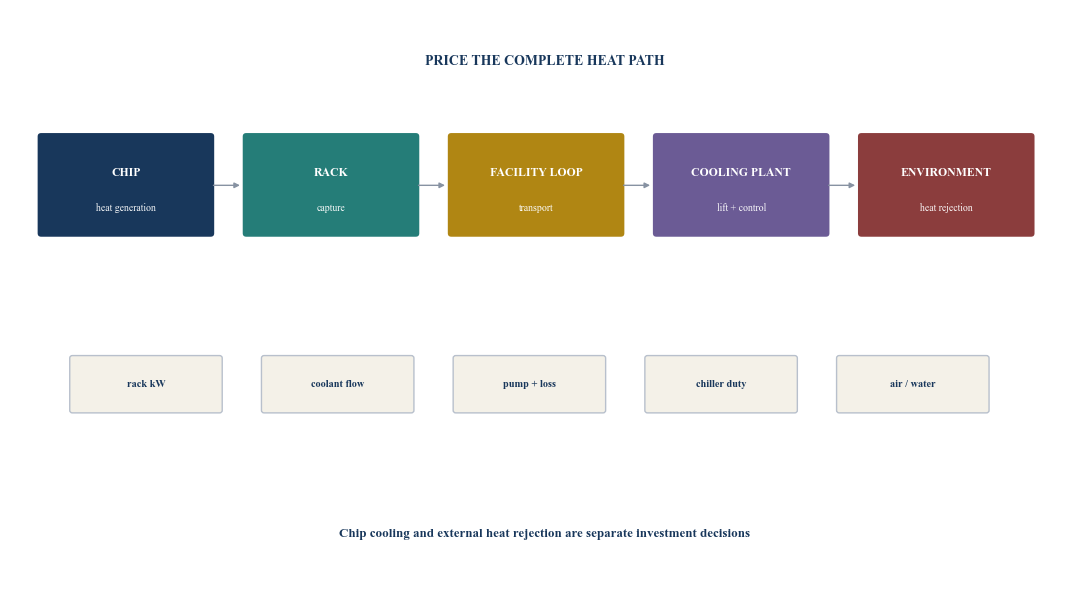
Author framework. Each boundary has separate capacity, efficiency, water and resilience implications.
2. Distinguish withdrawal, consumption and discharge
Water withdrawal is the volume taken from a source. Consumption is the portion unavailable for immediate return, often because it evaporates or becomes incorporated into another stream. Discharge is the water returned after use. These quantities differ materially.
An evaporative cooling tower withdraws makeup water and consumes the portion evaporated. It also discharges blowdown to control dissolved minerals. A closed facility loop holds water while potentially requiring periodic replacement, treatment and leakage makeup. A direct liquid-cooling loop can carry a small inventory without large continual consumption.
Water quality affects usable supply. Potable water, reclaimed wastewater, surface water, groundwater, desalinated water and harvested sources have different reliability, treatment, chemistry, infrastructure, permissions, cost and public impact. A nominal allocation does not establish acceptable quality or dependable delivery.
Indirect water arises in electricity generation and equipment manufacture. Lawrence Berkeley National Laboratory distinguishes direct facility use from water associated with power supply.[2][4] An air-cooled design that uses more electricity can reduce site water while increasing water exposure elsewhere, depending on the grid mix.
The financial model should therefore carry separate source, withdrawal, consumption, treatment, discharge and indirect-water measures. Aggregating them into one litre figure can obscure the location, timing and owner of the risk.
3. Measure PUE and WUE together
Power usage effectiveness divides total facility energy by information-technology energy. Water usage effectiveness divides annual site water use by information-technology energy, usually expressed in litres per kilowatt-hour. Each metric needs an explicit boundary and period.
The United States Department of Energy describes WUE as annual site water divided by IT energy and links cooling-tower use to heat load and cooling-system performance.[1] The European Union reporting framework collects energy-performance and water-footprint information from data centres within its scope.[6]
A lower PUE can coincide with higher direct WUE when evaporative cooling reduces electricity. A lower direct WUE can coincide with higher PUE when dry heat rejection uses more fan and compressor power. Neither metric measures useful compute.
The investment file should add compute-output and availability measures. Training tokens, inference queries, accelerator hours, useful server work or customer-contracted capacity can provide a denominator closer to the economic output. Hardware efficiency and utilisation can change water per workload even when facility WUE remains stable.
LBNL's 2025 review found workload-level water use varied by more than four orders of magnitude across assessed conditions. The study identifies server efficiency, grid water factors, utilisation, cooling, infrastructure, climate and equipment lifecycle among the determinants.[3] This is analytical evidence rather than a forecast for a particular facility.
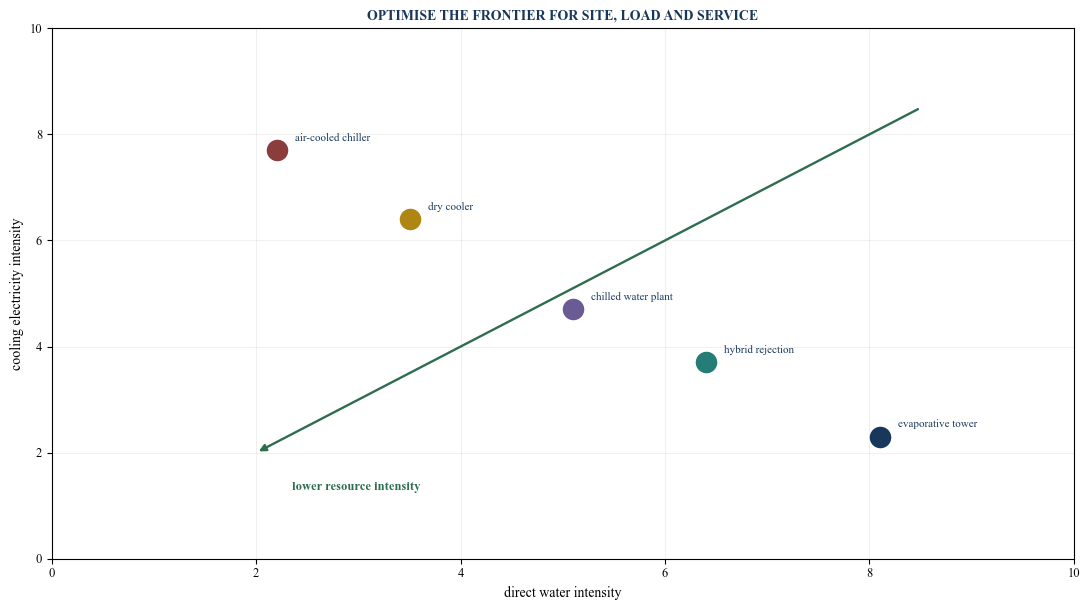
Author framework. Positions are illustrative and move with climate, load, controls and design.
4. Separate rack cooling from heat rejection
Air cooling moves heat from server components into room air. Fans, containment, computer-room air handlers and chilled-water or refrigerant systems then transport the heat. Air systems are familiar and can serve conventional densities, while fan power and airflow become difficult at dense racks.
Direct-to-chip cooling places cold plates on processors and circulates liquid through a coolant-distribution unit. It captures a high share of component heat at a warmer liquid temperature, which can reduce fan and chiller work. Some heat still enters room air and needs a secondary system.
Immersion places components in a dielectric fluid. Single-phase systems circulate liquid without boiling. Two-phase systems use phase change. Hardware compatibility, fluid management, maintenance, safety, warranties and supply chain require specific review.
The facility still needs to reject collected heat. Open cooling towers use evaporation. Dry coolers transfer heat to ambient air. Adiabatic or hybrid systems use water selectively. Chillers provide temperature lift when ambient conditions or server requirements demand it.
DOE's 2024 design guide notes the adoption of direct liquid cooling for high-performance computing and references rack densities above 125 kW.[5] This context does not establish the design density or economic outcome for a specific project.
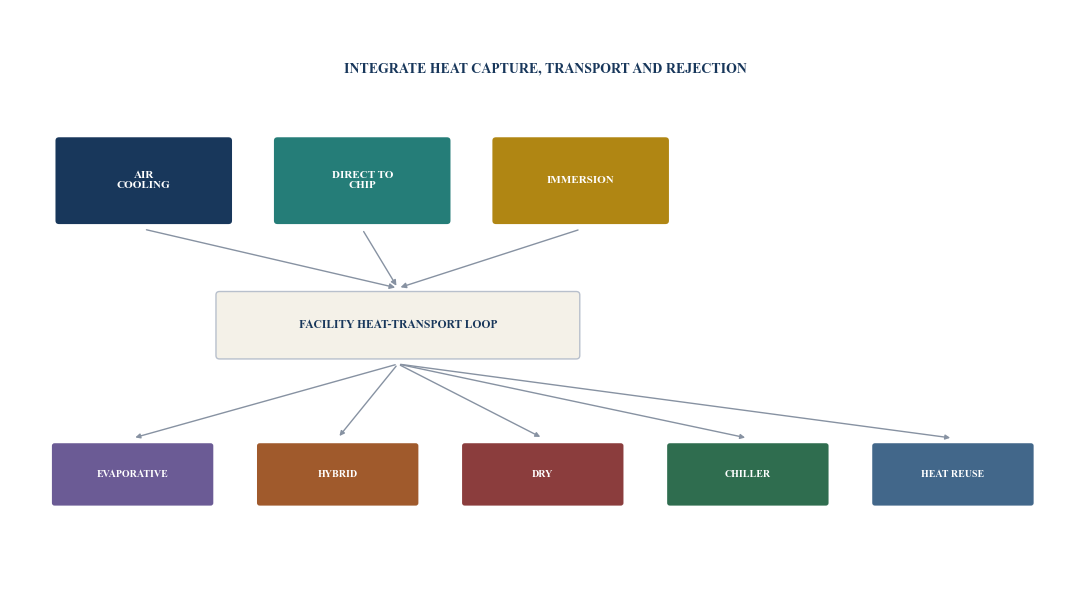
Author framework. Rack heat capture and facility heat rejection should be procured and tested as an integrated system.
5. Model climate by hour
Cooling performance changes with dry-bulb temperature, wet-bulb temperature, humidity, dust, air quality and seasonal patterns. A yearly average can hide the hours that determine capacity, water use and service risk.
Evaporation is more effective in dry conditions. High wet-bulb temperature reduces evaporative approach and can increase tower size or water demand. Dry coolers lose temperature difference during hot hours and may require larger equipment or chiller support. High humidity limits free cooling and creates moisture-control needs.
Singapore's tropical standard provides a controlled path to operate data centres at 26 degrees Celsius and above. IMDA states that each one-degree increase can reduce cooling energy by an estimated 2% to 5% within the standard's context.[10] The standard requires a safe operational roadmap rather than a blanket set-point change.
In cold or temperate climates, air-side or water-side economisation can reduce mechanical cooling for part of the year. DOE guidance explains that the saving depends on climate, set points, humidity and available economiser hours.[1]
The model should simulate at least hourly load and weather. It should calculate plant mode, electricity, water, treatment, discharge, capacity and redundancy. Extreme heat, drought, smoke, dust, loss of water and simultaneous power constraint need separate cases.
6. Price the water source
Water value exceeds the invoice tariff. The project can require connection upgrades, tanks, pumps, treatment, chemistry, meters, testing, blowdown handling, discharge infrastructure and backup supply. It can also face abstraction charges, scarcity restrictions and stakeholder commitments.
Source diligence should establish legal entitlement, physical capacity, pressure, quality, seasonal availability, competing demand, planned development, climate exposure, supplier financial strength and curtailment rules. The hottest period can coincide with peak community demand and lower source availability.
Non-potable and reclaimed water can reduce potable demand. It may require additional treatment and can increase corrosion, scale, biological growth, sludge, chemical use or discharge difficulty. Desalinated water has embedded energy and infrastructure costs. Rainwater can be intermittent and site-limited.
Storage provides hours or days of continuity depending on tank volume and demand. It does not solve a prolonged source interruption. Backup tanker supply can be expensive and operationally constrained. A design that requires continuous water should define minimum reserve, replenishment and degraded operation.
The United Kingdom's 2025 water-resource analysis states that data-centre demand forecasts remain difficult because location, build timing and cooling method are uncertain.[9] This is a planning signal: water evidence should enter site selection before land and electrical design become fixed.
Table 1. Cooling technology investment comparison
| Technology | Rack-density capability | Direct water | Cooling electricity | Principal diligence issue |
|---|---|---|---|---|
| Air cooling | conventional to moderate | low at rack; depends on plant | fan and refrigeration can be material | airflow, containment and future density |
| Chilled-water air system | conventional to high with close-coupled design | depends on heat rejection | chiller, pump and fan load | plant efficiency at part and peak load |
| Direct evaporative | climate and air-quality dependent | consumes water | can reduce mechanical cooling | humidity, contaminants, water reliability |
| Indirect evaporative | broad with design limits | consumes water | lower than full refrigeration in suitable conditions | exchanger approach and peak climate |
| Dry cooler | broad with sufficient temperature approach | very low direct consumption | higher fan or chiller work in heat | maximum-day capacity and electricity |
| Hybrid or adiabatic | broad and mode-dependent | selective seasonal consumption | managed across operating modes | controls, water reserve and transition performance |
| Direct-to-chip liquid | high and very high rack density | closed rack loop; plant-dependent | lower fan and potentially lower chiller duty | server compatibility, coolant and residual air load |
| Immersion | high and very high rack density | closed tank loop; plant-dependent | potentially efficient heat capture | hardware, fluid, maintenance and warranties |
| Thermal storage | supports plant peak management | system-dependent | shifts rather than removes cooling load | storage loss, volume and consecutive events |
| Heat reuse | dependent on temperature and offtake | can change plant mode | pumps and temperature lift may apply | dependable offtaker and seasonal coincidence |
Directional characteristics require project-specific engineering, vendor, climate, water and operating evidence.
7. Design the complete water balance
The water balance should reconcile every inflow, loop, loss, treatment stream, discharge and inventory change. Meters should cover the source, cooling makeup, blowdown, treatment reject, domestic use, irrigation and other material consumers.
Cooling-tower consumption depends on heat rejected, latent heat, cycles of concentration, drift and blowdown. Higher cycles of concentration can reduce blowdown but require chemistry and material compatibility. DOE reports that increasing cycles from three to six can reduce tower makeup requirements by 20% and blowdown by 50% in the referenced operating example.[1]
Treatment can create reject water. Reverse osmosis produces permeate and a concentrated stream. Softening, filtration and chemical programmes change discharge composition. A water-saving process can increase energy or waste.
Leakage and abnormal use need rapid detection. The control system should compare expected water against metered use by plant mode and load. A slow hidden leak can materially affect consumption and equipment.
Commissioning should test the balance at different loads and weather conditions. The owner needs meter accuracy, calibration, data retention and reconciliation procedures suitable for customer, regulator and lender reporting.
Table 2. Water and cooling diligence file
| Field | Required evidence | Financial treatment | Decision test |
|---|---|---|---|
| Heat load | rack plan, utilisation and deployment ramp | hourly beginning and mature load | does plant capacity cover the approved envelope? |
| Weather | dry bulb, wet bulb, humidity and extremes | hourly mode and derating | does maximum-day service pass? |
| Water entitlement | contract, permit, allocation and curtailment | dependable volume and escalation | is supply available during peak need? |
| Water quality | laboratory analysis and variability | treatment capital, chemistry and loss | is quality compatible with equipment and discharge? |
| Consumption | engineered water balance and meter plan | volume by plant mode and occupancy | are withdrawal and consumption separated? |
| Electricity | plant curves and tariff | interval cooling power and demand | is lower water increasing energy cost? |
| Discharge | consent, quality, temperature and capacity | treatment, fees and restrictions | can blowdown and reject streams be accepted? |
| Redundancy | equipment, loop, tank and backup source | capital and operating reserve | can service continue through credible failures? |
| Customer interface | server, coolant and service requirements | compatible capacity and transition cost | are warranties and service commitments aligned? |
| Lifecycle | corrosion, scaling, fluid, maintenance and replacement | recurring and renewal capital | is long-term performance funded? |
Required evidence should be current, site-specific and independently reconciled where material.
8. Integrate water and electricity prices
Cooling decisions should be evaluated on delivered compute rather than resource cost in isolation. A dry system can reduce direct water payments and increase electricity, demand charges and power-infrastructure needs. An evaporative system can improve energy efficiency while adding water and treatment risk.
Electricity availability can be more valuable than tariff cost. A megawatt saved in cooling can become a megawatt available for revenue-generating compute within a constrained connection. In that case, cooling efficiency creates capacity value as well as operating savings.
Water availability can similarly constrain the campus. A utility may offer normal supply without guaranteeing peak-day expansion. Onsite treatment or non-potable infrastructure can unlock capacity but require capital and long-term service contracts.
The model should price carbon, water scarcity and regulation only through approved mechanisms. Internal shadow prices can support decisions while remaining separate from cash. Public commitments can create reputational and permitting value that should be described rather than presented as certain revenue.
Sensitivity should combine heat and price. Hot weather can raise cooling electricity, water consumption, facility demand and grid price simultaneously. A design selected on independent average assumptions can understate the most expensive hours.
9. Link cooling to compute revenue
Cooling enables rack density and service availability. A design that supports higher-density accelerators can increase revenue per unit of building area and electrical connection. The value depends on customer demand, contracted price, deployment timing and equipment compatibility.
Liquid cooling can reduce server fan energy and enable warmer facility water. It also requires coolant-distribution units, manifolds, piping, leak controls, water chemistry or dielectric fluid, maintenance procedures and compatible hardware. Retrofit can interrupt halls or reduce rentable space.
The investment model should distinguish sellable capacity, contracted capacity, installed equipment and utilised compute. Cooling plant built before customer deployment carries capital and standby cost. Cooling installed too late can delay revenue.
Customer contracts should state density, inlet or coolant conditions, responsibility for equipment interfaces, maintenance access, leakage, fluid quality, alarms, service levels and change. Colocation operators may need several cooling types for different tenants.
Revenue value should be credited only to the incremental compatible capacity enabled by the selected architecture. A general forecast of AI demand does not establish project occupancy or price.
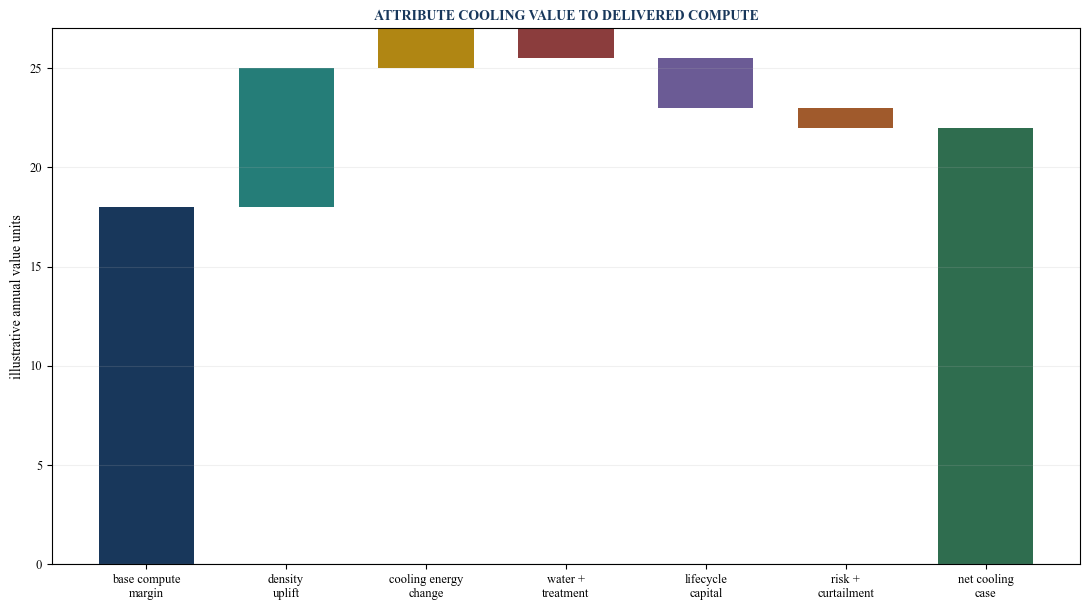
Author framework. Value should be attributed only where cooling changes delivered and contracted compute.
10. Protect availability and fail safely
Cooling is critical infrastructure. A failure can cause thermal throttling, controlled workload migration, equipment shutdown or hardware damage. The design should establish how much heat can be removed during each equipment and utility failure.
Redundancy applies to pumps, chillers, cooling towers, dry coolers, coolant-distribution units, heat exchangers, controls, sensors, power and water. A shared pipe, header, tank or control platform can defeat redundant equipment.
Water loss should have a documented sequence. Hybrid equipment can move to dry operation with reduced capacity. Thermal storage can bridge an interruption. Workloads can be reduced or moved when customer and network arrangements permit. Emergency water can support a defined duration.
Controls need local safe states, validated sensors, alarm priority, manual override and loss-of-communication behaviour. Automated optimisation should not consume resilience reserve or move outside server and water-chemistry limits.
Commissioning should include component failures, loss of water, extreme weather, low occupancy, maximum occupancy, transition between modes and restoration. Tests should be repeated after material changes.
11. Price water quality and chemistry
Cooling water carries minerals, gases and biological material. Concentration through evaporation can create scale, corrosion and microbiological growth. These conditions reduce heat transfer, damage equipment and create health or environmental risks.
The water-treatment programme should reflect source chemistry, equipment materials, temperature, cycles of concentration, drift control and discharge consent. It can include filtration, softening, reverse osmosis, biocides, corrosion inhibitors and monitoring.
Direct-liquid systems require coolant specifications and materials compatibility. Leak prevention, detection, containment, sampling, filtration and replacement determine performance. Fluid life and disposal need lifecycle cost.
Treatment suppliers can offer recurring chemical, monitoring and service contracts. The owner needs transparent dosage, quality targets, analytical evidence and change control. A proprietary programme should not prevent alternative supply or independent testing.
Water quality can change seasonally or after a utility-source change. The design should retain treatment range and escalation procedures. Metering volume alone cannot establish that the cooling system remains within chemical limits.
12. Evaluate reuse, recovery and circularity
Water reuse can use treated municipal wastewater, cooling-tower blowdown recovery, condensate, rainwater or other suitable sources. Each option should be assessed for dependable volume, quality, treatment, storage, discharge and public-health control.
Heat reuse can deliver warm water to district heating, industrial processes, buildings or agriculture. Its value depends on temperature, distance, timing, offtaker credit, network infrastructure and contract. High-temperature liquid cooling can improve heat usefulness, though temperature lift may still be required.
Singapore's DC Tuas uses direct-to-chip cooling together with rainwater harvesting, condensate reuse and blowdown recovery, according to a 2026 government infrastructure announcement.[12] This provides an operating example within the stated facility; it does not establish the economics of another site.
Circularity should be measured through actual avoided withdrawal, discharge, energy or purchased heat. A reuse percentage can be misleading when the baseline and loop boundary are unclear. The owner should reconcile source and destination meters.
The offtake contract should allocate construction, availability, temperature, backup, maintenance, metering, price, change and termination. Heat value should remain outside the base case until infrastructure and offtake are dependable.
13. Account for regulation and disclosure
Water permissions can cover connection, abstraction, storage, treatment, discharge temperature, chemical quality and environmental impact. Building, safety and critical-infrastructure rules also apply. These obligations vary by location and can change.
The European Union's data-centre reporting framework includes energy and water-footprint measures for facilities within scope.[6] Reporting creates a data requirement and potential benchmarking context. It does not replace local water or environmental permits.
The United Kingdom's 2026 water-use report recommends strategic site selection, early water-infrastructure assessment, advanced cooling, recycling and alternative sources.[8] Its findings apply within the stated United Kingdom policy context.
Australia's 2026 government-released infrastructure analysis describes the trade-off between water-cooled efficiency and air-cooled electricity, and notes that liquid cooling can use a closed loop while building heat rejection determines consumption.[7]
Singapore's tropical standard and higher-temperature operating programmes address energy efficiency in a hot and humid climate.[10][11] Water, electricity and equipment requirements should still be evaluated at project level.
Table 3. Selected international cooling and water evidence
| Geography | Official evidence | Decision contribution | Limitation |
|---|---|---|---|
| United States | DOE cooling-water guidance and LBNL research | WUE, water balance, economisers, liquid cooling and workload determinants | facility and climate outcomes remain project-specific |
| European Union | energy and water reporting framework | consistent disclosure and performance data | reporting does not establish technical feasibility or permit |
| United Kingdom | national water and compute evidence | planning uncertainty, site selection, water-energy nexus and technology options | policy and projections require local project evidence |
| Australia | data-centres infrastructure analysis | energy-water trade-off and distinction between liquid loops and heat rejection | published analysis is not a supplier performance guarantee |
| Singapore | tropical standard, testbeds and operating examples | higher set points, hot-humid operation and direct-to-chip deployment | results depend on controlled implementation and customer equipment |
Sources have different institutional purposes; project decisions require current site-specific confirmation.
14. Procure on delivered performance
Cooling proposals should be compared on one heat-load, weather, water, electricity and service envelope. Nameplate cooling capacity can conceal different temperatures, redundancy, pumping, auxiliary load and peak derating.
The request for proposal should define rack densities, coolant or air conditions, facility boundary, weather files, water quality, source limits, plant modes, redundancy, acoustic and environmental duties, controls, tests and lifecycle services.
Supplier guarantees can cover capacity, approach temperature, electricity, water, availability and acoustic performance at agreed conditions. Performance outside the test points should be represented through approved curves.
Interface accountability is critical. The server supplier, rack integrator, coolant-distribution supplier, mechanical contractor, controls provider and heat-rejection vendor can each meet their package while the complete system fails. A system integrator and independent commissioning authority should own cross-package tests.
Contracts need schedule, performance security, defects, spare parts, software rights, cyber controls, maintenance, fluid and chemical responsibilities, warranty interaction, data access and long-term support.
15. Structure the capital programme
The investment perimeter includes rack interfaces, piping, coolant-distribution units, pumps, heat exchangers, chillers, towers or dry coolers, controls, meters, treatment, tanks, discharge, civil works, power, commissioning and lifecycle capital.
Site-selection expenditure should include water and heat-rejection studies early. A parcel with adequate grid connection and land can remain unsuitable when water, discharge, noise or environmental constraints are unresolved.
Phasing should match compute deployment while preserving efficient part-load operation and redundancy. Modular cooling can reduce stranded capital. Excessive fragmentation can add interfaces, maintenance and lower efficiency.
Retrofit needs migration, temporary cooling, downtime, customer approval and compatibility. The business case should include revenue interruption and the risk that existing servers cannot use the new architecture.
Replacement planning should cover chillers, towers, pumps, fans, controls, fluids, filters, water-treatment assets and corrosion. Efficiency can decline without maintenance, increasing both water and electricity.
16. Finance against evidenced cash
Cooling creates cash through lower electricity, water and operating cost, increased sellable density, faster customer deployment and avoided capital. Each mechanism needs an evidence trail and should avoid double counting.
Customer revenue should be supported by contract, compatible hardware, deployment schedule and delivered capacity. Utility saving should use interval tariffs, plant curves and occupancy. Water saving should include treatment and discharge rather than headline tariff alone.
Capital deferral should identify the actual electrical, building or water asset delayed and the revised investment date. A lower PUE can create connection headroom, though revenue arises only when the headroom supports contracted compute.
Lenders should rely on contracted data-centre cash and proven operating costs. Technology performance, completion, warranties, insurance and replacement reserves affect debt service. Speculative heat sale, reputational value and avoided outage loss should remain scenarios.
Vendor or energy-service arrangements can transfer capital and performance duties. The owner should examine tenor, indexation, minimum payment, availability, termination and residual assets.
17. Test a hypothetical project
Consider a hypothetical 60 MW IT campus comparing an evaporative chilled-water base design with a hybrid dry and evaporative system supporting direct-to-chip racks. Management assumes the hybrid system uses dry rejection through suitable hours and water during peak conditions.
Every cost, tariff, consumption, efficiency, occupancy, revenue and financial result is a hypothetical management assumption. It does not represent an actual facility, supplier proposal, customer contract, utility price or forecast.
The model calculates cooling electricity and water hourly using hypothetical weather and load. It prices connection capacity, water infrastructure, treatment, discharge, controls, maintenance and replacement. Incremental compute revenue is included only for assumed compatible contracted racks.
Table 4. Hypothetical water-constrained data-centre case
| Item | Hypothetical assumption | Model treatment | Principal caveat |
|---|---|---|---|
| Campus IT load | 60 MW at mature occupancy | hourly deployment over four years | customer and utilisation unverified |
| Cooling architecture | direct-to-chip plus hybrid heat rejection | dry, adiabatic and chiller operating modes | final design and performance unverified |
| Incremental capital | USD 22.0m above reference design | rack loop, hybrid plant, controls and water works | quotations and interfaces unverified |
| Mature cooling-power reduction | 5.2 MW average against reference | connection and energy value | depends on load, weather and operating control |
| Mature site-water reduction | 42% against reference | tariff, treatment and scarcity sensitivity | reference and source conditions hypothetical |
| Annual operating saving | USD 6.1m at mature load | electricity, demand, water and treatment | tariffs and occupancy hypothetical |
| Incremental compatible compute | 3.0 MW | revenue only after assumed customer contract | customer demand and price unverified |
| Annual incremental compute margin | USD 4.2m at maturity | contribution after direct service costs | contract and utilisation hypothetical |
| Major renewal | USD 8.5m in year 10 | plant and control replacement reserve | timing and cost unverified |
| Heat-reuse cash | reported separately | scenario only | offtaker and network absent |
Every value is a hypothetical management assumption for method demonstration; USD-equivalent amounts are not current market evidence.
18. Stress the water and energy nexus
The model should test hotter weather, higher humidity, drought restriction, low water pressure, poorer quality, discharge constraint, higher electricity price, low occupancy, failed liquid-cooling adoption and supplier delay.
Correlation matters. Extreme heat can reduce dry-cooler capacity, increase chiller load, raise grid demand and tighten water availability. A plant designed around average resource conditions can fail economically and physically on the same day.
Low occupancy reduces compute revenue while fixed cooling and water infrastructure remains. Very rapid occupancy can expose commissioning and source-capacity limits. A change in server generation can alter coolant temperature, flow and rack density.
The base case should remain serviceable without speculative heat revenue and with conservative water restrictions. A design that reaches return targets only through uncontracted density uplift has weak evidence.
Table 5. Hypothetical cooling investment stress matrix
| Case | Cooling electricity | Site water | Compute capacity | Financial consequence | Decision implication |
|---|---|---|---|---|---|
| Base | modelled hybrid operation | 42% below reference | full assumed density | operating saving plus contracted margin | proceed only after complete evidence |
| Extreme heat | 24% above base-day peak | peak water mode | maintained with reserve plant | higher demand charge and water use | size to maximum-day condition |
| Drought restriction | 9% above base annual cooling energy | 65% below reference | selected load reduction in peak hours | lower revenue and higher power cost | contract a degraded operating plan |
| Poor water quality | 3% higher auxiliary energy | higher treatment reject | unchanged if treatment operates | added treatment and maintenance | verify seasonal chemistry and discharge |
| Low liquid-cooling adoption | 6% higher cooling energy | 18% above base | lower rack density | density margin delayed | phase rack-loop capital with contracts |
| Electricity escalation | unchanged physical use | unchanged site water | unchanged | lower energy saving | value connection capacity separately |
| Cooling plant outage | emergency mode | reserve draw | partial workload migration | service credits and lost margin | prove redundancy and transition tests |
Every value is a hypothetical management assumption and demonstrates sensitivity rather than a forecast.
19. Establish the operating dashboard
The operating dashboard should reconcile heat, compute, electricity, water, chemistry and service. Measures include IT load, rack density, inlet or coolant temperatures, flow, plant mode, cooling power, PUE, withdrawal, consumption, discharge and WUE.
Water measures should show source, makeup, blowdown, treatment reject, tank level, leakage and quality. Electricity measures should show chillers, pumps, fans, towers, dry coolers and controls. Compute measures should show installed, contracted, available and utilised capacity.
Performance should be compared with weather and load-adjusted expectations. A low water value can result from low occupancy rather than efficiency. A low PUE can reflect a boundary change. Data definitions should remain stable and auditable.
Risk measures include source curtailment, water-quality exceptions, chemistry alarms, leaks, cooling capacity margin, failed equipment, manual overrides, discharge excursions, cyber incidents and customer incompatibility.
Settled cash should reconcile to tariffs, invoices and customer contracts. Engineering benefits and risk scenarios should remain distinct from realised financial value.
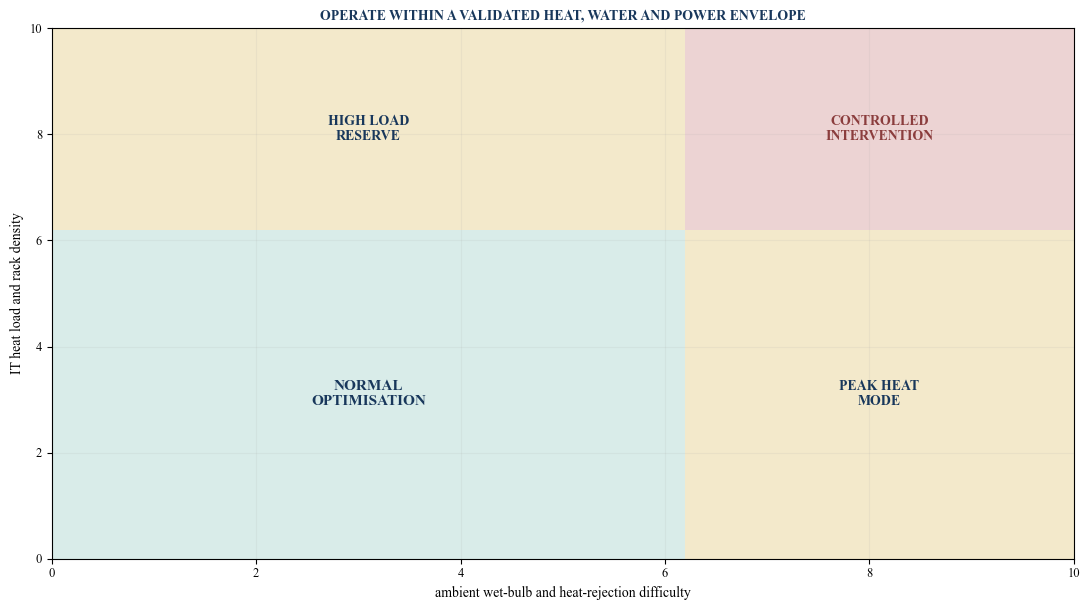
Author framework. Thresholds are illustrative and require current engineering and customer approval.
20. Execute through five phases
The first 30 days establish heat load, customer requirements, site resources and the current design. Days 31 to 60 build the hourly heat, electricity and water model and select architectures for comparison.
Days 61 to 90 complete source, discharge, chemistry, reliability and commercial diligence. Days 91 to 120 procure integrated performance and run design-stage tests. Days 121 to 150 reach a controlled investment decision with contracts, conditions and an operating dashboard.
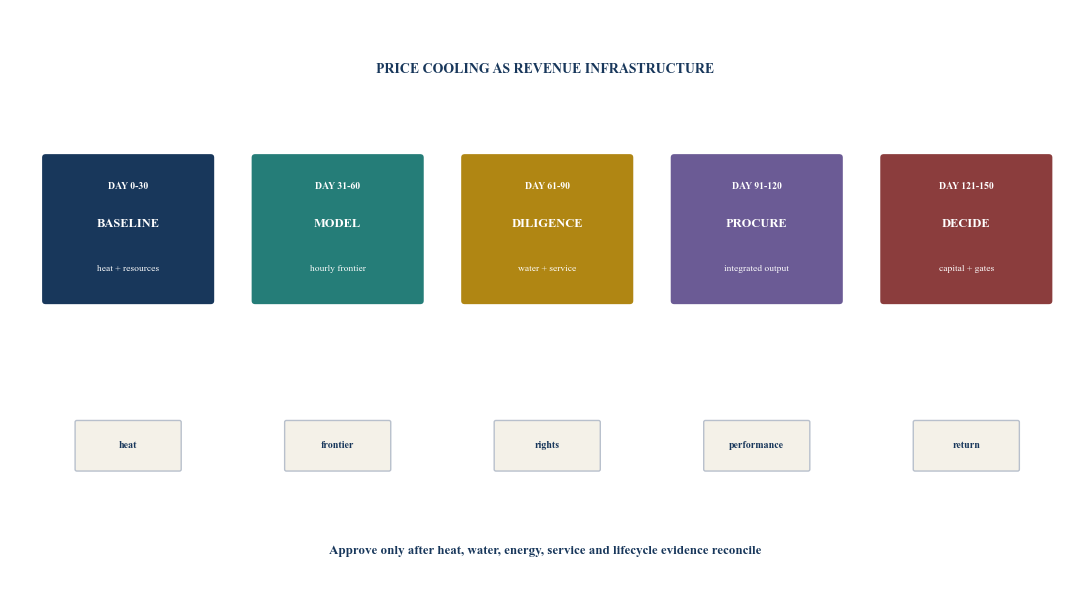
Author framework. Timing should be revised for the project's current design, permitting and procurement position.
Table 6. 150-day execution plan
| Days | Workstream | Required output | Gate |
|---|---|---|---|
| 0 to 15 | heat and customers | rack density, deployment, coolant and service requirements | design envelope approved |
| 16 to 30 | site resources | weather, electricity, water, discharge and current plant | resource baseline reconciled |
| 31 to 45 | hourly model | heat, plant modes, power, water and capacity | reference case accepted |
| 46 to 60 | architecture options | air, liquid, evaporative, dry, hybrid and reuse cases | comparable frontier established |
| 61 to 75 | water diligence | entitlement, quality, treatment, storage and curtailment | dependable source confirmed |
| 76 to 90 | service and lifecycle | redundancy, chemistry, controls, customer and renewal | operating case accepted |
| 91 to 105 | procurement | integrated scope, guarantees, interfaces and remedies | comparable proposals received |
| 106 to 120 | design assurance | independent model, maximum-day and failure tests | performance case validated |
| 121 to 135 | finance and contracts | customer cash, tariffs, capex, reserves and covenants | downside financeable |
| 136 to 150 | investment decision | authorised design, budget, conditions and dashboard | approve, revise or decline |
Timing is an author framework and should be adapted to project approvals, engineering and procurement.
21. Set the investment decision
The committee should approve the heat-load envelope, rack and facility cooling architecture, heat-rejection modes, water source, treatment, storage, discharge, redundancy, operating limits, customer interfaces, capital, lifecycle reserve and benefit model.
Conditions should cover final engineering, water and environmental permissions, utility capacity, customer and equipment compatibility, integrated supplier guarantees, controls, cyber security, commissioning, insurance, operating procedures and replacement funding.
The decision should state which benefits support capital. Contracted compute margin and evidenced utility savings can support the base case. Connection-capacity value requires a real constraint and deployable customer demand. Heat reuse, reputational value and avoided outage loss should remain scenarios until supported by dependable cash.
The project should pause or resize when peak heat cannot be rejected, water entitlement is weak, discharge is unresolved, source quality is incompatible, server warranties conflict with cooling, integrated performance lacks accountability or return depends on uncontracted density.
22. Limitations and conclusion
Server technology, rack density, cooling equipment, fluids, electricity and water systems, climate, tariffs, customer requirements, environmental permissions, reporting and public policy can change. Investment decisions require current evidence from customers, server and cooling suppliers, utilities, water authorities, independent engineers, environmental specialists, insurers, lenders and qualified advisers.
The cited United States, European Union, United Kingdom, Australian and Singapore sources apply within their stated institutional purposes. They cannot establish project performance, permission, price or return in another location.
Every cost, tariff, capacity, water volume, efficiency, schedule, occupancy, revenue and financial result in the worked example is a hypothetical management assumption. No actual data-centre project, supplier quotation, customer contract, utility term or realised result is claimed.
Cooling is revenue infrastructure. It determines which equipment can operate, how much connection capacity reaches compute, which water and environmental obligations the project carries, and how reliably customer service can be delivered.
The financeable design prices chip heat capture and external heat rejection as one system. It models electricity and water together, proves performance across hourly weather and failure cases, secures dependable source and discharge rights, allocates supplier interfaces and values only cash supported by compatible compute and measured operation.
References
- [1] United States Department of Energy, Cooling Water Efficiency Opportunities for Federal Data Centers, 9 January 2019. https://www.energy.gov/cmei/femp/cooling-water-efficiency-opportunities-federal-data-centers
- [2] Lawrence Berkeley National Laboratory, Water Efficiency, Center of Expertise for Data Center Efficiency, official resource accessed 13 August 2026. https://datacenters.lbl.gov/water-efficiency
- [3] Lawrence Berkeley National Laboratory, The Water Use of Data Center Workloads: A Review and Assessment of Key Determinants, June 2025. https://seta.lbl.gov/publications/water-use-data-center-workloads
- [4] Lawrence Berkeley National Laboratory, The Environmental Footprint of Data Centers in the United States, May 2021. https://seta.lbl.gov/publications/environmental-footprint-data-centers
- [5] United States Department of Energy, Best Practices Guide for Energy-Efficient Data Center Design, July 2024. https://www.energy.gov/sites/default/files/2024-07/best-practice-guide-data-center-design.pdf
- [6] European Commission, Energy Performance of Data Centres, official reporting page accessed 13 August 2026. https://energy.ec.europa.eu/topics/energy-efficiency/energy-efficiency-targets-directive-and-rules/energy-efficiency-directive/energy-performance-data-centres_en
- [7] Australian Department of Climate Change, Energy, the Environment and Water, Data Centres as Enabling Infrastructure, released 2026. https://www.dcceew.gov.au/sites/default/files/documents/82403.pdf
- [8] United Kingdom Department for Science, Innovation and Technology, Water Use in AI and Data Centres, 2026. https://assets.publishing.service.gov.uk/media/688cb407dc6688ed50878367/Water_use_in_data_centre_and_AI_report.pdf
- [9] United Kingdom Department for Environment, Food and Rural Affairs, Water Resources Data and Modelling: National Framework for Water Resources 2025, 2026 publication. https://assets.publishing.service.gov.uk/media/69df94ed61d2e8e9b9e42d8c/Water-resources-data-and-modelling-technical-report-Appendix-National-Framework-for-Water-Resources-2025.pdf
- [10] Singapore Infocomm Media Development Authority, Tropical Data Centre Standard, official programme page accessed 13 August 2026. https://www.imda.gov.sg/how-we-can-help/green-dc-roadmap/tropical-dc-standard
- [11] Singapore Ministry of Trade and Industry, Launch of Sustainable Tropical Data Centre Testbed, official speech accessed 13 August 2026. https://www.mti.gov.sg/newsroom/speech-by-mos-alvin-tan-at-launch-of-sustainable-tropical-data-centre-testbed/
- [12] Singapore JTC, Nxera Opens Multi-Tenanted Data Centre, 9 February 2026. https://www.jtc.gov.sg/about-jtc/news-and-stories/industry-news/nxera-opens-multi-tenanted-data-centre
About the Author
Chennakeshav Adya is an independent researcher and Managing Partner of Matchpoint Partners. His research focuses on investment strategy, capital formation, transaction execution, governance and operating-model design across international markets.
