

1 Sequence the first year by cash at risk, because an integration team cannot do everything at once
An acquirer completes a transaction with a long list of integration workstreams and limited capacity. The list covers bank mandates, customer billing, key-account coverage, payroll, supplier terms, systems, facilities and governance. The available team cannot staff every workstream at its desired rate, so the plan implies a resource allocation and an order of completion. The decision examined here is how to set that order: share capacity across functions and their checklists, or prioritise workstreams using estimated cash exposure and effort. The experiment uses a first-year horizon. Its staffing is divisible, so the number of people alone does not prevent several eligible workstreams from starting together.
This paper treats the choice as a scheduling decision with a stated cost. Each workstream is given a weekly exposure, called value at risk, that stops when the workstream is complete. The cost of a plan is the sum of exposure accumulated until each completion. The question is whether a plan that finishes cash-critical workstreams first costs less than a uniform function-by-function plan, by how much, under what conditions, and how far a team could trust a real record of its own deals to say so.
The paper builds the framework from published integration research, scheduling theory and the dated rules that fix two cash events in the United Arab Emirates. It then runs a constructed experiment on eighteen workstreams, scored on the same random draws under nine policies. The experiment reports no observed integration result. Its inputs are authored, and the exposure that ranks the workstreams is also the exposure that scores the plans. The findings therefore show how ordering rules behave when their premise holds, and they do not show that the premise holds in a particular deal.
2 Define value at risk as weekly cash leakage that stops when the workstream is complete
The outcome is cash leakage over the first fifty-two weeks after completion, in USD million. For each workstream j, value at risk is a weekly rate in USD thousand that accrues from the completion date until the workstream is done, then stops. It combines two things that a finance team would otherwise keep apart: cash that leaks from an unmanaged process, such as an unmapped customer account, and benefit that is deferred, such as a procurement saving that cannot start. A workstream that is unfinished at the end of the year contributes its full year of exposure.
The term differs from the statistical measure of that name used in market risk. Here it is an exposure rate with no confidence-level interpretation, and it is set by the integration team from the process, the account list and the contract calendar. This choice keeps the definition auditable. It also means the quantity is an estimate of a counterfactual, namely what leaks if nothing is done, and the paper treats it as noisy throughout. Section 7 returns to what noise does to a ranking built on it.
Two alternative forms are tested. In the base form the rate stops only at completion. In a proportional form the rate falls in line with the share of work remaining, which suits workstreams that protect cash progressively. Time is measured in weeks and completion events can occur within a week; the horizon is fixed, and nothing is discounted. Discounting is not tested. Introducing a discount rate would change the objective, and the ranking would require a fresh calculation rather than an assumed invariance. The weekly rate is the unit that a programme office can maintain in a register and revise as information arrives, which is the main reason for choosing it over a single lump sum per workstream.
For an actual transaction, the proposed register should separate a cash movement from an accounting benefit before either enters a ranking. A late invoice, a permanent customer loss, a missed supplier discount and a deferred procurement saving describe different events. The first may move a receipt between periods, the second may change future earnings, and the others require their own contractual evidence. The integration office should document the event, the affected account, its expected timing and the closure test. It should then reconcile overlapping items with the finance owner. Adding a customer-retention estimate to the same customer's delayed invoice balance without that reconciliation would give the scheduling objective two weights for one economic exposure.
A working register should also retain the original estimate alongside each revision. Its purpose is to make the decision inspectable: which information was available, who accepted the assumption, and what changed after completion. An exposure retired in this register is a modelled readiness measure. It is not automatically cash collected or incremental earnings. The board report should carry separate columns for operational completion, cash actually received or paid, and any estimated benefit against a documented comparison. This separation is particularly important when an integration milestone and a reporting period end on different dates.
3 Integration research finds conditional relationships with outcomes and leaves the order of workstreams open
Homburg and Bucerius examine 232 horizontal mergers and acquisitions completed between 1996 and 1999 among Central European firms, using survey responses from executives responsible for integration. Their working paper reports a conditional relationship between integration speed and success: the relationship is most favourable when external relatedness is low and internal relatedness high, with the opposite pattern less favourable [1]. Its marketing and sales measures and survey outcomes provide context for the integration decision. They supply no test of this paper's exposure-weighted workstream sequence.
Bauer and Matzler's published abstract reports 106 small and medium transactions in German-speaking Central Europe and relationships involving strategic complementarity, cultural fit, integration degree and integration speed [2]. Larsson and Finkelstein's case survey of 61 transactions associates organisational integration and lower employee resistance with synergy realisation [3]. These findings concern integration processes and outcomes in their respective samples. An effect of the particular scheduling policies examined here requires separate evaluation.
In 228 United States bank acquisitions, Zollo and Singh report a positive relationship between knowledge codification and acquisition performance; accumulated experience did not show a corresponding benefit [4]. King and colleagues identify evidence of potential moderators in post-acquisition performance [5]. Kato and Schoenberg's qualitative case-study research in a business-to-business context describes customer-relationship mechanisms through which integration actions can affect purchasing decisions [6]. These studies motivate attention to integration processes, customers and the recording of decisions. The exposure measure and workstream ranking used here are the author's proposed design. The studies supply no estimate of their effect.
| Source | Sample or method | Evidence relevant to this paper | Question left open |
|---|---|---|---|
| Homburg and Bucerius [1] | Survey of 232 horizontal transactions | Conditional relationships between speed, relatedness and outcomes | Order of individual workstreams |
| Bauer and Matzler [2] | 106 SME transactions; published abstract | Relationships involving complementarity, fit and integration | Cash-weighted scheduling effects |
| Larsson and Finkelstein [3] | Case survey of 61 transactions | Association of integration and employee resistance with synergies | A cash-exposure ranking rule |
| Zollo and Singh [4] | 228 US bank acquisitions | Positive association of knowledge codification with performance | Causal effect of this proposed register |
| King and colleagues [5] | Meta-analysis | Evidence of potential moderators and heterogeneous outcomes | Identity or magnitude of a particular confounder |
| Kato and Schoenberg [6] | Qualitative B2B case studies; published abstract | Customer-relationship mechanisms relevant to integration | A numerical ordering effect |
Summary of the cited research and its relevance to this paper. The proposed ranking rule and its numerical weights are separate modelling choices.
4 Scheduling theory supplies the ordering rule and proves it optimal only in the simplest case
Minimising the sum of weighted completion times on one machine is solved by sequencing jobs in descending order of weight divided by processing time. Hermelin, Koana and Shabtay describe this as Smith's rule, attribute it to Smith (1956), and note that it solves the single-machine problem in time proportional to n log n [7]. Here a job is a workstream, its weight is value at risk per week, and its processing time is effort. The rule says to finish first the workstreams that retire the most exposure per person-week.
Hermelin and colleagues discuss standard identical-machine scheduling: two-machine ordinary NP-hardness, strong NP-hardness when the number of machines is variable, and a guarantee for the standard non-preemptive greedy rule [7]. The integration model here allows divisible staffing, staffing caps, precedence and noisy inputs. The standard guarantee does not cover that combination or the horizon-capped objective. Its ordering policies are therefore tested as heuristics within the constructed experiment.
Smith's original single-machine result is cited through the accessible research article [7]. It motivates the exposure-to-effort ordering rule for the untruncated weighted-completion objective. The mapping of an integration workstream to a job, and its exposure estimate to a weight, is this paper's modelling choice. It does not establish that the input estimates represent actual cash losses or that a heuristic is optimal under the additional restrictions. The finite-horizon lower bound in Section 11 is derived separately from a progressive-retirement relaxation.
5 Some cash workstreams carry a dated external clock that the plan cannot move
Two United Arab Emirates compliance calendars provide examples of dates that an integration plan must preserve where the rules apply. Ministerial Resolution 0340 of 2026 was issued on 12 May 2026, took effect on 1 June 2026 and repealed Resolution 598 of 2022. Article 1 requires establishments registered with the Ministry of Human Resources and Emiratisation to pay the preceding month's wages on the first day of each Gregorian month through WPS or another Ministry-approved system, subject to the exclusions in Article 4. Article 2's 85 per cent regulatory compliance threshold preserves workers' entitlement to their full wages. The payroll control should therefore cover the full lawful wage obligation, with the applicable system, funding route and payment evidence ready for each due date [8].
Electronic invoicing supplies a second calendar for persons within the regime's scope. Decision 243 of 2025 applies to business transactions subject to its exclusions; Decision 197 of 2026, effective from 1 October 2026, replaces Article 4 and adds a twenty-four-month exclusion from 1 January 2027 for transactions between members of the same VAT Tax Group [9, 17]. Decision 244 of 2025 also defers business-to-consumer transactions, and persons engaged exclusively in them, until a further ministerial decision. It defines revenue by the gross income earned during the most recent accounting period. For a person subject to the regime whose revenue is AED 50 million or more, Decision 66 of 2026 sets provider appointment by 30 October 2026 and implementation by 1 January 2027. The appointment date had passed by this paper's 6 November 2026 source review. For revenue below AED 50 million, the dates are 31 March 2027 and 1 July 2027 respectively [10, 11, 12].
The legal entity, relevant accounting period, tax-group membership and exclusions require a transaction-specific check. The cited texts provide no general rule that an acquisition resets a person's phase. Counsel should confirm the treatment of a changed or combined business. Each applicable due date belongs in a capacity-feasible schedule with its prerequisite evidence, completion test and latest safe start. A distant deadline alone does not establish first priority for the entire workstream. These legal calendars supply none of the experiment's weekly exposure values. The Ministry's current portal also lists Cabinet Decision 173 of 2026 on e-invoicing penalties; any applicable statutory penalty should be assessed separately from the model's authored leakage weights [18].
| Workstream | Rule and date | Status | Consequence for the plan |
|---|---|---|---|
| Payroll and benefits continuity | Ministry-registered establishments: preceding month's wages due on the first day of the following Gregorian month, subject to Article 4 exclusions [8] | Resolution 0340/2026; Article 2's 85 per cent compliance threshold preserves full wage entitlement | Confirm the applicable payroll system and full lawful obligation; test continuity before each due date |
| Electronic invoicing, revenue of AED 50 million or more | For persons subject to the regime: provider appointment by 30 October 2026; implementation by 1 January 2027 [10, 11, 12] | Decision 244/2025 as amended by 66/2026; appointment date had passed by 6 November 2026 | Confirm appointment status, implementation readiness and current exclusions, including Decision 197/2026 [9, 17] |
| Electronic invoicing, revenue below AED 50 million | For persons subject to the regime: provider by 31 March 2027; implementation by 1 July 2027 [10] | Revenue uses the most recent accounting period; B2C deferral and applicable exclusions require a check | Confirm the entity's phase and record its dependency chain and latest safe start |
Prepared from official texts checked on 6 November 2026. Applicability depends on the legal entity, exclusions and relevant accounting period. The model's weekly exposure values remain authored inputs.
6 Record each workstream with an exposure, an effort, a successor and a clock
The ordering rule needs four fields for each workstream, kept in one register: a weekly exposure with a stated range, an effort with a stated range, the workstream that cannot start until it finishes, and any dated external clock. The register should also hold the owner and the evidence behind each estimate. Retaining the ranges, accepted point estimates and dated revisions makes sensitivity and changes in assumptions inspectable.
Exposure estimates should come from the processes that leak. For billing, the monthly invoice run and the share of customers whose remittance details change; for key accounts, annual revenue by account and the date of the next renewal; for supplier terms, the discount or credit period at risk. Table 3 lists the fields. The register distinguishes cash that leaves the business from benefit that is deferred, because the second kind can be recovered by finishing late and the first often cannot. Kato and Schoenberg's finding that integration actions change customer perceptions supports recording account-level actions explicitly [6].
Zollo and Singh report that knowledge codification was positively associated with acquisition performance in their banking sample [4]. A register of this form is a codification of sequence, and it can be reused in the next transaction. The study does not show that this particular register improves anything, and the experiment below does not either. It shows what the register makes possible: a ranking that can be recomputed, challenged and compared with what happened. The proposed evaluation uses the retained estimates and completion evidence to examine calibration, with other measurement and study requirements described later in the paper.
| Field | Content | Decision supported |
|---|---|---|
| Exposure | Weekly cash leakage or deferred benefit, with low and high values and the process it comes from | Rank within the register |
| Effort | Person-weeks with a range, maximum useful staffing and the skills required | Capacity and minimum duration |
| Successor | Workstream that cannot start until this one is complete | Order along chains |
| External clock | Statutory or contractual date, with the source and its status | Fixed constraint ahead of any ranking |
| Owner and evidence | Named owner, source documents and date of last review | Audit of the estimate |
| Completion test | Observable condition that closes the exposure | When leakage stops |
Proposed record. Entries describe information to obtain; they are not findings about a particular deal.
Before scoring a workstream, the proposed evidence pack should state the relevant legal entity, operating business, jurisdiction, contractual counterparty and system of record. A group-level description can conceal a subsidiary with a different banking mandate, payroll route or billing arrangement. The workstream owner should reconcile the register to the signed transaction perimeter and record any transitional service on which completion depends. The exposure range should identify its unit and time window. A weekly collection delay and an annual run-rate saving should be converted into compatible measures before they appear in the same scheduling objective, with the conversion retained for challenge.
The completion test should describe an observable operating condition. Examples of proposed tests include an authorised payment instruction accepted by the bank, a billing file reconciled to the customer master, or a tested supplier payment route with an approved exception process. The evidence should identify who performed the test and who accepted it. A presentation marked complete, an unsigned instruction or an unreconciled system migration should remain a separate readiness state. Where the test covers only part of a business, the register should retain the outstanding entities or accounts and the associated exposure assumption. Closure should apply to the tested perimeter rather than to the workstream's label.
7 Noisy-estimate rankings can overstate the gain under the model's assumptions
Smith and Winkler analyse selection using noisy value estimates. Under their conditionally unbiased-estimate assumptions, choosing the highest estimate can produce expected disappointment; their paper also presents Bayesian adjustments that account for estimation uncertainty [13]. This paper examines a related mechanism in a scheduling model whose ranking uses noisy exposure estimates. The claimed-to-realised ratios below describe that constructed experiment. The general theorem supplies no acquisition-specific noise level or universal ranking penalty.
Buehler, Griffin and Ross provide a reason to test duration optimism. Study 1 enrolled 37 psychology honours students. Among the 33 who completed within follow-up, the mean best estimate was 33.9 days and the mean actual completion time was 55.5 days. Four unfinished theses were excluded from this completion-time comparison. The paper reports that 10.8 per cent of respondents finished by their optimistic date [14]. This student-task evidence supplies no integration-effort overrun rate; this paper's overrun stresses remain authored choices.
These sources motivate examining estimation error and duration optimism. The experiment authors an independent noise mechanism for exposure estimates and measures the claimed-to-realised gain as its scale rises. Baseline effort multipliers have mean one; selected stresses add overruns. Neither source supplies these error sizes or their dependence structure for integrations. The grid compares the specified ordering rules under those choices. The cash-critical-only overrun is a selected stress mechanism, with its consequences reported in Section 17.
8 The sources justify the structure of the experiment and supply none of its numbers
The integration literature supports the claim that integration effort and its codification relate to outcomes and that the effects are conditional. Scheduling theory supplies a rule that is optimal in a simple case and a heuristic in the realistic one. The two dated rules show that some workstreams are tied to calendar events. The decision-analysis and planning-fallacy literatures motivate testing estimation error and duration optimism; the integration-specific mechanisms remain authored choices. Each source supports a structure; none supports a magnitude. The consequence for the design is that every number in the experiment is an authored input, labelled as such, and that sweeps replace point claims wherever an input is uncertain.
The experiment therefore needs authored inputs for exposure, effort, staffing limits, precedence and noise. They are stated in the input register and varied in sweeps. No source supports the share of exposure that sits in cash-critical workstreams, and that share is a deliberate feature of the constructed case: tier A holds 76.9% of exposure and 30.4% of effort. Where an input drives a result, the paper says so. Where the result is robust to the input, the paper reports the sweep that shows it.
The design uses the simulation-study components described by Morris, White and Crowther: aims, data-generating mechanisms, estimands, methods and performance measures [15]. The constructed deal supplies the data-generating mechanism and the nine policies supply the methods. Paired Monte Carlo standard errors are supplied for the principal base-case estimates. Sweep and stress figures display point estimates and replication counts; those counts alone do not quantify the Monte Carlo uncertainty of each contrast. Small differences in those figures should therefore be treated as descriptive simulation patterns. Sensitivity to authored assumptions and uncertainty about real acquisitions remain separate from Monte Carlo sampling error.
9 A constructed acquisition has eighteen workstreams and a team of eight
The constructed case has eighteen workstreams in seven functions: finance, sales, people, procurement, technology, operations, and legal and tax. Ten workstreams are cash-critical, meaning that they touch cash within about ninety days of completion, and they form tier A. The remaining eight form tier B and cover systems, facilities and governance. Plan effort totals 316 person-weeks. An integration team of eight persons would need 39.5 weeks to finish it if every person were fully used, and each workstream has a cap on how many people can work on it at once.
Total exposure is USD 308 thousand per week, of which tier A holds USD 237 thousand. If nothing were completed for the whole year, leakage would be USD 16.02 million, and the paper calls this the do-nothing ceiling. The mean ceiling in the replications is USD 15.99 million because realised exposures vary. The uniform plan and the ratio rules are compared with this ceiling and with a lower bound from a relaxation that ignores staffing caps and precedence. Five precedence pairs sit inside single functions, for example collections after billing and bank mandates.
Each replication draws realised effort and realised exposure from lognormal multipliers with mean one and log standard deviations of 0.25 and 0.35. It also draws estimated exposure with an independent lognormal error of 0.5, a random checklist order for each function and a random priority order for an uninformed comparator. All policies are scored on the same draws. Table 4 and Table 5 list the authored workstream inputs and Table 6 records every input with its status. These values define the constructed case; they carry no calibration to an observed acquisition size or client record.
The engine uses homogeneous, continuously divisible staff and linear productivity up to each workstream's maximum staffing. It imposes no minimum crew, specialist-role restriction, external lead time or reassignment cost. Its equal-sharing policy can place fractions of a person on several eligible workstreams. These are modelling assumptions rather than a description of an executable staffing plan. No statutory date or deadline-feasibility constraint enters the scheduling engine; the legal-calendar procedure later in the paper is a separate proposed operational control.
| Workstream | Function | Plan effort (person-weeks) | Maximum staffing | Value at risk (USD thousand per week) | Successor workstream |
|---|---|---|---|---|---|
| Bank mandates and treasury access | Finance | 8 | 2 | 28 | Collections and cash application |
| Customer billing and remittance details | Finance | 10 | 3 | 36 | Collections and cash application |
| Collections and cash application | Finance | 14 | 3 | 30 | None |
| Key-account coverage and retention plan | Sales | 12 | 3 | 42 | Pricing and contract-renewal governance |
| Pricing and contract-renewal governance | Sales | 10 | 2 | 22 | None |
| Payroll and benefits continuity | People | 8 | 2 | 12 | None |
| Key-person retention agreements | People | 6 | 2 | 20 | None |
| Critical-supplier terms and payment run | Procurement | 10 | 2 | 18 | Procurement synergy renegotiation |
| Trade-credit and working-capital terms | Finance | 8 | 2 | 15 | None |
| Statutory registrations and e-invoicing | Legal and tax | 10 | 2 | 14 | None |
Authored inputs for the constructed case. Plan effort in person-weeks; value at risk in USD thousand per week. Not observed data.
| Workstream | Function | Plan effort (person-weeks) | Maximum staffing | Value at risk (USD thousand per week) | Successor workstream |
|---|---|---|---|---|---|
| Procurement synergy renegotiation | Procurement | 18 | 3 | 16 | None |
| ERP and ledger consolidation | Technology | 60 | 6 | 22 | CRM and sales-system migration |
| CRM and sales-system migration | Technology | 30 | 4 | 8 | None |
| HR system harmonisation | People | 20 | 3 | 2 | None |
| Brand and communications alignment | Sales | 12 | 3 | 3 | None |
| Site and facilities consolidation | Operations | 40 | 4 | 12 | None |
| Policy and governance harmonisation | Legal and tax | 16 | 3 | 3 | None |
| Organisation design and reporting lines | People | 24 | 4 | 5 | None |
Authored inputs for the constructed case. Plan effort in person-weeks; value at risk in USD thousand per week. Not observed data.
| Input | Value | Status |
|---|---|---|
| Workstreams, functions | 18 workstreams in 7 functions; 10 cash-critical (tier A) | Authored |
| Plan effort and maximum staffing | 316 person-weeks in total; staffing caps of 2 to 6 | Authored |
| Value at risk | USD 308 thousand per week in total; USD 237 thousand in tier A | Authored |
| Integration team and horizon | 8 persons; 52 weeks | Authored |
| Realised effort | Plan effort times a lognormal multiplier, log s.d. 0.25, mean one | Authored |
| Realised value at risk | Authored rate times a lognormal multiplier, log s.d. 0.35, mean one | Authored |
| Estimated value at risk | Realised rate times a lognormal error, log s.d. 0.5, mean one | Authored |
| Precedence | Five pairs, each inside one function | Authored |
| Leakage | Full rate until completion; proportional to remaining work as a variant | Authored |
| Replications and seed | 2,000 base, 1,000 per sweep point, seed 20261014 | Authored |
| External clocks named in the text | Payroll due date and e-invoicing dates come from the cited texts; their cash values do not | Cited and authored |
MatchPoint analysis. Status shows whether an input is authored or taken from a cited text. No input is an observed rate.
10 Compare nine policies using shared draws and explicit benchmark definitions
The uniform plan shares the team across active function queues using equal shares subject to staffing caps, redistributing available capacity when a cap or completed queue permits it. Each function follows a random precedence-feasible checklist, one workstream at a time. A second baseline shares the team equally across all open workstreams. Random priority order is an additional comparator, with no worst-case guarantee. Largest and smallest effort first test whether effort alone explains any gain. The cash-critical tier rule puts tier A first in random order, and the tier-then-ratio rule orders by estimated exposure per unit of plan effort within each tier.
The clairvoyant heuristic benchmark applies the ratio policy using true exposure and true effort, information unavailable to the operating team. It is a feasible heuristic rather than an optimum; the independent check found a feasible priority swap that improved it in one base replication. The progressive-retirement relaxation in Section 11 supplies a distinct lower bound. Each implemented policy allocates capacity continuously between completion events, subject to the stated staffing caps and precedence. The order affects allocation and completion; the underlying draws remain shared across policies.
Leakage accumulates according to Equation 1a. Exposure ell_j is in USD thousand per week, time is in weeks, and L_pi is in USD million; the factor 10^-3 performs the currency-unit conversion. For a workstream completed within the horizon, Equation 1b equates delivered person-weeks with realised effort. Equation 1c states the team-capacity, non-negativity and workstream-cap constraints. The event-driven engine implements these allocations continuously between completions. Table 7 lists the tested policies.
In Equation 1, C_j is a completion time when the workstream finishes within H, a_j(t) is its staffing allocation, e_j is realised effort, K is team size and m_j is its staffing cap. An unfinished workstream has delivered less than e_j at H and receives an infinite completion marker for horizon capping. Its eventual completion time is not measured by the engine. It contributes its full exposure through H. A successor receives no staffing until its predecessor is complete. Staff are homogeneous and divisible, with linear productivity up to each cap.
| Policy | Rule | Information used |
|---|---|---|
| Uniform function-by-function plan | Active function queues share the team equally, subject to staffing caps; each follows a random precedence-feasible checklist, one workstream at a time | None |
| Equal share across all open workstreams | The team is shared equally across all open workstreams, within staffing limits | None |
| Random priority order | Priority order drawn at random; a comparator without information | None |
| Largest effort first / Smallest effort first | Order by plan effort, largest or smallest first | Plan effort |
| Cash-critical tier first | Tier A first in random order, then tier B | Binary cash-critical label |
| Value at risk per unit of effort (estimated) | Descending ratio of estimated value at risk to plan effort, adjusted along precedence chains | Estimated value at risk, plan effort |
| Cash-critical tier, then value per effort | Tier A first, ratio order within each tier | Label, estimates, plan effort |
| Value per effort with true inputs (clairvoyant heuristic) | As the ratio rule, with true value at risk and true effort | Information no team holds |
MatchPoint analysis. Rules as implemented in the constructed experiment.
The staffing variable in the experiment represents interchangeable capacity. An actual programme should prepare a separate skills and availability check before treating a numerical ranking as executable. Treasury authority, tax configuration, customer communications and enterprise-system access require different permissions and expertise. A programme office can record a named skill pool and an available time window against each task, then identify where the proposed sequence depends on the same person twice. This is a proposed feasibility control rather than another tested feature of the simulation. Any numerical result produced after introducing specialist teams, external lead times or minimum staffing would require a separate implementation and validation.
Clearance reporting uses a fixed horizon. Let T_A be the time at which all cash-critical workstreams finish. Displayed mean clearance statistics are means of min(T_A,H), paired with the fraction still unfinished at H. A value close to fifty-two weeks can therefore reflect censoring rather than a completed integration. The recorded horizon does not reveal the eventual completion date of unfinished work. This distinction applies to the base, capacity and stress comparisons.
11 Exposure per unit of effort sets the order, and the tier label approximates it
The ratio of exposure to effort is the index that Smith's rule uses [7]. For workstream j the index is r_j in Equation 2a. In the constructed inputs the mean ratio is 2.49 for tier A and 0.32 for tier B, so a binary label already separates the two groups. The estimated version uses the noisy exposure estimate and the plan effort, and along a precedence pair the predecessor takes the higher of its own ratio and the combined ratio of the pair, so that a valuable successor is not blocked behind a low-ranked predecessor.
The lower-bound calculation permits proportional retirement of exposure as effort is delivered, removes each workstream's staffing cap and removes precedence. It allocates the aggregate team to descending true exposure per unit of effort. Progressive retirement gives a cost no greater than completion-only retirement for any given allocation. Removing the restrictions enlarges the feasible set. Within that relaxation, exchanging earlier lower-density work with later higher-density work increases retirement benefit because the common remaining-horizon weight is H-t. Integrating the resulting schedule gives the finite-horizon bound in Equation 2b. This derivation applies to the stated linear, divisible-work model.
For Equation 2, order by descending true exposure ell_j divided by effort e_j. Define p_k=e_(k)/K, s_k as the sum of p_i for all i before k, and a_k as min(p_k,max(H-s_k,0)). Every p_k is positive under the stated inputs. The term a_k is the processing time available to the workstream before the horizon. Equation 2b integrates its remaining exposure and is a lower bound on the model's proportional and completion-only leakage. The tier and ratio policies remain feasible heuristics under the original restrictions. Their distance from this bound combines several relaxed mechanisms and has no isolated attribution to staffing or order. The factor 10^-3 converts the integrated exposure from USD thousand to the USD million units of L_LB.
12 In the base case, tier-then-ratio cuts first-year leakage by 45.3% against the uniform plan
Under the uniform plan, mean first-year leakage is USD 6.57 million, or 41.1% of the do-nothing ceiling. Tier-then-ratio reduces it to USD 3.57 million, with a mean paired relative gain of 45.3% and a Monte Carlo standard error of 0.1 percentage points. The clairvoyant heuristic has mean leakage of USD 3.44 million. The ratio of the reduction in mean leakage to the baseline-to-heuristic mean-leakage gap is 95.9%. This metric is separate from the mean paired relative gain and gives no distance to a proven optimum. Tier-then-ratio beats the uniform plan in 100.0% of 2,000 replications. The progressive-retirement lower bound is USD 2.53 million; the experiment does not attribute the remaining gap among retirement assumptions, staffing caps, precedence and ordering.
Mean horizon-capped cash-critical clearance statistics are week 14.1 under tier-then-ratio, week 14.8 under the tier-only rule and week 34.4 under the uniform plan. The associated unfinished-at-horizon fractions distinguish completion from censoring. Equal sharing across eligible workstreams gains 0.3% over the uniform plan. Relative gain is -4.5% for random priority and -41.3% for largest effort first; negative gain means higher cost. These comparisons describe the specified policies under the constructed inputs. Random priority supplies no mathematical performance floor.
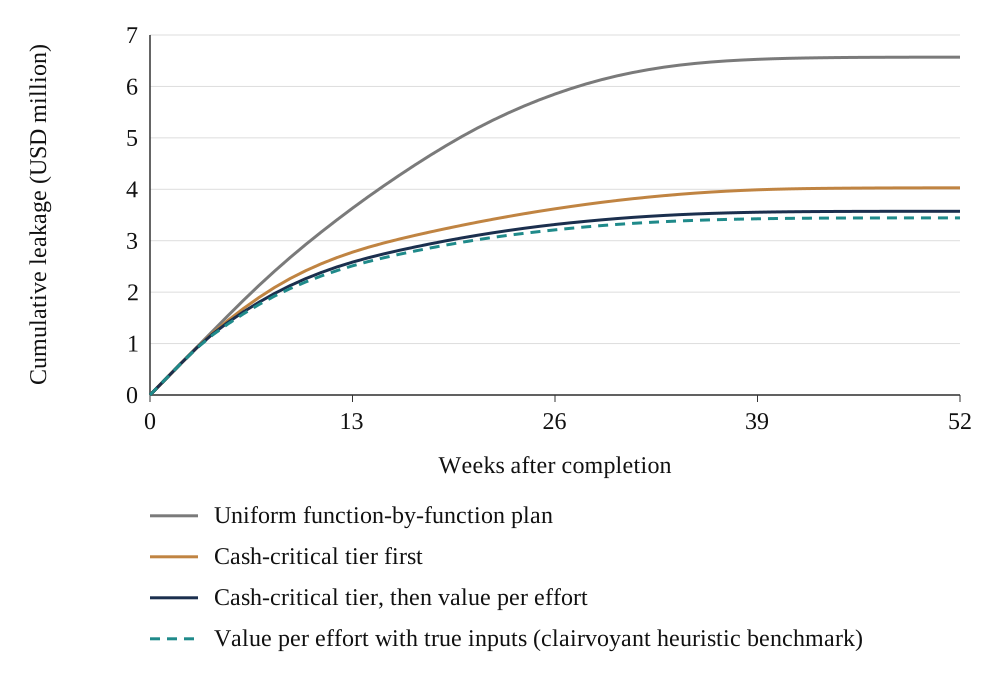
MatchPoint analysis of the constructed case. Model output under stated inputs; not an observed result. Mean of 300 replications; weeks after completion.
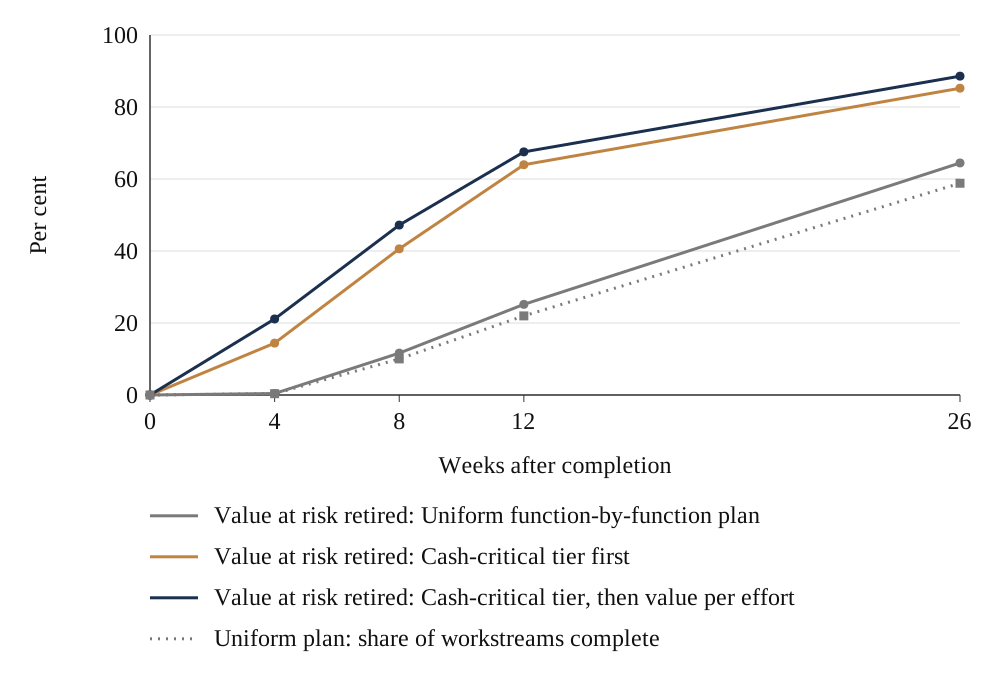
Figure 1 shows when the advantage accrues. By week 26 the cumulative leakage under tier-then-ratio is USD 2.54 million below the uniform plan's, and most of the final gap is already open by then. After the cash-critical work is cleared, the remaining workstreams carry little exposure and the curves run nearly parallel. This timing pattern is a result of the constructed case and supplies no general first-half-year finding for acquisitions.
| Policy | Mean leakage | Standard error | Gain over uniform plan | Mean horizon-capped Tier A clearance time (weeks) | Share of gap to clairvoyant heuristic closed | Tier A unfinished at week 52 |
|---|---|---|---|---|---|---|
| Uniform function-by-function plan | 6.57 | 0.020 | - | 34.4 | - | 0.0% |
| Equal share across all open workstreams | 6.52 | 0.018 | 0.3% (SE 0.2) | 28.8 | 1.6% | 0.0% |
| Random priority order | 6.83 | 0.031 | -4.5% (SE 0.4) | 38.4 | -8.4% | 0.2% |
| Largest effort first | 9.23 | 0.028 | -41.3% (SE 0.3) | 40.7 | -85.1% | 0.1% |
| Smallest effort first | 4.08 | 0.012 | 37.6% (SE 0.1) | 15.4 | 79.6% | 0.0% |
| Cash-critical tier first | 4.00 | 0.012 | 38.7% (SE 0.1) | 14.8 | 82.1% | 0.0% |
| Value at risk per unit of effort (estimated) | 3.59 | 0.010 | 45.0% (SE 0.1) | 16.1 | 95.3% | 0.0% |
| Cash-critical tier, then value per effort | 3.57 | 0.010 | 45.3% (SE 0.1) | 14.1 | 95.9% | 0.0% |
| Value per effort with true inputs (clairvoyant heuristic) | 3.44 | 0.009 | 47.3% (SE 0.1) | 15.0 | 100.0% | 0.0% |
| Proportional-progress relaxed lower bound | 2.53 | 0.007 | 61.3% (SE 0.1) | - | - | - |
MatchPoint analysis of the constructed case. Model output under stated inputs; not an observed result. USD million over fifty-two weeks; 2,000 replications; gain is the mean paired gain over the uniform plan.
Table 8 reports the full comparison. The implication is direct. In the constructed case, ordering by exposure per unit of effort, with the cash label as a first filter, cuts first-year leakage by close to half against the uniform plan and closes 95.9% of the baseline-to-clairvoyant-heuristic mean-leakage gap. The size of the gain depends on the inputs, and the next sections show which inputs it depends on. The standard error of the gain is 0.1 points, which reflects variation in the random draws only, and a real set of deals would vary in structure as well.
13 Smallest-effort-first produces most of the base-case gain
Smallest effort first gains 37.6% over the uniform plan without using exposure information. The pure estimated-ratio policy gains 45.0%, a difference of 7.5 percentage points. Tier-then-ratio gains 45.3%, a difference of 7.7 percentage points from smallest effort first in the base case. Equation 3b is an arithmetic contrast between specified policies. It does not identify a causal contribution of the cash label or of exposure information. The constructed association of short effort and high exposure helps explain these comparisons within this experiment.
In Equation 3, L_U denotes uniform-plan leakage and G_pi denotes the paired relative gain of policy pi. The policy contrast labelled G_ratio-G_effort is computed for pure estimated-ratio ordering against smallest effort first. The tier-only policy gains 38.7% under the same constructed inputs. These comparisons demonstrate the role of the specified assumptions; a team without reliable estimates would need to evaluate a candidate rule using its own evidence and feasible staffing.
The uniform comparator divides capacity between functions and operates a queue within each function. In this constructed case, some alternative policies complete short or highly weighted work earlier. That comparator choice is part of the experiment and should travel with its reported gains. A different baseline, a different dependency network or a different relation between effort and exposure requires a new comparison. The equal-average-effort stress in Section 17 tests one such change without isolating a field effect of the cash-critical label.
14 Modelled policy contrasts widen as authored exposure becomes more concentrated
The concentration sweep rescales exposure by a power so that total authored exposure is constant. At an exponent of 0, authored exposure rates are equal across workstreams and the top three hold 16.7%. At 1.0 the authored inputs apply and the top three hold 35.1%. At 2.0 they hold 52.7%. Across the sweep, smallest effort first gains 30.2% at equal exposure and 41.4% at the highest concentration, while the ratio rule gains 29.2% and 56.8%. Uniform-plan leakage also moves, from USD 7.00 million to USD 6.15 million, because in the authored inputs the largest exposures sit in small workstreams, which even the uniform plan clears sooner. Realised rates retain the stated independent lognormal variation, so their totals and cross-workstream rates are not held equal in each replication.
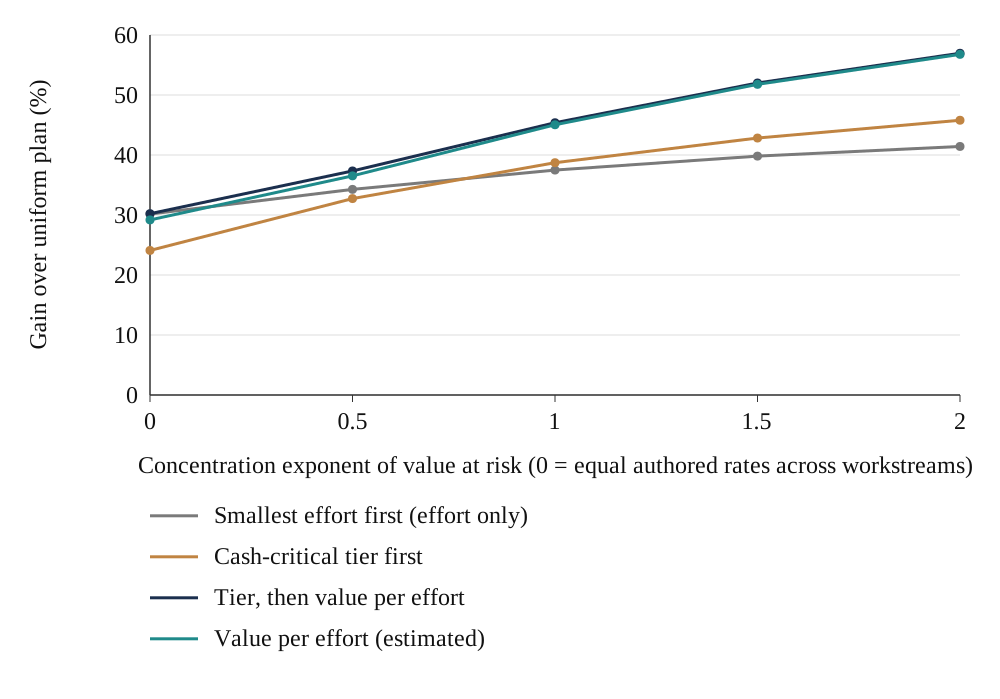
MatchPoint analysis of the constructed case. Model output under stated inputs; not an observed result. 1,000 replications per point; total authored exposure held constant; realised rates retain lognormal variation.
Figure 2 and Table 9 show that the tier-then-ratio rule moves from 30.2% to 57.0%, and the gap between it and effort ordering widens from 0.1 points at equal exposure to 15.5 points at the highest concentration. When exposure is spread evenly, the ranking by exposure has little to add, and the gain comes from effort. When a few workstreams carry most of the exposure, ranking them first is where the gain lies. Concentration is a proposed diagnostic to examine alongside effort, dependencies, estimation quality and available capabilities. A top-three share alone does not determine the value of an actual integration sequence.
| Concentration exponent | Value at risk in top three workstreams | Uniform plan leakage | Gain: smallest effort first | Gain: value per effort | Gain: cash-critical tier | Gain: tier then ratio |
|---|---|---|---|---|---|---|
| 0.0 | 16.7% | 7.00 | 30.2% | 29.2% | 24.1% | 30.2% |
| 0.5 | 25.7% | 6.77 | 34.3% | 36.5% | 32.7% | 37.3% |
| 1.0 | 35.1% | 6.54 | 37.5% | 45.0% | 38.7% | 45.4% |
| 1.5 | 44.2% | 6.34 | 39.8% | 51.8% | 42.8% | 52.0% |
| 2.0 | 52.7% | 6.15 | 41.4% | 56.8% | 45.8% | 57.0% |
MatchPoint analysis of the constructed case. Model output under stated inputs; not an observed result. Gain over the uniform plan; 1,000 replications per row.
15 Noisy estimates erode a pure ratio rule before the tier rule, and the claimed gain overshoots
The noise sweep raises the log standard deviation of the exposure estimate from 0 to 2. The ratio rule gains 46.9% with exact estimates, 45.0% at the base noise of 0.5 and 33.9% at 1.5. The tier rule is unaffected by estimate noise, because it uses only the label, and gains 38.7% throughout. The ratio rule falls below the tier rule at a noise between 1.0 and 1.5, where it gains 39.9% and 33.9% respectively. The combined rule falls less, to 41.7% at a noise of 2.0.
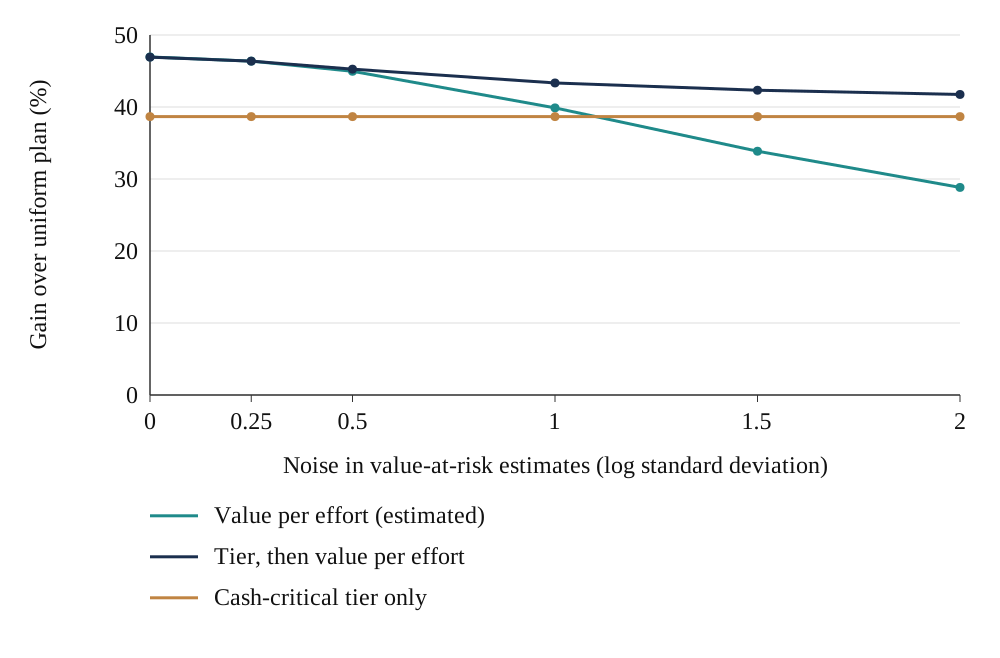
MatchPoint analysis of the constructed case. Model output under stated inputs; not an observed result. 1,000 replications per point.
Figure 3 shows the erosion. For the pure estimated-ratio policy, the claimed gain, computed from the estimates that drove the ranking, overshoots the realised gain. Equation 4 defines the estimate and the ratio. At the base noise the team would claim USD 3.24 million of avoided leakage against USD 2.98 million realised, a ratio of 1.09. At a noise of 1.5 the ratio is 1.72, and at 2.0 it is 2.07. This constructed selection mechanism is motivated by the noisy-estimate analysis in Smith and Winkler [13]: ranking on noisy estimates and then crediting the plan with the estimated value overstates what the plan delivers.
In Equation 4, the hat denotes an estimate, s is the log standard deviation of its error and z_j is a standard normal draw. Define D_j^pi=min(C_j^pi,H); an unfinished workstream contributes H. P denotes pure estimated-ratio ordering, and U the uniform plan. Rho is the ratio of the mean estimated monetary gain to the mean realised monetary gain in this constructed comparison. It is not the mean of per-replication gain ratios. The error has mean one by construction. For a proposed field business case, retain pre-execution estimates and assess their calibration against independently defined outcomes. A comparison of scheduling policies needs a prespecified assignment design or justified observational identification assumptions; a held-out prediction review alone supplies no causal sequencing effect. Table 10 gives the sweep values.
| Noise in value-at-risk estimates (log s.d.) | Gain: value per effort | Gain: tier then ratio | Gain: cash-critical tier | Claimed gain over realised gain |
|---|---|---|---|---|
| 0.00 | 46.9% | 46.9% | 38.7% | 1.00 |
| 0.25 | 46.4% | 46.4% | 38.7% | 1.02 |
| 0.50 | 45.0% | 45.3% | 38.7% | 1.09 |
| 1.00 | 39.9% | 43.3% | 38.7% | 1.34 |
| 1.50 | 33.9% | 42.3% | 38.7% | 1.72 |
| 2.00 | 28.8% | 41.7% | 38.7% | 2.07 |
MatchPoint analysis of the constructed case. Model output under stated inputs; not an observed result. 1,000 replications per row; the last column is the ratio of claimed to realised gain from Equation 4. Claimed-to-realised ratios concern pure estimated-ratio ordering, not tier-then-ratio.
16 The modelled priority advantage declines across the tested capacity range
The capacity sweep varies the team from 4 to 24 persons. Uniform-plan leakage falls from USD 11.65 million to USD 6.53 million and USD 2.90 million. Tier-then-ratio gains are 48.7%, 45.1% and 29.3%. Reported clearance statistics are capped at week 52. With four persons, cash-critical work remains unfinished at week 52 in 99.1% of uniform-plan replications and 0.0% of tier-then-ratio replications. The reported uniform-plan mean of 52.0 weeks therefore reflects substantial horizon censoring; it is not an eventual mean completion time.
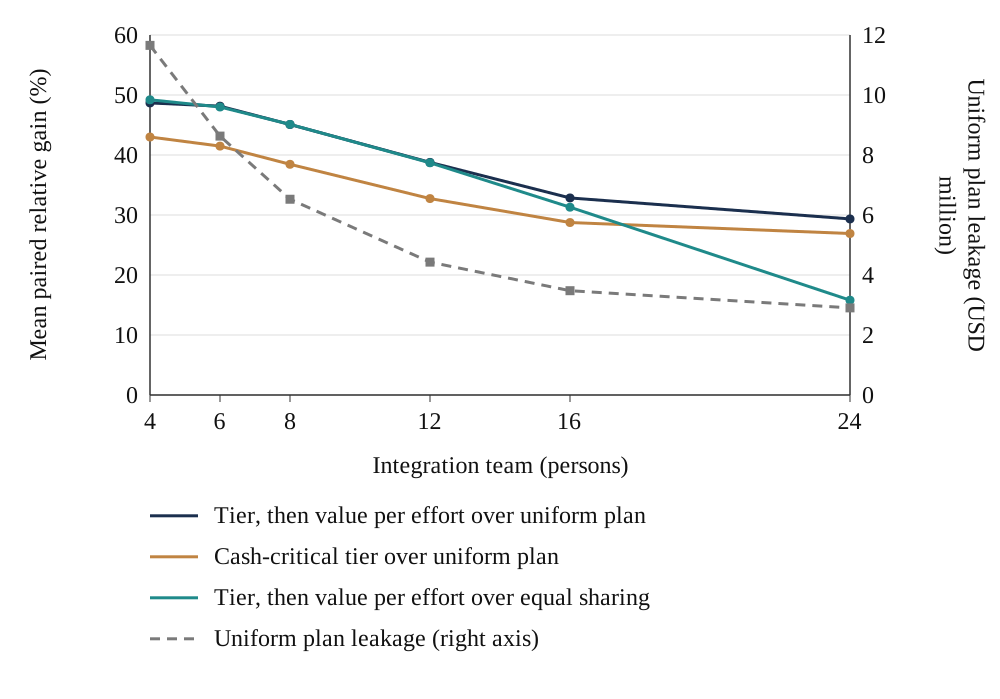
MatchPoint analysis of the constructed case. Model output under stated inputs; not an observed result. 1,000 replications per point; team size in persons.
Figure 4 shows the capacity pattern within the constructed case. The uniform comparator operates one workstream at a time within each active function queue. Equal sharing permits simultaneous allocation across eligible workstreams. Against equal sharing, tier-then-ratio gains 49.2% at 4 persons, 45.1% at 8 and 15.8% at 24. Its advantage at larger team sizes is smaller against this alternative baseline. These policy contrasts show that the comparator matters; they do not decompose the gain into separately identified queueing and ordering effects. A field comparison requires the actual capacity, capabilities and feasible baseline policies.
17 Stress signatures within the constructed cases
Seven cases are run, and Table 11 gives the results. The base case gains 45.1% with tier-then-ratio. A uniform effort overrun of 40 per cent raises uniform-plan leakage to USD 9.05 million and leaves the gain at 45.0%: the level rises while the ranking holds. An overrun of 80 per cent on cash-critical work alone raises it to USD 9.32 million, cuts the gain to 40.0% and delays tier A clearance to week 25.4, so both the level and the benefit deteriorate. Every reported clearance mean in these cases is horizon-capped; the corresponding unfinished fraction should accompany its interpretation.
When each cash-critical label is independently flipped with probability 30 per cent, the tier rule falls from 38.5% to 12.2% while tier-then-ratio holds 33.8%, under the specified error mechanism. Very noisy estimates, with a log standard deviation of 1.5, leave tier-then-ratio at 42.2%. When leakage is proportional to remaining work, the gain is 43.4% on a lower level of leakage of USD 4.95 million. The ranking holds under each of these, and the signature that distinguishes them is where the level and the clearance week move.
The last case multiplies each cash-critical workstream's effort by 2.86, making mean effort per workstream approximately equal across tiers. Uniform-plan leakage is USD 11.92 million. Tier-then-ratio gains 32.1%, smallest effort first 25.8%, and the tier-only rule 26.0%. The mean horizon-capped cash-critical clearance statistic under tier-then-ratio is 40.3 weeks, with 1.4% unfinished at week 52; 5.8% of exposure is retired by week 8. The difference between tier-then-ratio and smallest effort first is 6.3 percentage points in this stress case.
| Case | Uniform plan leakage | Gain: tier then ratio | Gain: cash-critical tier | Mean horizon-capped Tier A clearance, tier then ratio (weeks) | Value retired by week 8, tier then ratio | Tier A unfinished at week 52, tier then ratio |
|---|---|---|---|---|---|---|
| Base case | 6.53 | 45.1% | 38.5% | 14.1 | 47.4% | 0.0% |
| Uniform effort overrun of 40% | 9.05 | 45.0% | 38.8% | 19.8 | 33.9% | 0.0% |
| Overrun of 80% on cash-critical work only | 9.32 | 40.0% | 33.7% | 25.4 | 24.9% | 0.0% |
| Each workstream's cash-critical classification independently flipped with probability 30% | 6.53 | 33.8% | 12.2% | 22.0 | 39.6% | 0.0% |
| Value-at-risk estimates very noisy (log s.d. 1.5) | 6.53 | 42.2% | 38.5% | 14.3 | 44.6% | 0.0% |
| Leakage proportional to remaining work | 4.95 | 43.4% | 34.7% | 14.1 | 47.4% | 0.0% |
| Tier A mean workstream effort scaled to match tier B (2.86 times) | 11.92 | 32.1% | 26.0% | 40.3 | 5.8% | 1.4% |
MatchPoint analysis of the constructed case. Model output under stated inputs; not an observed result. 1,000 replications per case. The proportional-leakage case uses the proportional form for both uniform and priority leakage. Clearance is mean min(T_A,52), with unfinished-at-horizon fractions reported separately. Label errors are independent Bernoulli flips.
18 Report estimated exposure retired alongside completion and observed cash
At week 8 in the constructed case, the uniform plan has completed 10.0% of workstreams and retired 11.6% of exposure. Tier-then-ratio has completed 28.2% and retired 47.2%. The gap in exposure retired is 35.6 percentage points at week 8 and 24.1 at week 26, as reported in Table 12. Both task completion and exposure retired differ. The exposure-weighted measure reflects the assigned cash weights of completed work; the task count gives each workstream equal weight. Neither identifies counterfactual cash saved in an actual acquisition.
MatchPoint analysis of the constructed case. Model output under stated inputs; not an observed result. Mean of 2,000 replications.
Figure 5 compares planning measures within the constructed case. A field report can calculate estimated exposure retired from pre-agreed weights and dated completion tests. That measure remains dependent on the exposure assumptions and their time window. Observed receipts, payments and operating costs require separate evidence and reconciliation. The board pack should retain the register, applicable dates, estimate ranges, completion evidence and finance bridge, so that operating readiness and measured cash movements can be examined together.
| Week | Uniform plan: workstreams complete | Uniform plan: value at risk retired | Tier then ratio: workstreams complete | Tier then ratio: value at risk retired | Gap in retired value (points) |
|---|---|---|---|---|---|
| 4 | 0.4% | 0.4% | 11.1% | 21.1% | 20.7 |
| 8 | 10.0% | 11.6% | 28.2% | 47.2% | 35.6 |
| 12 | 22.0% | 25.2% | 45.8% | 67.5% | 42.4 |
| 26 | 58.8% | 64.5% | 70.7% | 88.6% | 24.1 |
MatchPoint analysis of the constructed case. Model output under stated inputs; not an observed result. Mean of 2,000 replications.
Report each effect with its identification status and sensitivity. The point estimate 45.3% belongs to the constructed scheduling model and should accompany the concentration, noise, capacity and stress results. Field records can contain dated completion evidence, recorded estimates and separately reconciled cash movements. Exposure under an unchosen schedule remains counterfactual and requires a justified comparison design. The claimed-to-realised ratio for the pure estimated-ratio policy is another model diagnostic, not a field cash measurement. The board report should retain the applicable legal version and the evidence behind any change in the plan.
The proposed synergy tracker should connect the scheduling register to a finance reconciliation. Each entry needs a baseline period, an agreed perimeter, the mechanism of the benefit, the expected start date, a responsible owner and the evidence required for recognition. One-off implementation costs should remain visible beside recurring benefits. A deferred saving should be distinguished from a saving lost permanently, and a reduction in receivables should be reconciled to collections, sales, write-offs and any financing movement. The schedule can identify the date at which a mechanism becomes operational. The finance bridge is needed to assess whether the anticipated economic result followed.
The same discipline applies when the transaction model already contains a synergy assumption. The integration tracker should map to that assumption and identify any change in scope, timing or confidence. Adding the tracker estimate to the acquisition model as a second benefit would duplicate the original investment case. A proposed board pack should therefore carry a single reference for each benefit, show the original underwriting assumption, and explain the current revision. Any claimed improvement in equity value requires its own cash-flow, cost and financing analysis. A percentage reduction in the simulation's leakage measure supplies no transaction valuation uplift by itself.
19 The constructed deal log overstates its known effect under the specified selection mechanism
The selection experiment draws a constructed population of 4,000 deals. Each has its own concentration of exposure, its own team size, its own tier A effort and an unobserved execution capability. Capable teams are more likely to adopt the priority plan and finish work faster under either plan. Concentrated deals are also more likely to adopt it, since the concentration is visible. For each deal the model scores the uniform and tier-then-ratio plans, so their true population-average effect is known: 17.42 points of ceiling leakage.
Figure 6 and Table 13 report the result. In a study that observes only the adopted plan, the naive difference between adopters and non-adopters averages 23.37 points with 400 logged deals, a bias of 5.95 points. Adjusting for the recorded concentration leaves a bias of 4.98 points. An oracle adjustment using the constructed latent capability leaves 0.22. That variable is known to the experiment and unavailable to its reported observational estimators. The randomised-slice mean is consistent with the constructed population effect within Monte Carlo error, with reported finite-simulation bias -0.02. The naive comparison in this constructed log overstates its known effect, and the part that adjustment can repair depends on what was recorded.
In Equation 5, A_d is adoption of the priority plan in deal d, z_d is standardised concentration, u_d is unobserved execution capability, the a coefficients are authored, y is leakage as a share of the ceiling, and tau is the true average effect. King and colleagues report evidence of potential moderators in post-acquisition performance [5]. The hidden execution-capability factor and its effect on adoption in this experiment are authored mechanisms; the meta-analysis does not identify or calibrate them. The model sets the size of the bias by construction, and the paper does not claim it is typical of real data.
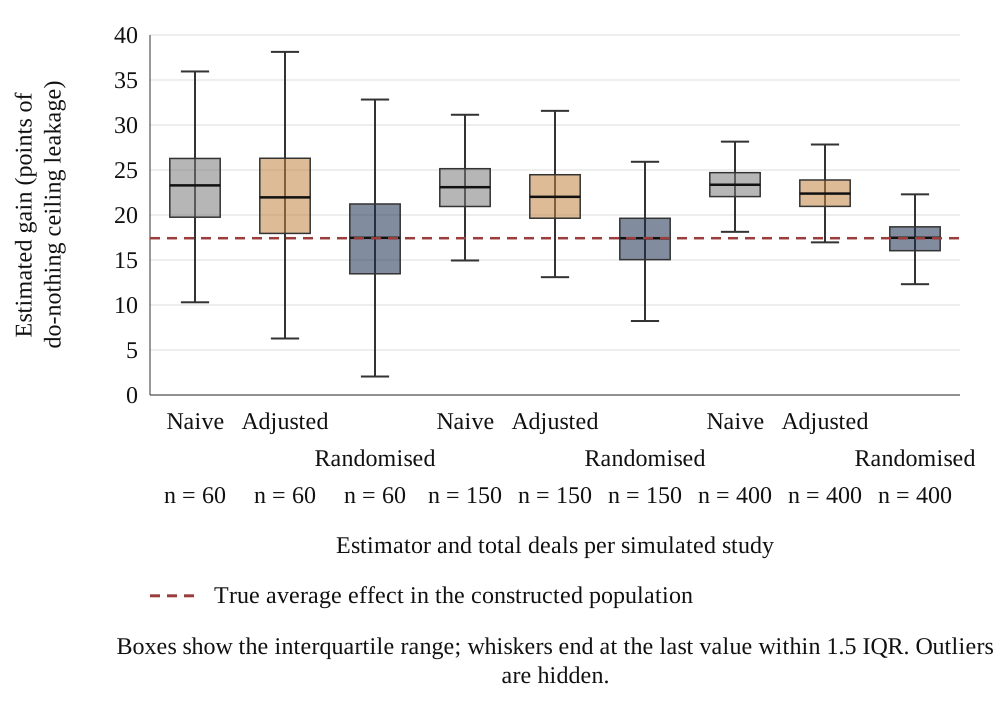
MatchPoint analysis of the constructed case. Model output under stated inputs; not an observed result. 600 simulated studies per box; the dashed line is the true average effect in the constructed population.
| Logged deals | Naive difference: mean (points) | Naive: s.d. | Adjusted for concentration: mean | Adjusted: s.d. | Randomised slice: s.d. | Randomised slice: power at 5% |
|---|---|---|---|---|---|---|
| 30 | 23.40 | 7.07 | 22.29 | 8.35 | 7.44 | 64.0% |
| 60 | 23.14 | 4.97 | 22.18 | 5.87 | 5.52 | 90.7% |
| 150 | 23.05 | 3.15 | 22.07 | 3.55 | 3.35 | 100.0% |
| 400 | 23.37 | 1.96 | 22.40 | 2.13 | 1.96 | 100.0% |
MatchPoint analysis of the constructed case. Model output under stated inputs; not an observed result. Points of ceiling leakage; 600 studies per row; observation noise of 15 points added to each deal outcome. Reported simulated power is the positive-direction rejection proportion at the two-sided 5 per cent normal threshold.
20 A proposed field evaluation needs prespecified units, outcomes and an effect worth detecting
A proposed field evaluation should distinguish the assignment unit from the workstream record. Whole eligible integrations, or demonstrably independent clusters, could receive an agreed scheduling policy at a prespecified time zero. Workstreams would supply the underlying dates, effort and completion evidence. Following the target-trial framework, the protocol should define eligibility, strategies, assignment, follow-up, outcome, causal contrast and analysis before examining results [16].
Maintain a screening log for transactions considered for participation and a separate outcome cohort defined by the eligibility rules at assignment. Obtain the required client authorisation and data-processing arrangements. Preserve all statutory and contractual obligations under every study policy. Use weights fixed before assignment for any estimated-exposure outcome, and collect separately defined cash outcomes from the finance records. The assignment and analysis must reflect shared services, clustering, adherence and missing outcomes. The simple deals-per-arm calculation below assumes independent units and requires a separate field-study design review.
Equation 6 gives the sample size per arm for a randomised comparison, in which sigma is the standard deviation of the model's normalised fifty-two-week leakage outcome, delta the effect to detect, and the z values are the normal quantiles for a 5 per cent two-sided test and 80 per cent power. With the constructed outcome standard deviation of 20.29 points, which includes 15 points of authored measurement noise, detecting the full model effect of 17.4 points needs 22 deals per arm. Detecting half of it, 8.7 points, needs 86, a quarter, 4.4 points, needs 341, and a tenth needs 2,129. These calculations concern that outcome and its authored variance. They do not power a proposed week-twelve exposure or another field outcome.
In Equation 6, n is independent units per arm, sigma is the outcome standard deviation, delta is the difference worth detecting, z denotes standard normal quantiles and Phi the standard normal distribution function. In Equation 6b, d=delta/(sigma sqrt(2/n)); both tails of the two-sided normal test are included. The calculated values for the model's fifty-two-week normalised leakage outcome illustrate sensitivity to the chosen effect size. A field study needs an economically meaningful target effect and a supported variance estimate, with separate provision for clustering, interference, attrition and outcome measurement. This paper supplies no estimate of the likely field effect.
The proposed field protocol should define eligibility and time zero before the outcome data are inspected. Eligibility might require a completed transaction, a documented integration perimeter and a team able to deliver either scheduling approach. Time zero would then be the point at which the eligible team is assigned its scheduling policy. Transactions abandoned before that point belong in a separate screening log with their reasons. Including them in the acquisition-outcome analysis without defining an outcome would create an incompatible denominator. Excluding a transaction because its integration later performed poorly would create a different selection problem. The protocol should distinguish those two decisions explicitly.
The assignment unit also requires a feasibility check. Business units that share a treasury platform, integration leadership or customer account may influence one another's outcomes. In that setting, assigning individual workstreams to competing policies would expose the comparison to interference. A proposed study could assign whole integrations or sufficiently independent clusters and document the remaining shared services. Its analysis would need to reflect clustering and the number of genuinely independent assignments. The simple sample-size equation in this paper assumes independent units and a continuous outcome. It does not include a design effect, attrition, multiple comparisons or unequal cluster sizes, so it should not be used as a procurement specification for a field study.
The primary outcome should be specified using evidence that is collected consistently under both policies. Estimated exposure retired can remain a planning measure, but its weights should be frozen before assignment and its interpretation kept separate from realised cash. Candidate cash measures require agreed definitions for overdue receipts, duplicated payments, lost discounts or other events inside the transaction perimeter. The protocol should name the observation window, data source, currency treatment and reconciliation rules. An outcome definition chosen after seeing which policy performed better would introduce another opportunity for selection. Any change needed after data collection begins should be dated and reported with its reason.
A credible implementation should retain both assignment and adherence records. The primary comparison can follow the assigned policy, while a separately labelled adherence analysis examines departures such as a statutory deadline, a critical customer incident or unavailable staff. Those departures should be recorded at the time, with the operational reason and its authorisation. Their presence is useful information about whether the proposed rule can be delivered. Restricting analysis to teams that followed the rule perfectly would select a different population and could reintroduce the capability bias illustrated in the constructed deal log. Missing outcomes and withdrawals should receive a prespecified treatment and sensitivity analysis.
21 Evaluate AI assisted extraction and scheduling separately
An AI-assisted register is a proposed workflow for evaluation. Candidate fields include renewal dates, notice periods and change-of-control clauses, each tied to a source passage and confirmed against the operative agreement and its amendments. The paper reports no test of extraction accuracy, staff cost or improvement in exposure estimates. Any use of confidential records requires the agreed access and processing controls. The proposed tests below separate document extraction from the value of the scheduling decision.
Smith and Winkler's result gives a reason to examine the calibration of estimates used in optimisation [13]. Held-out evidence can assess prediction and extraction quality. The causal effect of an integration policy requires a suitable comparative design, including the stated assignment and confounding assumptions. A claimed-to-realised ratio close to one describes calibration under the chosen measure; it does not by itself establish a financial benefit.
The experiment reports no trained model and no observed tool accuracy. A proposed evaluation should record the ranking before execution, retain independently checked input records, and compare forecast measures with separately defined observed outcomes. Prediction calibration, deadline feasibility, reviewer effort and economic outcomes should be reported separately. A comparative policy evaluation requires its own assignment design or justified observational identification assumptions; a held-out prediction set alone supplies no causal sequencing effect.
A proposed AI-assisted workflow should begin with permitted documents and explicit extraction fields. For a contract review, the output could identify the source document, clause location, counterparty, renewal date, notice period, change-of-control wording and the reviewer who confirmed it. An extraction without a traceable passage should remain outside the scheduling input. The reviewer should check the operative agreement and any amendment before accepting a date or obligation. Confidential transaction documents require the client's agreed access and processing arrangements. This paper makes no claim that an AI system has performed those checks or achieved a particular accuracy on an acquisition data room.
Evaluation should separate extraction accuracy from scheduling value. The proposed extraction test would compare outputs with independently checked records, reporting missed deadlines, incorrect counterparties, unsupported clauses and corrections by document type. A scheduling test would then examine the effect of those errors on feasibility and priority. A small date error close to a contractual deadline can matter more than a correctly extracted description. A tool's aggregate accuracy score therefore needs a decision-specific error analysis before it is used in the register. The experiment here varies numerical estimate noise; it does not test document extraction, clause interpretation, model drift or the security of an AI workflow.
22 Apply date constraints and capacity checks before ranking the remaining work by exposure per person-week
Begin with the proposed register and confirm the legal and contractual dates that apply to the acquired perimeter. For each date, record the prerequisites, closure evidence, relevant calendar and available capability, then identify the latest feasible start and reserve the required capacity. For work that remains eligible for prioritisation, the exposure-to-effort ratio and a documented cash-critical classification provide candidate ordering rules. The ninety-day cash-critical label is an authored choice in this paper and requires transaction-specific review. Apply the documented precedence rule and retain a change log. The simulation compares prioritisation policies; the deadline-feasibility control is an additional proposed step.
Weeks four and eight are proposed review points rather than times validated by the simulation. Reconcile the accepted completion evidence, current exposure assumptions and available capacity; record any revised ranking and the reason for it. The tested stresses identify candidate mechanisms to examine, including changed effort, noisy estimates and an unreliable cash-critical classification. They do not diagnose a real programme automatically. A different sequence should be assessed against actual deadlines, dependencies, capability and transition costs before staff are reassigned.
The procedure states what to do on the evidence available and does not claim it will beat the uniform plan in a particular deal. It also does not override a legal or contractual clock, and it is not investment advice. The next evidence a team should collect is its own register and a log of completion dates for every workstream, from the first deal in which it applies the procedure, so that the effect of the order can later be estimated against a randomised slice.
Tables 14 to 16 translate the proposed procedure into three working templates: a Day-One control timeline, a responsibility matrix and a synergy-to-cash tracker. They specify information and approvals to obtain. They do not report implementation in a client transaction or add a measured benefit to the experiment. Each template should be adapted to the signed perimeter, the transaction's lawful information-sharing arrangements and the actual systems and people available. The acquisition sponsor should identify the decision owner before completion, so that unresolved authority or a failed readiness test has a defined escalation route rather than an assumed owner.
The Day-One review should distinguish controls that must operate continuously from changes that can wait. Payroll funding, bank access, invoice routing and critical supplier payments need a tested continuity arrangement when they fall within the acquired perimeter. A later system migration can have a different completion date if a controlled transitional process remains available. The proposed timeline therefore records the latest feasible start, the dependency chain, the acceptance test and the fallback owner. It does not require every dated task to occupy the first place in a single queue. Where the available capacity cannot meet the required dates, the sponsor needs an explicit decision on resources, scope or continuity arrangements.
Responsibility should be attached to a deliverable and its acceptance evidence. The person preparing a migration or payment file need not be the person authorised to accept the resulting financial control. The proposed matrix assigns one accountable decision owner to each deliverable, identifies the team responsible for performing it, and lists the functions that must be consulted or informed. Any separation-of-duties requirement from the organisation's control framework remains applicable. The matrix should identify the authority of the acquired business and any transitional service provider as well as the acquirer. A workstream with two competing accountable owners should be resolved before its completion is relied upon.
At the week-four and week-eight reviews, the programme office should reconcile three records: the current plan, the evidence of operating readiness and the finance bridge. The review should identify which estimate changed, the source of the new information, the consequence for dependent work and the person accepting the revised order. Repeatedly changing priorities can consume capacity that the present simulation does not price. A change log should therefore distinguish an essential response to a new deadline or failed control from a discretionary preference. Where a transition is already in flight, the owner should assess interruption and reversal costs before moving staff to another workstream.
The sponsor's decision can then be expressed in terms that are open to later examination: maintain the present sequence, add a specific capability, defer a noncritical migration, or activate a documented continuity arrangement. The supporting pack should show the unresolved exposure range and the evidence still missing. A red status should name an operating condition or date at risk rather than a general impression of progress. The study protocol can subsequently use the dated decisions and completion tests to assess adherence. The templates provide that audit trail; they carry no claim that a particular sequence has already protected revenue, improved a valuation or delivered a specified financial return.
| Review point | Readiness decision | Evidence to inspect | Exception route |
|---|---|---|---|
| Before completion | Confirm perimeter, authority and dated obligations | Signed scope, authorised signatories, regulatory and contract calendar | Sponsor resolves unclear scope or authority |
| Before the first operating cut-off | Accept payment, payroll, billing and critical supplier continuity where applicable | Test results, funding and approved fallback | Control owner activates authorised continuity arrangement |
| Day One | Confirm which controls operate and which changes remain transitional | Accepted tests, open exceptions and accountable owners | Escalate failed acceptance tests |
| Week four | Reconcile actual readiness, dependencies and revised effort | Dated completion tests and register change log | Approve justified sequence or resource changes |
| Week eight | Reconcile remaining exposure and benefit evidence | Current register and finance bridge | Retain open assumptions; approve next review plan |
Proposed operating template; dates, applicability and owners must be completed for the actual transaction. No client implementation or measured benefit is reported.
| Deliverable | R | A | C | I |
|---|---|---|---|---|
| Payment and banking readiness | Treasury delivery team | Authorised treasury owner | Bank, acquired finance team, legal | Sponsor and integration office |
| Payroll continuity | Payroll delivery team | Accountable payroll owner | HR, treasury, local adviser | Sponsor and affected managers |
| Customer billing readiness | Billing and finance team | Revenue-process owner | Sales, IT, acquired business | Integration office |
| System migration acceptance | Migration delivery team | Designated system/control owner | Finance, security, operations | Sponsor and affected users |
| Synergy-to-cash reconciliation | Finance benefits team | Designated finance owner | Workstream owners and integration office | Sponsor and board committee |
R = responsible for the work; A = accountable for acceptance; C = consulted; I = informed. Role assignments require transaction-specific approval.
| Field group | Required record | Control purpose |
|---|---|---|
| Identity and perimeter | Unique benefit reference, entity, mechanism, owner | Link once to the acquisition case |
| Underwriting baseline | Original period, scope, timing and assumption | Retain the original investment-case comparison |
| Operating readiness | Completion test, acceptance evidence and date | Separate a working process from its financial result |
| Financial evidence | Receipts, payments, cost movements and reconciliation | Distinguish collected cash, timing and estimated benefit |
| Costs and revisions | One-off cost, recurring cost, scope and timing changes | Show the net effect without duplicate benefits |
| Review status | Evidence gaps, reviewer and next decision date | Keep unresolved assumptions visible |
Proposed fields to reconcile a scheduling milestone with financial evidence; no example amounts or achieved results are supplied.
23 Reproducibility controls and verification scope
The script fixes the seed and asserts 76 counted control calls, including identities and directional checks, all of which pass. They include agreement of Smith's rule with a brute-force optimum for one worker on five instances, the lower bound holding for every policy in every base replication, the proportional form never exceeding the full form, allocations within team size and staffing caps, precedence respected, retired exposure non-decreasing, and the first 50 replications reproducing exactly on a rerun. Further checks cover the water-filling allocation, the mean of the lognormal multipliers, the proper range of adoption probabilities and the unbiasedness of the randomised slice. Engine assertions also check allocations within the scheduling intervals. The independent numerical review separately tested the finite-horizon relaxation and replayed the scheduling logic; those review controls are distinct from the model's 76 counted calls.
Statistical quantities carry Monte Carlo standard errors where reported, within the reporting framework discussed by Morris, White and Crowther [15]. The base case uses 2,000 replications and each sweep point 1,000. The selection study draws a population of 4,000 deals and 600 studies per row. Gain standard errors use paired within-replication contrasts. Level and relative-gain standard errors describe different estimands and units; their magnitudes should be interpreted separately. Table 17 lists the principal controls. Where a table reports a mean without a standard error, its note states the replication count, and the standard errors for the base case are in Table 8. Replication counts in the other tables do not substitute for statistic-specific Monte Carlo standard errors; close point-estimate comparisons are descriptive.
The controls test numerical behaviour under the specified model. They do not validate its relationship to any transaction. The seed, inputs, policy definitions, units and random-number library version form the reproducibility record. Reported values are checked against the model's tables. Interpretation also requires explicit attention to stress-case policy contrasts, horizon-censored clearance times, estimator definitions and benchmark terminology.
The report separates three uncertainties. Monte Carlo error concerns the precision of a statistic across repeated draws under the specified mechanism. Input sensitivity concerns changes to the authored exposure, effort, capacity and noise assumptions. External validity concerns whether that mechanism and its economic interpretation fit an actual acquisition. Increasing replications addresses the first category; it supplies no new evidence for the other two. The sweeps explore selected input changes rather than a probability distribution over all feasible transactions. Their point estimates are not confidence intervals for a field benefit. A reproducible result can therefore remain unsuitable as a forecast for a particular transaction [15].
| Control | Expected result | Status |
|---|---|---|
| Smith rule against brute force: one worker, seven workstreams, five instances | Equal to the brute-force optimum | Passed |
| Progress lower bound against every policy in every base replication | Bound at or below proportional and full leakage (2,000 replications, nine policies) | Passed |
| Proportional leakage against full leakage | Never above full leakage | Passed |
| Leakage against the do-nothing ceiling | Never above the ceiling | Passed |
| Capacity and staffing limits in every scheduling interval | Allocations within team size and maximum staffing | Passed |
| Precedence | Successor completes after predecessor under every policy | Passed |
| Fixed seed | First 50 replications reproduce exactly | Passed |
| Concentration exponent of zero | Authored exposure rates equal; realised rates retain lognormal variation | Passed |
| Noise-free estimates | Claimed and realised gain agree within 5% | Passed |
| Lognormal multipliers | Mean one within 0.5% | Passed |
| Randomised slice | Unbiased for the constructed average effect within three standard errors | Passed |
| Finite-horizon progress-bound analytic cases | Two-job truncated horizon and completed one-job triangle | Passed |
| Total identities and directional checks asserted | 76 in the run, all passed | Passed |
MatchPoint analysis of the constructed case. Model output under stated inputs; not an observed result.
24 Limitations: the paper tests a rule under authored inputs, and the next decision is whether to randomise
The first limitation is circularity. Exposure drives both the ranking and the score, and tier A is constructed to hold most exposure in little effort, so the ranking rules benefit from the design. The experiment shows how ordering behaves when its premise holds. It does not show that exposure estimates are available, accurate or stable in a real transaction. The stress cases weaken the premise in specified ways, and each leaves a gain, but none removes the premise. For that reason the quick answer and the abstract state the gain as a model result and do not generalise it.
The second is simplification. Workstreams are independent except for five pairs, leakage stops at completion or falls in proportion to work, effort is deterministic apart from the multiplier, and the team is homogeneous. There are no external lead times, no interaction between workstreams that share a customer, no behavioural response from customers or staff to the order, and no cost of changing the plan. The deals in the selection study vary in a few dimensions only. None of these departures is tested beyond the cases reported. In particular, the simulation has no statutory dates, hard deadline constraints, skill-specific teams, minimum crews or switching costs. Fractional workers and instantaneous reassignment are assumed. The proposed date-feasibility and responsibility templates operate outside the tested engine.
The third limitation is evidence. No observed integration data, client record or outcome is used. The cited research motivates the model's structure, and the applicable legal texts provide calendar constraints. Under the authored variance and fifty-two-week normalised leakage outcome, the normal approximation requires 341 independent units per arm for one quarter of the constructed effect. A field study needs its own target effect, outcome, variance estimate and assignment design. The proposed procedure makes the order explicit; the simulation's percentages supply no observed integration benefit.
The appropriate next investment is a bounded validation exercise. A participating acquirer could first reconcile a small register to its actual controls and accounting records, test whether independent reviewers can agree on completion, and measure the completeness of the underlying data. That exercise would assess measurement feasibility and staff effort; it would not estimate a causal benefit from sequencing. A subsequent comparative study would need its own governance, consent, assignment design and analysis plan. Until such evidence is available, the proposed framework should be judged by the clarity of its assumptions, the feasibility of its schedule and the inspectability of its decisions, with the simulation retained as a worked test of an explicitly constructed mechanism.
References
- Homburg, C. and Bucerius, M. (2006). Is speed of integration really a success factor of mergers and acquisitions? An analysis of the role of internal and external relatedness. Strategic Management Journal 27(4), 347-367. https://doi.org/10.1002/smj.520
- Bauer, F. and Matzler, K. (2014). Antecedents of M&A success: The role of strategic complementarity, cultural fit, and degree and speed of integration. Strategic Management Journal 35(2), 269-291. https://doi.org/10.1002/smj.2091
- Larsson, R. and Finkelstein, S. (1999). Integrating strategic, organizational, and human resource perspectives on mergers and acquisitions: A case survey of synergy realization. Organization Science 10(1), 1-26. https://doi.org/10.1287/orsc.10.1.1
- Zollo, M. and Singh, H. (2004). Deliberate learning in corporate acquisitions: Post-acquisition strategies and integration capability in U.S. bank mergers. Strategic Management Journal 25(13), 1233-1256. https://doi.org/10.1002/smj.426
- King, D. R., Dalton, D. R., Daily, C. M. and Covin, J. G. (2004). Meta-analyses of post-acquisition performance: Indications of unidentified moderators. Strategic Management Journal 25(2), 187-200. https://doi.org/10.1002/smj.371
- Kato, J. and Schoenberg, R. (2014). The impact of post-merger integration on the customer-supplier relationship. Industrial Marketing Management 43(2), 335-345. https://doi.org/10.1016/j.indmarman.2013.10.001
- Hermelin, D., Koana, T. and Shabtay, D. (2025). Faster minimization of total weighted completion time on parallel machines. arXiv:2502.13631v1. https://arxiv.org/abs/2502.13631v1
- Ministry of Human Resources and Emiratisation, United Arab Emirates (2026). Ministerial Resolution No. 0340 of 2026 Concerning the Wage Protection System, Articles 1-5, 7-8 and Annex 1. https://www.mohre.gov.ae/assets/download/9e530b2e/Ministerial%20Resolution%20No.%200340%20of%202026.pdf.aspx
- Ministry of Finance, United Arab Emirates (2025). Ministerial Decision No. 243 of 2025 on the Electronic Invoicing System, as amended by Ministerial Decision No. 197 of 2026. https://mof.gov.ae/wp-content/uploads/2025/09/Ministerial-Decision-no.-243-of-2025-on-the-Electronic-Invoicing-System.pdf
- Ministry of Finance, United Arab Emirates (2025). Ministerial Decision No. 244 of 2025 on the Implementation of the Electronic Invoicing System, Articles 1 and 5, as amended by Ministerial Decision No. 66 of 2026. https://mof.gov.ae/wp-content/uploads/2025/09/Ministerial-Decision-No.-244-of-2025-on-the-Implementation-of-the-Electronic-Invoicing-System.pdf
- Ministry of Finance, United Arab Emirates (2026). Ministerial Decision No. 66 of 2026 amending Article 5(1)(a) of Ministerial Decision No. 244 of 2025. https://mof.gov.ae/wp-content/uploads/2026/05/Ministerial-Resolution-No.-66-of-2026-Amending-Certain-Provisions-of-Ministerial-Resolution-No.-244-of-2025-Regarding-the-Implementation-of-the-Electronic-Invoicing-System-En-20260514.pdf
- Ministry of Finance, United Arab Emirates (2026). Ministry of Finance announces targeted amendments to eInvoicing system decisions. 10 May. https://mof.gov.ae/en/news/ministry-of-finance-announces-targeted-amendments-to-einvoicing-system-decisions/
- Smith, J. E. and Winkler, R. L. (2006). The Optimizer's Curse: Skepticism and Postdecision Surprise in Decision Analysis. Management Science 52(3), 311-322. https://doi.org/10.1287/mnsc.1050.0451
- Buehler, R., Griffin, D. and Ross, M. (1994). Exploring the "planning fallacy": Why people underestimate their task completion times. Journal of Personality and Social Psychology 67(3), 366-381. https://doi.org/10.1037/0022-3514.67.3.366
- Morris, T. P., White, I. R. and Crowther, M. J. (2019). Using simulation studies to evaluate statistical methods. Statistics in Medicine 38(11), 2074-2102. https://doi.org/10.1002/sim.8086
- Hernán, M. A. and Robins, J. M. (2016). Using Big Data to Emulate a Target Trial When a Randomized Trial Is Not Available. American Journal of Epidemiology 183(8), 758-764. https://doi.org/10.1093/aje/kwv254
- Ministry of Finance, United Arab Emirates (2026). Ministerial Decision No. 197 of 2026 amending certain provisions of Ministerial Decision No. 243 of 2025 on the Electronic Invoicing System, Articles One, Two and Four. https://mof.gov.ae/wp-content/uploads/2026/10/Ministerial-Decision-No.-197-of-2026-%E2%80%93-Amending-Certain-Provisions-of-Ministerial-Decision-No.-243-of-2025-on-the-Electronic-Invoicing-System_En.pdf
- Cabinet of the United Arab Emirates (2026). Cabinet Decision No. 173 of 2026 on the Violations and Administrative Penalties Resulting from Violation of the Legislation Regulating the Electronic Invoicing System, Articles 2-5 and annex. https://mof.gov.ae/wp-content/uploads/2026/10/Cabinet-Decision-No.-173-of-2026-On-the-Violations-and-Administrative-Penalties-Resulting-from-Violation-of-the-Legislation-Regulating-the-Electronic-Invoicing-System_En.pdf
About the Author
Chennakeshav (CK) is a corporate finance and investment banking executive with 25+ years of global experience in deal origination, structuring and execution across M&A, growth capital and corporate strategy. He has led value-creation mandates for founders, corporates and funds — bridging the boardroom view to hands-on execution and close.
His career spans Morgan Stanley, HSBC, Lloyds Banking Group, EWEC, ADQ portfolio companies and Emirates Growth Fund, across TMT, real estate, fintech, deeptech, cleantech, infrastructure and energy. He has partnered with C-suite leaders, private equity and venture funds, sovereign wealth funds and family offices to finance complex fund raises and scale-up ventures, and has led M&A due diligence, post-merger integration and business-transformation initiatives to create value.
At Matchpoint Partners he is Managing Partner, leading the firm's corporate finance, M&A and capital-raising practice. He holds an MBA from London Business School, an engineering degree from VTU and a Master of Laws (LLM, in progress) from UCL London.
An active start-up mentor, CK mentors at Techstars, DIFC FinTech Hive, Startup Grind, Founder Institute and IN5, serves as Entrepreneur Mentor in Residence (EMiR) at London Business School, and judges the Entrepreneurship World Cup.
https://www.linkedin.com/in/ckadya/
https://www.matchpoint-partners.com/team/ck-adya.html
Disclaimer
This paper is part of a continuing series on the structure of private and alternative markets. The views expressed are the author's own. The paper is for information only, describes market structure in general terms, and does not constitute investment, legal, tax or regulatory advice or a recommendation in respect of any security, vehicle or counterparty.
