

1 When early screening adds value
A raiser with a longlist of capital providers faces a decision that precedes every meeting: which questions to settle before asking for time. Each early check consumes analyst hours and delays the approach, and each can reject a counterparty that would have committed. The checks examined here are eligibility to receive the offer, fit with the published mandate, timing of available capital, and clearance of the source of funds. This paper asks which of them reduce meeting volume without losing fundable counterparties, and in which order they should be run. The model's no-screen case is a numerical benchmark. In practice, permission to contact and mandatory eligibility or compliance checks remain in force; compare commercial screening policies only within the set of lawful alternatives.
The question is narrower than counterparty ranking. A ranking orders names by expected response; a screen removes names that cannot convert at all. The distinction matters because a screen applies a hard rejection, so its errors are permanent for the campaign, whereas a ranking only changes the order of approach. A rejected counterparty is rarely contacted again, which means the fundable names a screen loses are never observed in the raiser's own records. The loss is silent, while the saving is visible in the hours spent.
The audience is founders, chief financial officers and sponsors raising private capital, and fund managers raising from limited partners, with a Gulf and global lens. A Gulf raiser may approach a mixed list: institutions regulated in several jurisdictions, family offices with informal mandates and individuals whose eligibility depends on the regime of the offeror. The same four checks apply to each, but the rules that define the first and the last differ, which is why the paper reads the rule texts before it builds a model.
We build the framework from published rules and evidence on investor screening, then run an authored experiment. No observed outreach dataset is held, and the experiment reports no observed result. It computes, for 65 ordered sets of four checks, the meetings avoided, the fundable counterparties lost and the net value in analyst hours, under stated inputs. The purpose is to show how the trade-off behaves and to specify the evidence that a consented study would need before any figure could be treated as a market fact.
2 A meeting cannot convert when any of four structural conditions fails, and the outcome is counted at a signed commitment
The outcome is defined before the instrument. A counterparty is fundable for a stated raise when four conditions hold at the date of approach: it may lawfully receive the offer, the raise falls within its mandate, it has live capital and a decision route, and its source of funds can be evidenced and cleared. A meeting with a counterparty for which any condition fails is a meeting that cannot convert. The outcome counted is a signed commitment, not a meeting held and not an expression of interest.
Fundable does not mean certain to commit. A fundable counterparty that is met signs a commitment with a probability below one, because price, terms, diligence findings and competing opportunities remain open. The model therefore separates structural convertibility, which the early checks test, from commercial conversion, which they do not. The model holds the commitment probability constant for structurally fundable meetings across policies. Real screening can change which fundable counterparties are met or how they respond; the direction and size of any effect on conversion are unknown.
Table 1 sets out the four conditions, what each check looks for, where the evidence sits and who carries the legal duty, where one exists. Only the first and last conditions engage rules of general application. Mandate and timing are commercial facts established from the counterparty's own documents and answers. The table is a proposed record for diligence and is not a finding about any counterparty. Each row is one condition in the definition of the outcome, so a counterparty that fails any row cannot reach a signed commitment for this raise, however good the meeting. The order of the rows is not the order in which the checks should be run, which is a question the experiment answers later.
Scroll across to see all columns.
| Condition | What the check looks for | Where the evidence sits | Legal duty |
|---|---|---|---|
| Eligibility | A category that permits receipt of the offer | Classification record, register entry, written certification | Offeror or authorised firm |
| Mandate | Sector, ticket, instrument and geography fit | Fund documents and published policy | None; commercial |
| Timing | Capital available now and a named decision route | The counterparty's own answer | None; commercial |
| Funds | Beneficial owner and source of funds evidence | Onboarding file of the responsible firm | Responsible regulated entity, where applicable |
MatchPoint framework. Proposed record; the legal references are developed in the sections that follow and are cited there.
3 United States rules make eligibility a testable threshold, and general solicitation adds a duty to verify it
Rule 501(a) lists several routes to accredited investor status. Under the individual net-worth route, net worth must exceed USD 1 million individually or jointly with a spouse or spousal equivalent. The primary residence is excluded as an asset, and related debt is subject to specific rules. The separate income route requires more than USD 200,000 individually or more than USD 300,000 jointly in each of the two preceding years, with a reasonable expectation of reaching the same income level in the current year. Specified entities can qualify under paragraph (a)(3) with total assets above USD 5 million if they were not formed specifically to buy the offered securities. A Commission-designated credential held in good standing is another route. These are selected categories from the rule. [1]
Rule 506(c) permits general solicitation subject to conditions, including that all purchasers are accredited investors and the issuer takes reasonable steps to verify their status. For natural persons, the regulation sets out non-exclusive, non-mandatory verification methods. These include reviewing specified income documents for the two most recent years and obtaining a written representation about current-year income. The net-worth method involves specified recent asset and liability documentation and a written liabilities representation. Another method uses written confirmation of recent verification from a qualifying third party, such as a registered broker-dealer, an SEC-registered investment adviser, a licensed attorney or a certified public accountant. [2]
An initial screen may indicate which category to investigate and what evidence to request. Issuer verification under Rule 506(c) remains a separate step before a sale; the first-pass model does not substitute for it. The regulation does not provide a longlist's qualification rate or the accuracy, cost and timing of a preliminary check. These are constructed inputs in the experiment.
4 Classification tests differ by jurisdiction, so one eligibility check cannot serve a global longlist
The FCA Handbook distinguishes per se and elective professional clients. Per se clients include certain regulated financial entities and large undertakings. For MiFID or equivalent third-country business, the large-undertaking test uses two of three thresholds: EUR 20 million balance sheet total, EUR 40 million net turnover and EUR 2 million own funds. For other business, one route uses at least GBP 5 million of called-up share capital or net assets, with a two-year lookback and specified group-company provisions. Under the general elective rules, the firm assesses the client's expertise, experience and knowledge and applies the two-of-three quantitative test for MiFID or equivalent third-country business. The procedure includes a written request, a written warning and a separate written acknowledgement. Local public authorities and municipalities have separate provisions. [3]
The Dubai International Financial Centre rulebook requires an authorised firm to classify a person as a retail client, professional client or market counterparty before carrying on a financial service, and treats anyone not classified otherwise as retail. A deemed professional client includes a large undertaking meeting two of USD 20 million balance sheet total, USD 40 million net annual turnover and USD 2 million own funds. An assessed individual needs net assets of at least USD 1 million and either relevant professional employment in the previous two years or reasonable grounds for sufficient experience. An undertaking needs own funds or called-up capital of at least USD 1 million and the same experience analysis. The text reviewed is the consolidated version 51 of July 2026, current at the date of access, in which these rules read as they did in version 48 of March 2025. [4]
Table 2 sets the three regimes side by side. The comparison shows that an investor eligible in one jurisdiction may be ineligible in another for the same offer, and that classification is attached to the service and the counterparty, not to the counterparty alone. The texts establish the tests. They do not establish how a raiser should treat a counterparty whose category is unclear, and they say nothing about Saudi Arabia, whose capital markets text was not reviewed for this paper.
Scroll across to see all columns.
| Regime | Individual test | Entity test | Procedure or verification |
|---|---|---|---|
| United States, accredited investor | Net worth above USD 1m, or individual income above USD 200k (joint income above USD 300k) | Total assets above USD 5m; the entity was not formed specifically to acquire the securities offered | Reasonable steps to verify where general solicitation is used |
| United Kingdom, professional client | Elective: qualitative assessment; two of three quantitative criteria for MiFID or equivalent third-country business | Two of EUR 20m, EUR 40m and EUR 2m for MiFID or equivalent third-country business; one other route uses GBP 5m called-up capital or net assets | Written request, warning and separate acknowledgement |
| DIFC, professional client | Net assets of at least USD 1m plus relevant employment or experience analysis | Own funds or called-up capital of at least USD 1m, plus the experience assessment; or deemed professional as a large undertaking | Classify before carrying on the service |
Rule texts as read for this paper: SEC Rule 501(a) and 506(c) [1, 2]; FCA COBS 3.5, live Handbook text [3]; DFSA Conduct of Business module, version 51, July 2026 [4]. Thresholds are stated as published and are not advice on classification.
5 Who verifies the source of funds, and when onboarding rules require it
Recommendation 10 of the Financial Action Task Force sets an international standard for customer due diligence when a financial institution establishes a business relationship. It calls for identifying and verifying the customer, taking reasonable measures to verify the beneficial owner's identity, understanding ownership and control as applicable, establishing the purpose and intended nature of the relationship, and conducting ongoing due diligence. That includes scrutinising the source of funds where necessary. The standard is implemented through national measures; the edition reviewed was amended in June 2026. [5]
The ADGM anti-money laundering rulebook, version 11, requires customer due diligence at the applicable point under Rule 8.2.1, such as when establishing the relationship or before the relevant transaction or service. Under Rule 8.2.2, deferral of customer and beneficial-owner identity verification is conditional on little and effectively managed money-laundering risk, necessity to maintain the normal course of business, and completion as soon as possible and no later than 20 business days, subject to the rule's failure procedures. Enhanced due diligence includes identifying and verifying source of funds and source of wealth as applicable. [6]
The responsible regulated entity must check the source of funds when the applicable rules require it. The cited ADGM deferral concerns customer and beneficial-owner identity verification and is conditional. The sources leave open the timing of any discretionary preliminary enquiry by the raiser. The experiment treats the funds check as the most expensive and slowest of the four, with a stated sensitivity and latency, and tests whether running it before a meeting pays. The answer depends on the cost of the meeting and the value of the commitment, and is reported in the break-even analysis.
For a fund manager raising from limited partners, identify which regulated entity is responsible for onboarding and when its duties arise. The model compares starting a discretionary preliminary funds enquiry before a first meeting, focusing on counterparties likely to proceed, or waiting until terms have been discussed. It prices the cost and delay of the enquiry and the loss of fundable counterparties rejected in error. It does not price or alter the regulated entity's due diligence obligations.
6 Consent and direct-marketing law set the terms on which a screening enquiry may be sent
A timing enquiry or a request for classification evidence may be sent by electronic mail. Where it amounts to unsolicited direct marketing in the United Kingdom, regulation 22 of the Privacy and Electronic Communications Regulations generally requires prior consent for individual subscribers, including sole traders and ordinary partnerships. For products or services, the soft opt-in has conditions concerning how contact details were obtained, the similarity of the sender's products or services, and opportunities to opt out. A separate charitable-purpose exception is outside this paper's commercial setting. [7, 8] The ICO explains that the consent and soft opt-in requirements do not apply to corporate subscribers. The sender must still identify itself and provide a valid opt-out address; data-protection obligations may also apply where personal data are processed. [8]
The United Arab Emirates Federal Decree-Law No. 45 of 2021 on personal data protection took effect on 2 January 2022. Article 2 defines the scope, including certain processing outside the UAE, and excludes companies and establishments in free zones that have their own personal data protection legislation. Article 4 sets out the consent rule and statutory exceptions; consent is not the only basis for processing covered by the law. This paper does not assess the separate DIFC or ADGM data protection regimes. [9]
The study design separates contact permission from the legal basis for processing personal data. Subscriber type affects the United Kingdom's PECR rules for a first unsolicited marketing email. A screening enquiry may itself be marketing; its content and context matter. Before recording outreach responses, the study operator should determine the applicable data-protection basis and what notice to provide, if required. This paper gives no legal advice on any particular enquiry.
A practical rule follows for the study design. Every contact record should carry the subscriber type, the date of any consent or notice, and a suppression flag that stops further outreach. A rejected counterparty should not be deleted without a decision, because the record of why it was rejected is the evidence that lets a later audit measure the screen. Retention periods, the lawful basis for keeping rejected names and the handling of data about individuals at investors are decisions for the data protection adviser of the party running the study.
7 A venture capital survey reports 101 opportunities considered per closed deal on average
The closest published evidence on funnel ratios is a survey of institutional venture capital investors. The authors report responses from 885 investors at 681 firms. The survey's median firm-level counts were 200 opportunities considered and four closed investments over the previous twelve months. Per closed deal, the firm considers about 101 opportunities, meets the management of 28, reviews 10 with partners, runs due diligence on 4.8 and offers a term sheet to 1.7. Due diligence takes on average 118 hours over an 83-day closing period. [10]
Table 3 reproduces the funnel. The evidence establishes that investors apply selective, staged screening and that most opportunities fall away before a meeting with management. It also shows that each stage is reached by a decreasing share of the one before. It does not show the raiser's funnel. The survey records what investors reject among the companies approaching them, not how many approached investors were never fundable for the raise. Its respondents are venture investors, so the ratios do not transfer to private credit, real estate or fund placement.
A randomised field experiment on an online platform varied the content of introduction emails to investors and measured whether recipients clicked to learn more. It found that information on the founding team moved investor interest most. [11] The study establishes that randomised variation within outreach is feasible and informative. Its outcome is expressed interest, not a signed commitment, so it cannot show which checks lose fundable counterparties. The model's design for a real study borrows the randomisation and replaces the outcome.
Scroll across to see all columns.
| Stage | Median per firm in twelve months | Mean per closed deal |
|---|---|---|
| Considered | 200 | 101 |
| Met management | 50 | 28 |
| Reviewed with partners | 20 | 10 |
| Exercised due diligence | 12 | 4.8 |
| Offered term sheet | 5.5 | 1.7 |
| Closed | 4.0 | 1 |
Gompers, Gornall, Kaplan and Strebulaev, NBER Working Paper 22587, Table 6, all-firm column [10]. Median number reaching each stage in the past twelve months, and mean number per closed deal. Survey of investors, not a raiser outcome.
8 An ordering rule for independent checks
Optimal search theory characterises how to inspect alternatives when each inspection has a cost. Weitzman's 1979 result shows that the optimal strategy is an elementary reservation price rule, with a reservation price computed for each source. [12] That literature concerns finding the best of several alternatives. A conjunctive screen is a different problem: a counterparty must pass every check, and the first failure ends the work on it. The reservation price rule is therefore not applied here, and the paper relies only on the published abstract of that work.
The closer problem is sequential testing of a series system, where components are tested one by one until one fails. A recent review reports a result due to Butterworth: for a series function with independent components, it is optimal to test in non-decreasing order of the ratio of cost to the probability of failure. The review adds that for series and parallel systems a full order is optimal but that this does not hold for general systems, where the solution is a decision tree. [13] The review, since published in Discrete Applied Mathematics, is a secondary statement of the 1972 result; the original paper was not reviewed for this one.
The consequence for the design is specific. Under independence, the cheapest order of a fixed set of checks ranks them by cost divided by rejection probability. The rule contains nothing about errors that remove fundable counterparties, because under independence the product of sensitivities does not depend on order. The model therefore tests the rule against all 24 orders, then tests how it behaves when the underlying conditions are correlated. The sources justify the rule under stated assumptions. They supply no costs or probabilities.
9 The experiment gives each check a cost, a pass rate, an error rate and a delay
The experiment is constructed. A longlist of 1,000 names is screened by an ordered subset of four checks, which yields 65 policies including no screening. Each check tests one condition. A counterparty that meets the condition passes with the check's sensitivity, and one that does not meet it fails with the check's specificity. Check errors are independent conditional on the underlying conditions. The correlation stress case changes the dependence among those conditions while retaining conditional independence of check errors. Table 4 states the check inputs and Table 5 the population and decision inputs.
Every input is authored. The prevalences make 11.9% of names fundable. A met fundable counterparty commits with probability 0.30. A meeting costs 6.0 analyst hours, and a commitment is valued at 400 hours, a figure chosen to place the base case in the region where the decision is contested, not an estimate of any fee. A fundable counterparty's window closes at a daily hazard of 0.002, so each day of delay before the meeting removes a small share of fundable names. Delay is the cost of sequential checks that wait for replies.
The inputs for sensitivity and specificity encode a plausible ordering of difficulty. A classification check against a register errs rarely, a mandate screen from documents errs more because documents are stale or ambiguous, and an enquiry about timing errs most because non-response is scored as failure. The ordering is an assumption and is not drawn from data. Section by section, the results show how much each conclusion depends on those numbers, and the break-even and stress analyses vary the ones that matter most.
Scroll across to see all columns.
| Check | Condition tested | Cost (hours per name) | Sensitivity | Specificity | Latency (days) |
|---|---|---|---|---|---|
| Eligibility | Counterparty may lawfully receive the offer | 0.05 | 0.97 | 0.85 | 0 |
| Mandate | Sector, ticket, instrument and geography fit | 0.40 | 0.90 | 0.88 | 1 |
| Timing | Capital is live and a decision route exists | 0.30 | 0.85 | 0.80 | 5 |
| Funds | Source of funds can be evidenced and cleared | 1.50 | 0.95 | 0.90 | 7 |
Authored model inputs; no observed data. Cost in analyst hours per name; sensitivity is the probability that a name meeting the condition passes; specificity is the probability that a name failing the condition is rejected.
Scroll across to see all columns.
| Input | Value | Role in the model |
|---|---|---|
| Names per campaign | 1,000 | Scale; all results are per 1,000 names |
| Eligibility and funds prevalence | 0.80 and 0.85 | Share of names for which each condition holds |
| Mandate and timing prevalence | 0.35 and 0.50 | Share of names for which each condition holds |
| Fundable share | 11.9% | Product of the four prevalences when independent |
| Commitment given a fundable meeting | 0.30 | Same for every fundable counterparty |
| Meeting cost | 6.0 hours | Preparation, meeting and follow-up |
| Value of one commitment | 400 hours | Converts lost commitments into hours |
| Daily hazard of window closing | 0.002 | Applies to fundable names only |
| Factor correlation of conditions | 0 (base); 0.5 (stress) | Gaussian one-factor structure |
Authored model inputs; no observed data. Hours are analyst hours.
10 Fundable retention is the product of sensitivities, and net value trades meetings saved against commitments lost
A fundable counterparty satisfies all four conditions, so at each check it passes with that check's sensitivity. Equation 1 states the fundable share and the share of fundable counterparties that survive a policy to be met. The delay factor reflects the closing of windows during the checks. Equation 2 gives the expected screening hours and the net value of a policy, in analyst hours. Both are expectations over the longlist, computed exactly from the joint probability of the four conditions, and both are stated per 1,000 names so that the results scale to any campaign size.
In equation 1, pₖ is the share of names meeting condition k, so φ is the fundable share when conditions are independent. The subscript π denotes a policy, an ordered set of checks. For check j, sⱼ is its sensitivity, λ is the daily hazard that a fundable window closes, and D is the total latency in days of the checks in the policy. R is the share of fundable counterparties that are met. Because a fundable name must satisfy every condition, adding a check can only lower R.
In equation 2, N is the number of names, c₍ₖ₎ is the cost in hours of the k-th check in the policy, and Aₖ is the probability that a name is still in the process after the k-th check, with A₀ equal to one. S is the screening hours. U is the net value: v is the value of a commitment in hours, q is the probability that a met fundable counterparty commits, and m is the cost of a meeting. The last term charges every meeting held, including those that cannot convert. All results are expected values computed exactly, with a simulation as an independent check.
11 Checking eligibility then mandate removes 75.8% of meetings that cannot convert and loses 12.9% of fundable names
The no-screen benchmark holds 1,000 meetings, 881 with names that cannot convert, for 35.7 expected commitments in 6,000 hours. In the best modelled policy, Eligibility > Mandate, 213 of 317 meetings cannot convert. The policy avoids 668 such meetings per 1,000 names.
Scroll across to see all columns.
| Policy | Meetings | Cannot convert | Fundables met | Fundables lost | Commit-ments | Total hours | Net value | Hours per commit-ment |
|---|---|---|---|---|---|---|---|---|
| No screening | 1,000 | 881 | 119.0 | 0.0% | 35.7 | 6,000 | 8,280 | 168.1 |
| Eligibility only | 806 | 691 | 115.4 | 3.0% | 34.6 | 4,886 | 8,966 | 141.1 |
| Mandate only | 393 | 286 | 106.9 | 10.2% | 32.1 | 2,758 | 10,068 | 86.0 |
| Eligibility > Mandate (highest net value) | 317 | 213 | 103.7 | 12.9% | 31.1 | 2,273 | 10,169 | 73.1 |
| Eligibility > Mandate > Funds | 261 | 163 | 97.1 | 18.4% | 29.1 | 2,411 | 9,244 | 82.7 |
| All four, conventional order | 137 | 55 | 81.7 | 31.3% | 24.5 | 1,538 | 8,271 | 62.7 |
| All four, ratio-rule order | 137 | 55 | 81.7 | 31.3% | 24.5 | 1,531 | 8,277 | 62.4 |
| Perfect screen at zero cost | 119 | 0 | 119.0 | 0.0% | 35.7 | 714 | 13,566 | 20.0 |
MatchPoint analysis of the constructed population. Model output under stated inputs; not an observed result. Hours are analyst hours; net value is commitments times 400 hours less total hours. Rounded display.
The gain has a price. The policy loses 15.3 fundable counterparties, 12.9% of the 119, and expected commitments fall from 35.7 to 31.1. Whether this trade pays depends on the value placed on a lost commitment, which the break-even analysis later varies directly. Total hours fall by 3,727 and net value rises by 1,889 hours. For each fundable name lost, 44 non-convertible meetings are avoided. Commitments per meeting rise from 3.6% to 9.8%, a statistic that looks like improved quality while commitments in total have fallen. A raiser that reports only the conversion rate per meeting would see an improvement and miss the fall in the total.
Two benchmarks put the result in context. The upper benchmark is a perfect screen at zero cost, which meets only the 119 fundable names, spends 714 hours and has net value 13,566. The no-screen benchmark has net value 8,280. The best realisable policy has net value 10,169, which closes 36% of the gap between the no-screen and upper benchmarks. The gap that remains is the cost of checking and the fundable names that the checks reject in error. Running all four checks gives net value 8,271, against 8,280 for no screening: a complete screening pipeline buys no gain at these inputs.
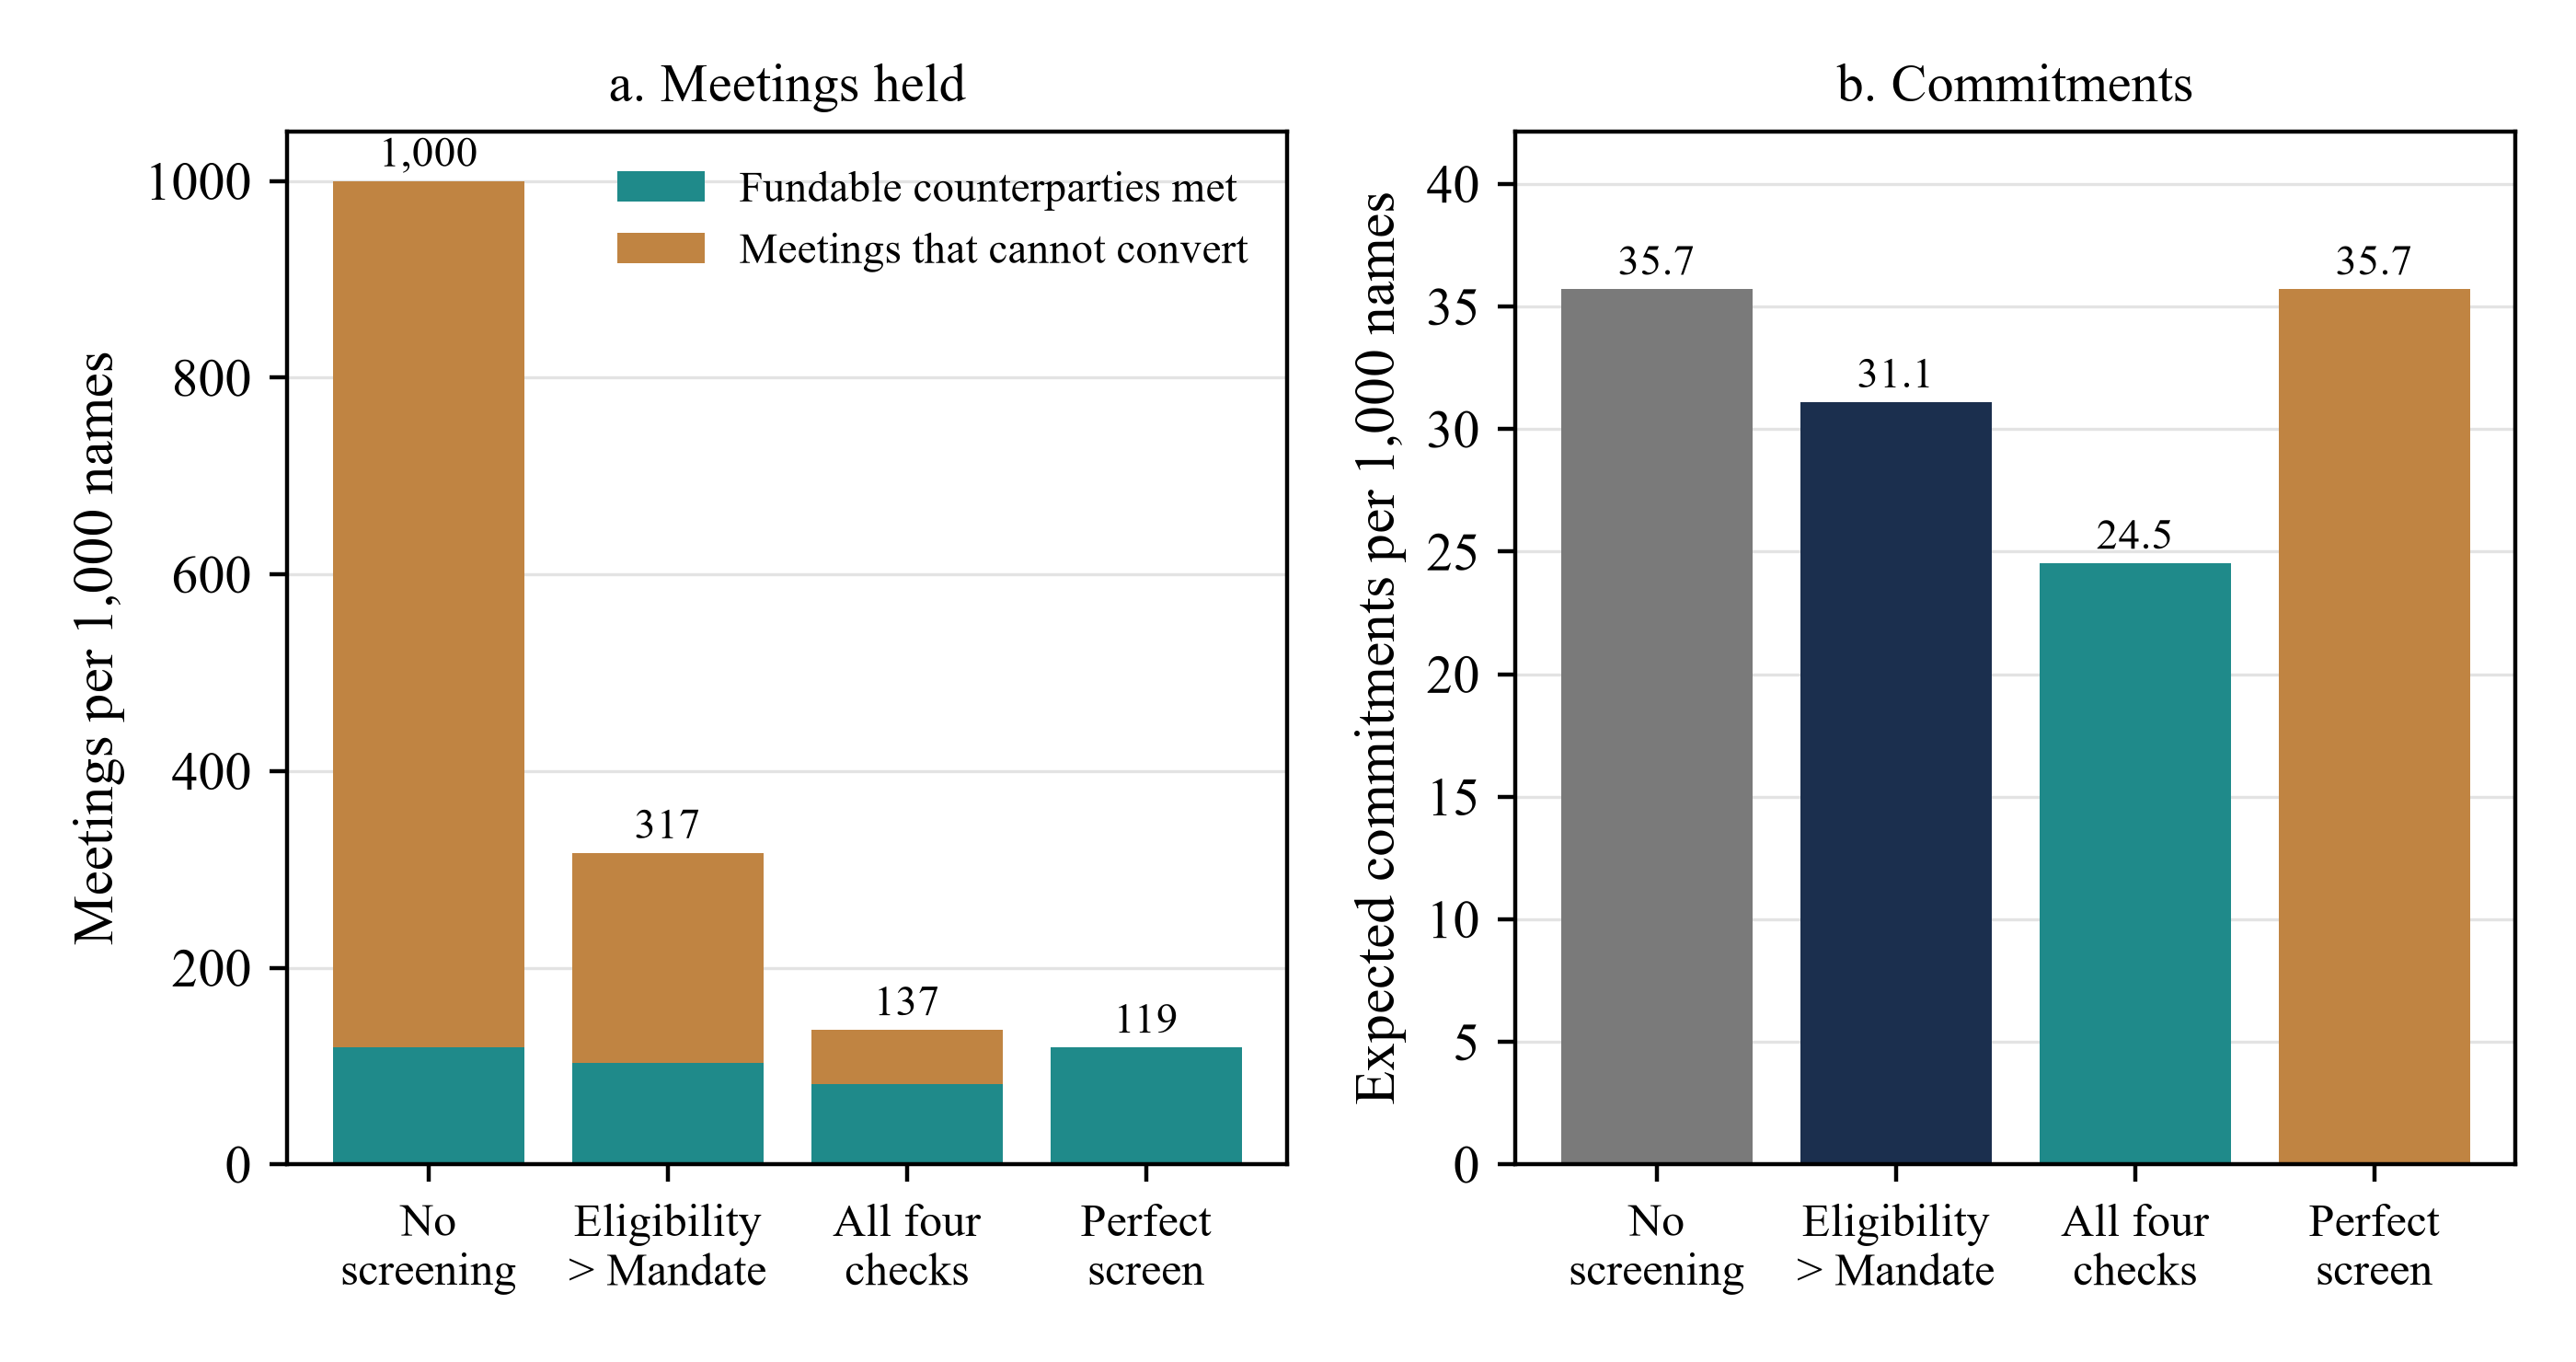
MatchPoint analysis of the constructed population. Model output under stated inputs; not an observed result. Expected values per 1,000 names.
12 Attrition falls hardest on non-convertible names, but every check also removes fundable ones
Figure 2 follows the survivors of the four checks in the order the ratio rule prescribes, separating names that cannot convert from fundable counterparties. The non-convertible group falls from 881 names to 53 after the last check. The fundable group falls from 119 to 84 after the last check, and to 82 once the closing of windows during the checks is applied. The checks remove a far larger share of the names that cannot convert than of fundable names, yet the fundable curve is not flat, because each pass probability is below one and the delay factor applies to the whole chain. The retained share of fundable names equals the product of the four sensitivities and the delay factor, which is why a long chain of individually reliable checks loses a large share of fundable names.
The shape of the two curves is the diagnostic. A screen that works as intended shows a steep fall on the left panel and a shallow fall on the right panel. A screen with weak sensitivity shows a fall on both. The raiser sees only the left panel in practice, since a rejected name is never met and its fundability is never learned. The asymmetry between a visible gain and an invisible loss is the central measurement problem of the subject and returns in the sections on selection and sample size.
The funds check is the clearest case. It is the most expensive at 8.451 hours per unit of rejection probability on the ratio scale, and it removes fundable names at a rate of five per cent per check before delay. Run on the names that survive the three earlier checks its total cost is small, because few names remain, yet it still lowers expected commitments. Whether its protection against a failed closing is worth that loss depends on a loss the model does not contain, namely the cost of a commitment that fails at clearance after it is signed.
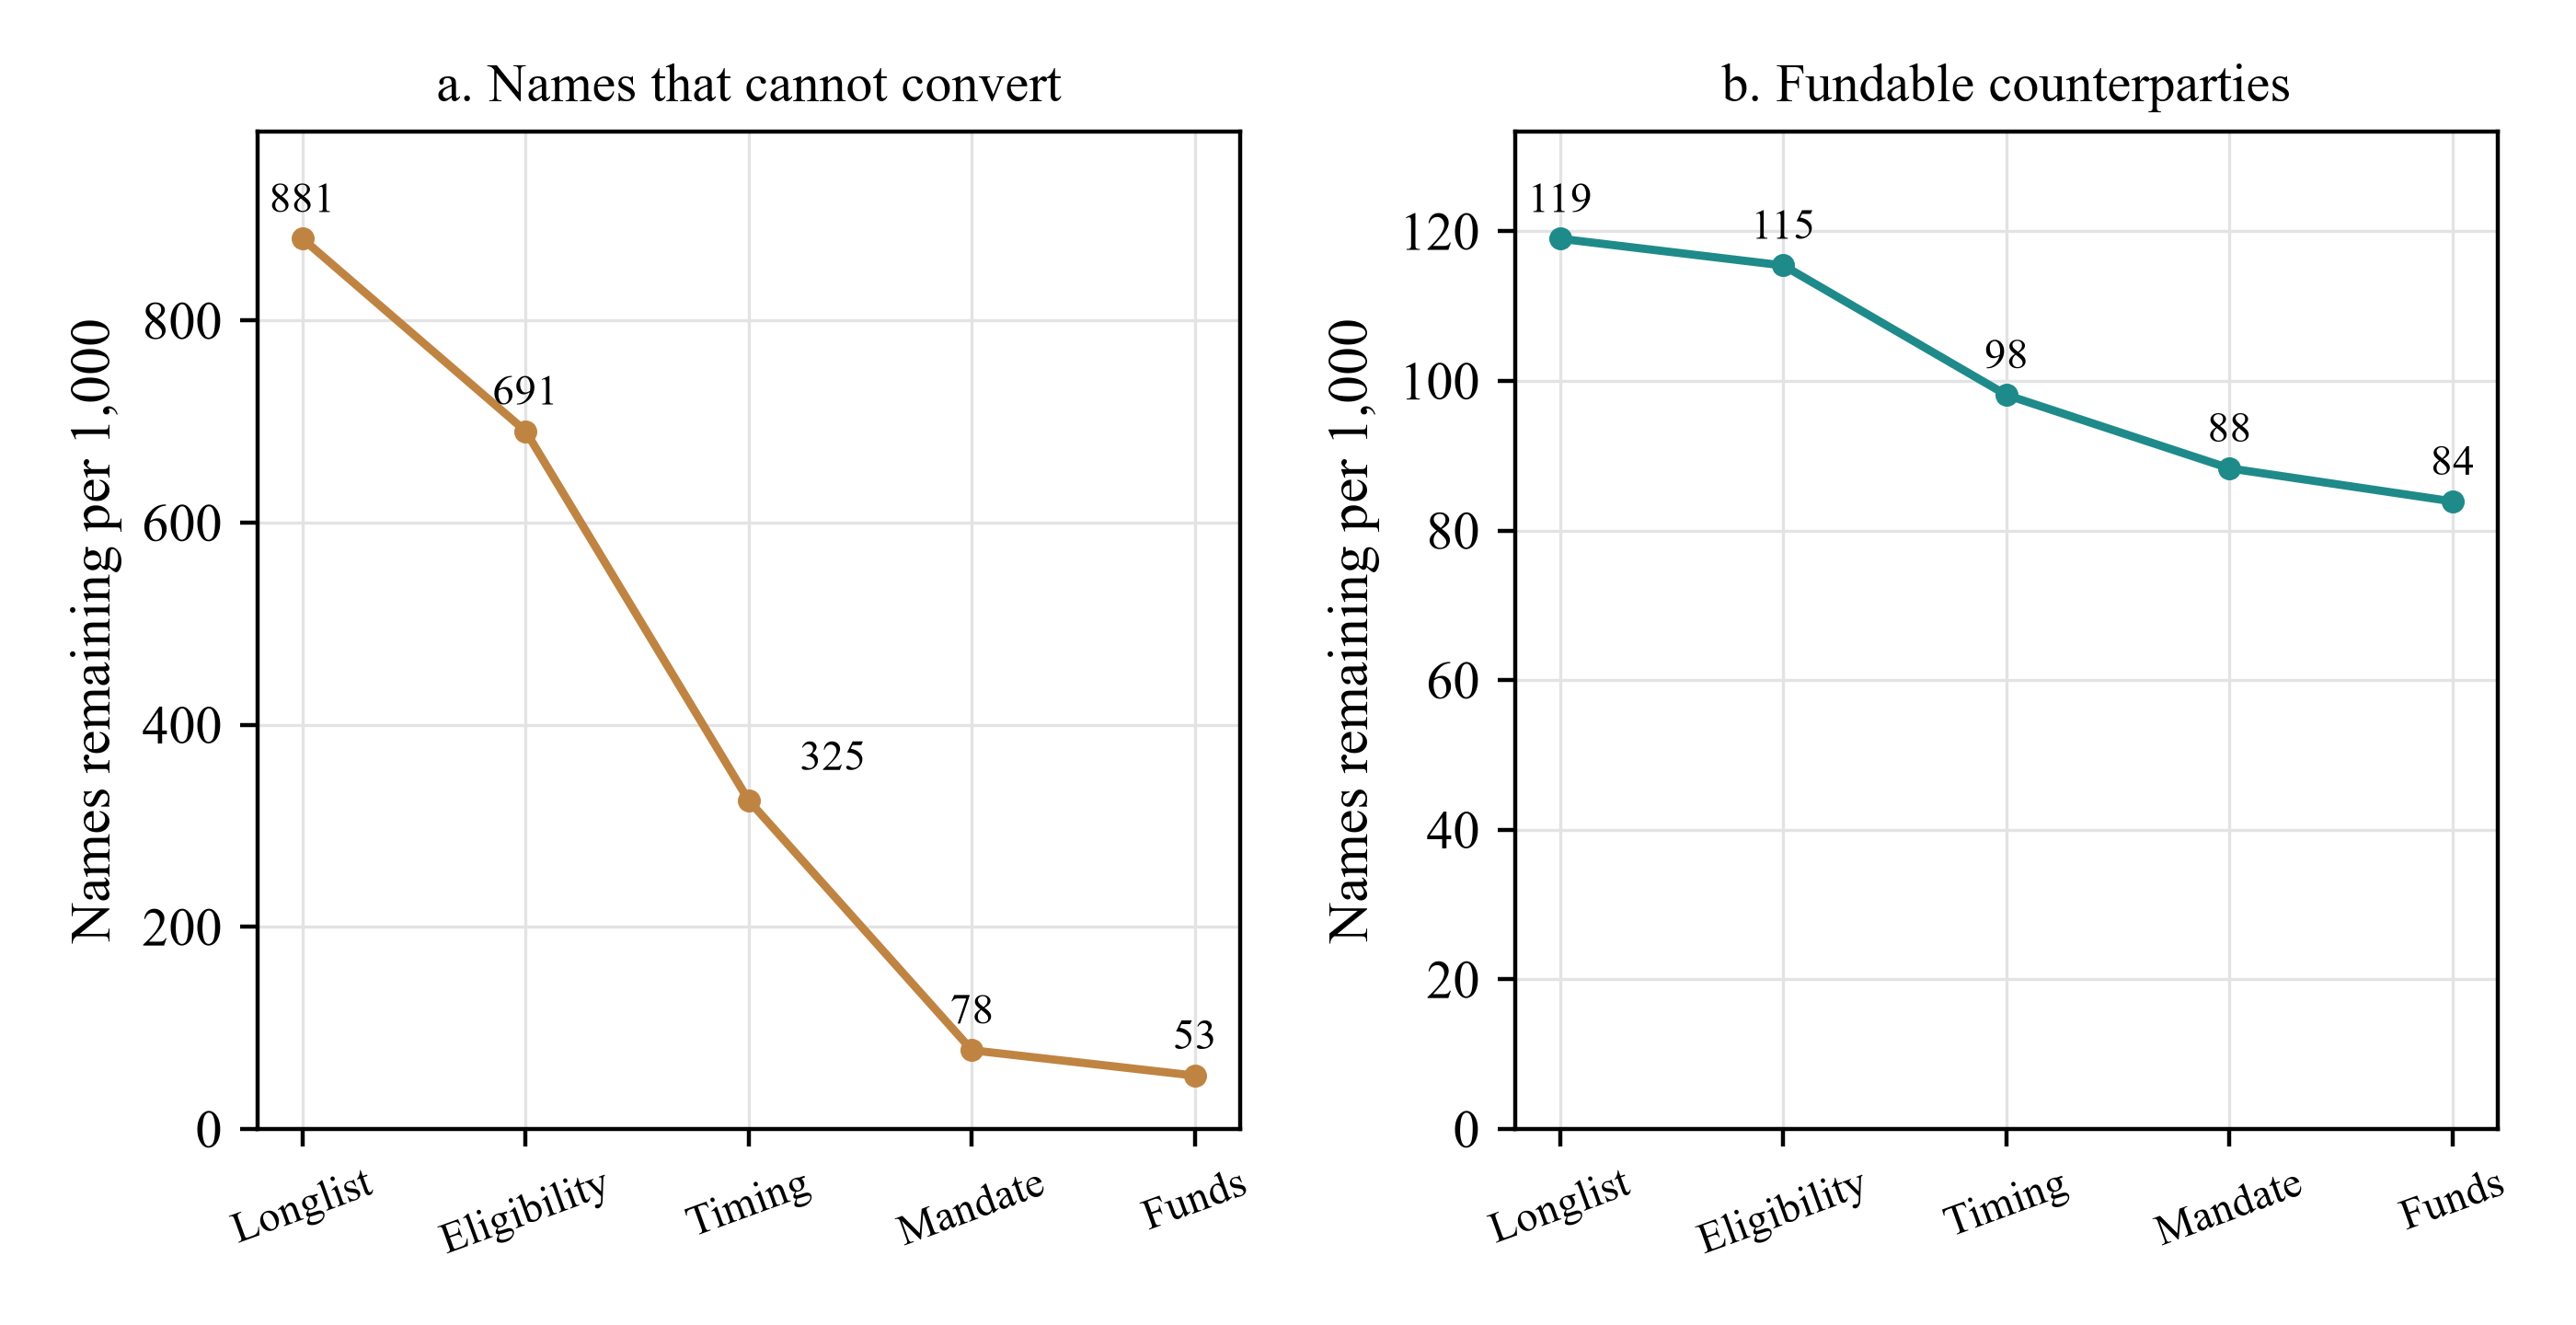
MatchPoint analysis of the constructed population. Model output under stated inputs; not an observed result. Expected names per 1,000 on the longlist.
13 Additional checks reduce expected commitments in the model and efficiency measures can select different policies
Figure 3 plots all 65 policies by the share of fundable names lost and the share of non-convertible meetings avoided. The policies form a cloud, not a curve, because some checks raise the loss without a matching gain in meetings avoided. The highest-net-value policy, Eligibility > Mandate, avoids 75.8% at a loss of 12.9%. Policies further up and to the right avoid more but lose a rising share of fundable names, reaching 93.8% avoided and 31.3% lost when all four checks run. The shape also shows diminishing returns: the first checks buy most of the avoided meetings at a modest loss, and the later checks buy little more at a rising loss.
Two objectives pick different policies. Minimising hours per commitment selects Eligibility > Timing > Mandate, at 55.7 hours per commitment against 73.1 for the policy that maximises net value. It does so by accepting 26.7% loss of fundable names and 26.2 expected commitments. Net value under that policy is 9,011, below 10,169. This efficiency measure can favour extra screening even as expected commitments fall. Adding a check can also raise hours per commitment. The two objectives agree only when a lost commitment is worth little, the region that the break-even analysis identifies at the low end of commitment values.
The implication is direct. The efficiency ratio can favour a policy with fewer commitments. The net-value objective accounts for the value assigned to commitments and the time spent reaching them. Where a commitment is valuable relative to a meeting, the measure to report is the number of commitments and the hours spent to reach them, with a stated value per commitment. Hours per commitment can still be reported, but as a secondary statistic beside the total, never as the objective that selects the policy. A reader shown both can see at once whether an apparent gain in efficiency came from fewer commitments. The next sections show how sensitive the choice of policy is to that value.
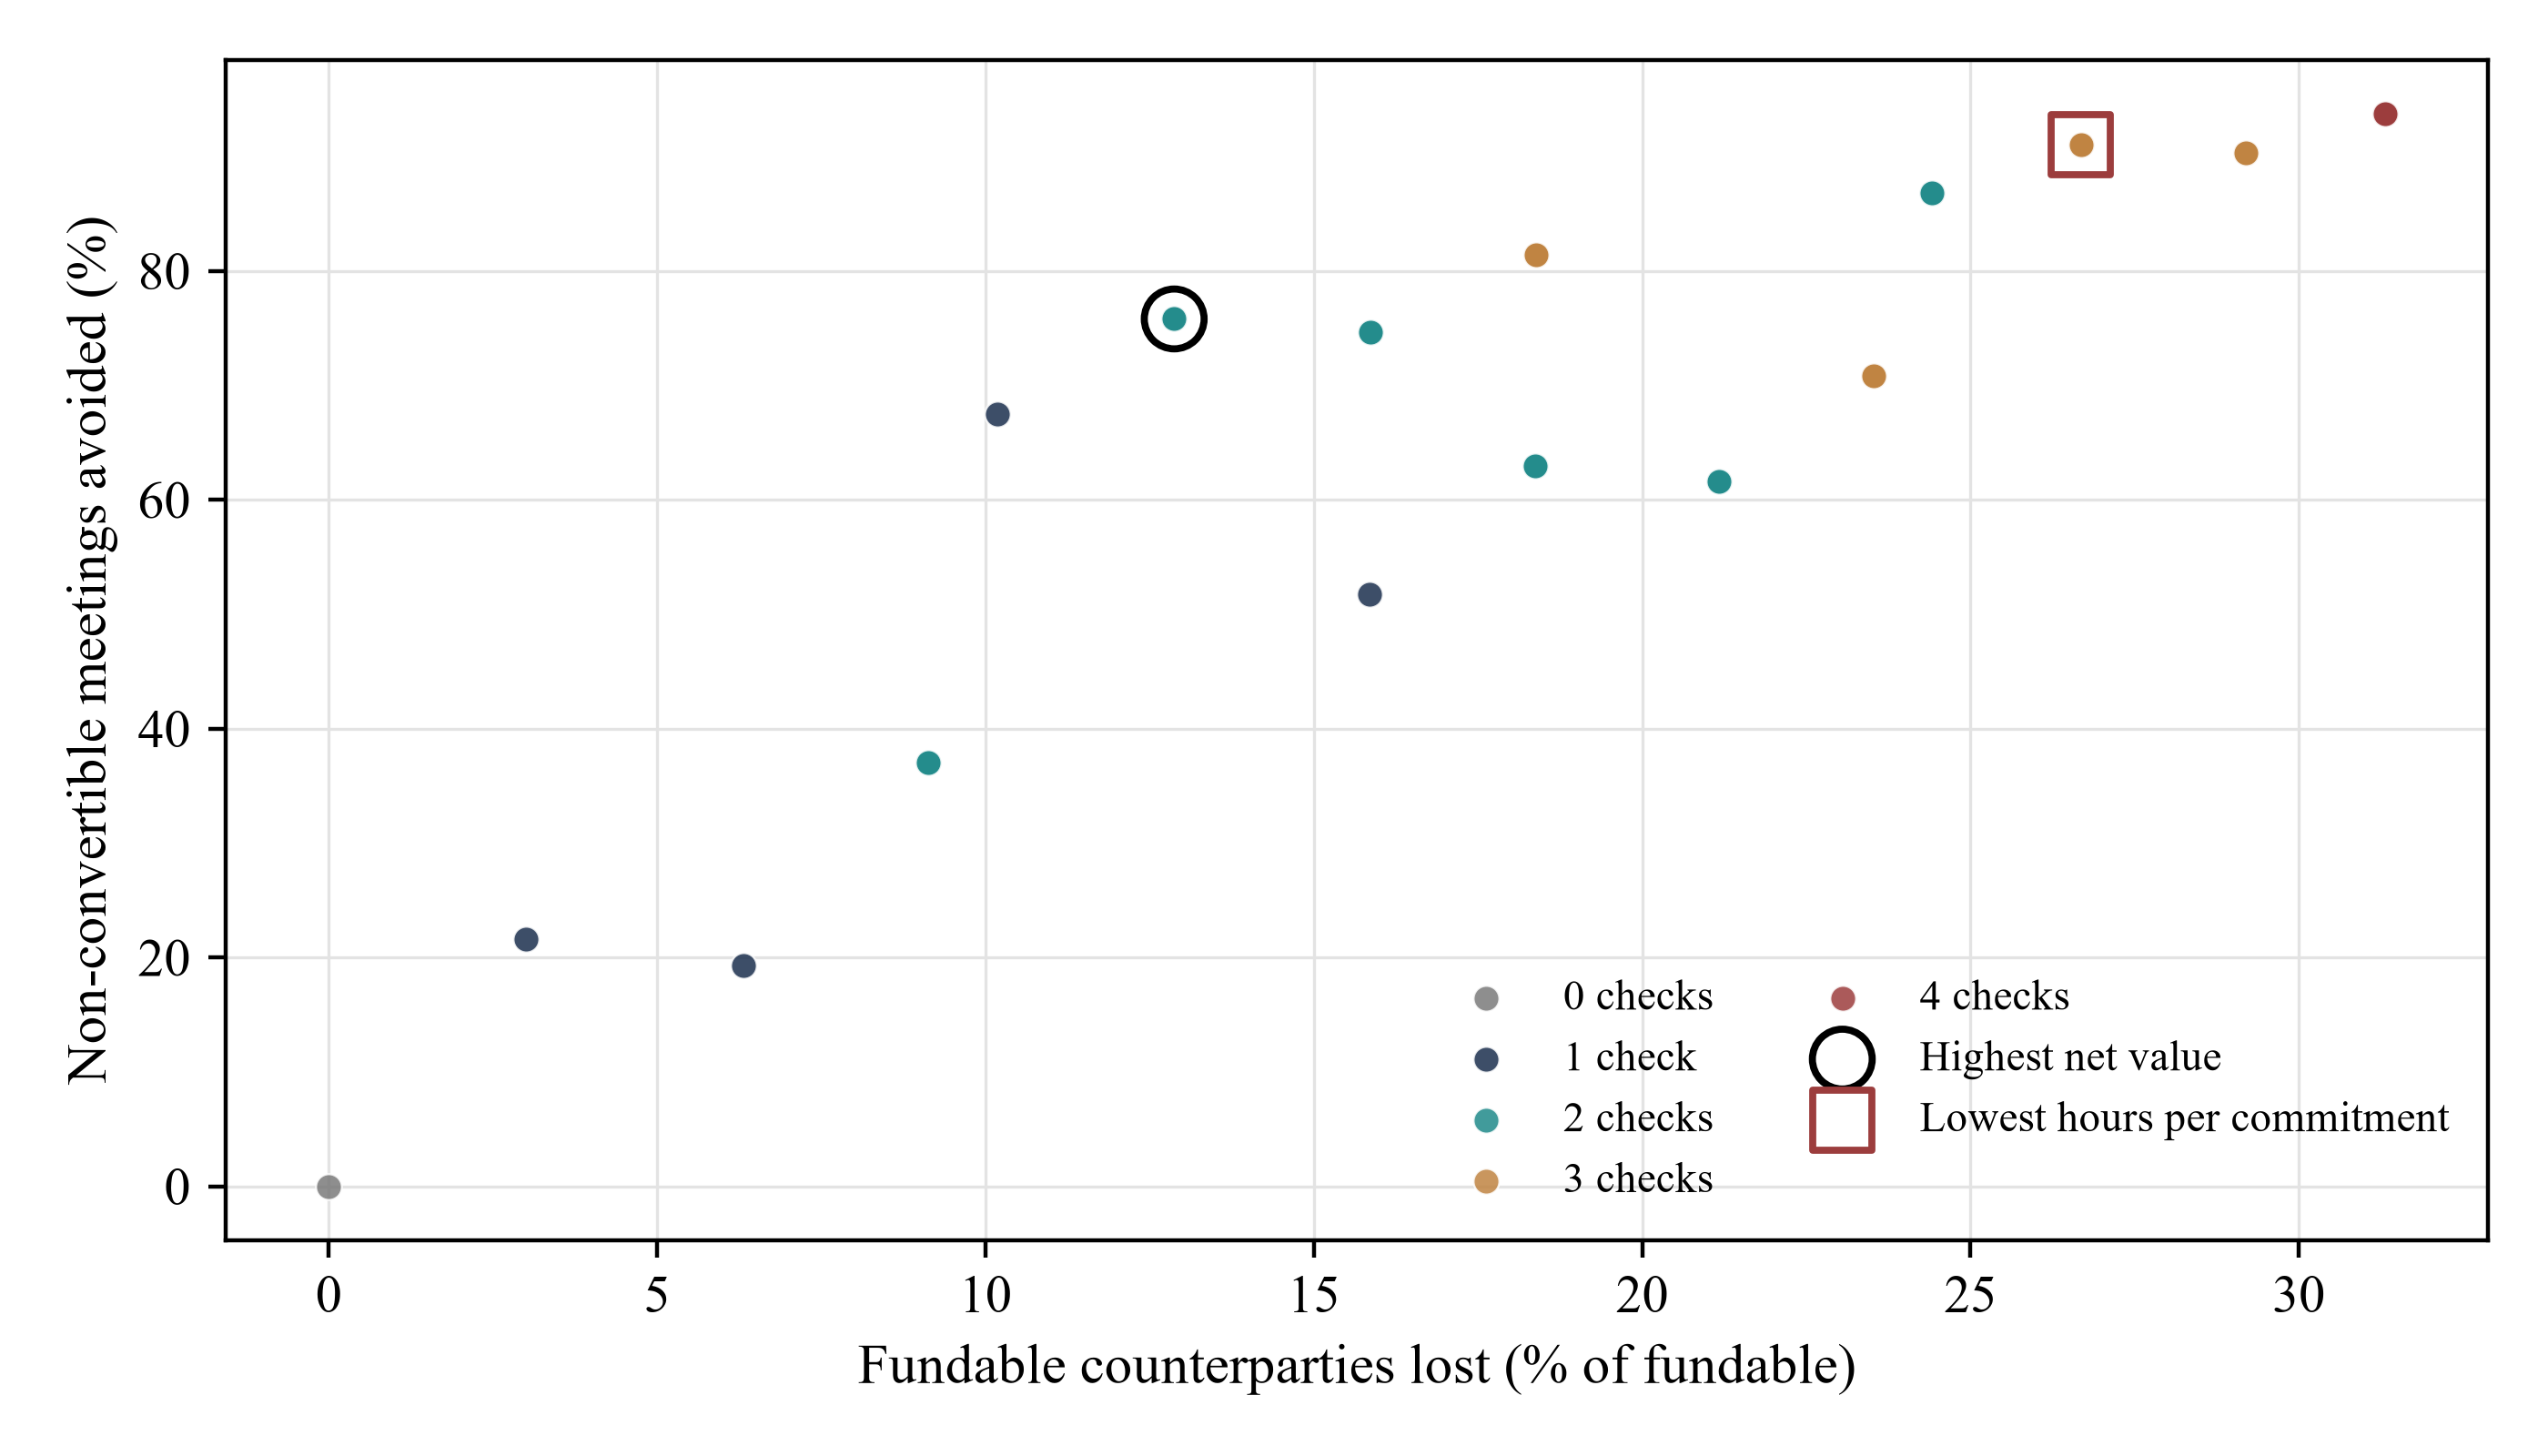
MatchPoint analysis of the constructed population. Model output under stated inputs; not an observed result. Each point is one set of checks; the orders of the same set coincide, because under independence order changes only screening hours.
14 Order changes cost by a small amount between sensible sequences and by a large amount when the expensive check comes first
For a fixed set of checks under independence, the ratio rule minimises screening hours. Equation 3 defines the pass probability of a check and the ordering rule, and the model confirms it against all 24 orders. The rule is an old result in the theory of sequential testing, and its value here is practical: it tells a team which check to run first without any further data than the cost, the share of names that pass and the error rates of each check.
In equation 3, gⱼ is the unconditional probability that a name passes check j, pⱼ is the share of names meeting its condition, sⱼ is its sensitivity and fⱼ its specificity. The subscript in brackets denotes position in the order: the check with the smallest ratio of cost to rejection probability goes first. The ratios are 0.258 for eligibility, 0.632 for timing, 0.659 for mandate and 8.451 for funds, so the rule gives Eligibility > Timing > Mandate > Funds, with screening hours of 711 per 1,000 names.
Table 7 shows that the conventional sequence of eligibility, mandate, timing and funds costs 717 hours, only 6 more, and ranks second of 24. Placing mandate first costs 764. Placing funds first costs 1,879, and the slowest order costs 1,934, 2.7 times the minimum. Under correlated conditions the rule keeps its place with a regret of 0.0%. Figure 4 shows all 24 orders. The practical result is that order matters little among sensible sequences and a great deal when the most expensive check is run on the full longlist.
Scroll across to see all columns.
| Order name | Sequence | Screening hours (independent) | Rank of 24 | Screening hours (correlated) |
|---|---|---|---|---|
| Ratio rule | E > T > M > K | 711 | 1 | 809 |
| Conventional | E > M > T > K | 717 | 2 | 813 |
| Mandate first | M > E > T > K | 764 | 4 | 860 |
| Funds first, then ratio rule | K > E > T > M | 1,879 | 19 | 1,910 |
| Slowest order | K > M > T > E | 1,934 | 24 | 1,945 |
MatchPoint analysis of the constructed population. Model output under stated inputs; not an observed result. Letters: E eligibility, M mandate, T timing, K funds. Correlated column uses a factor of 0.5 among conditions.
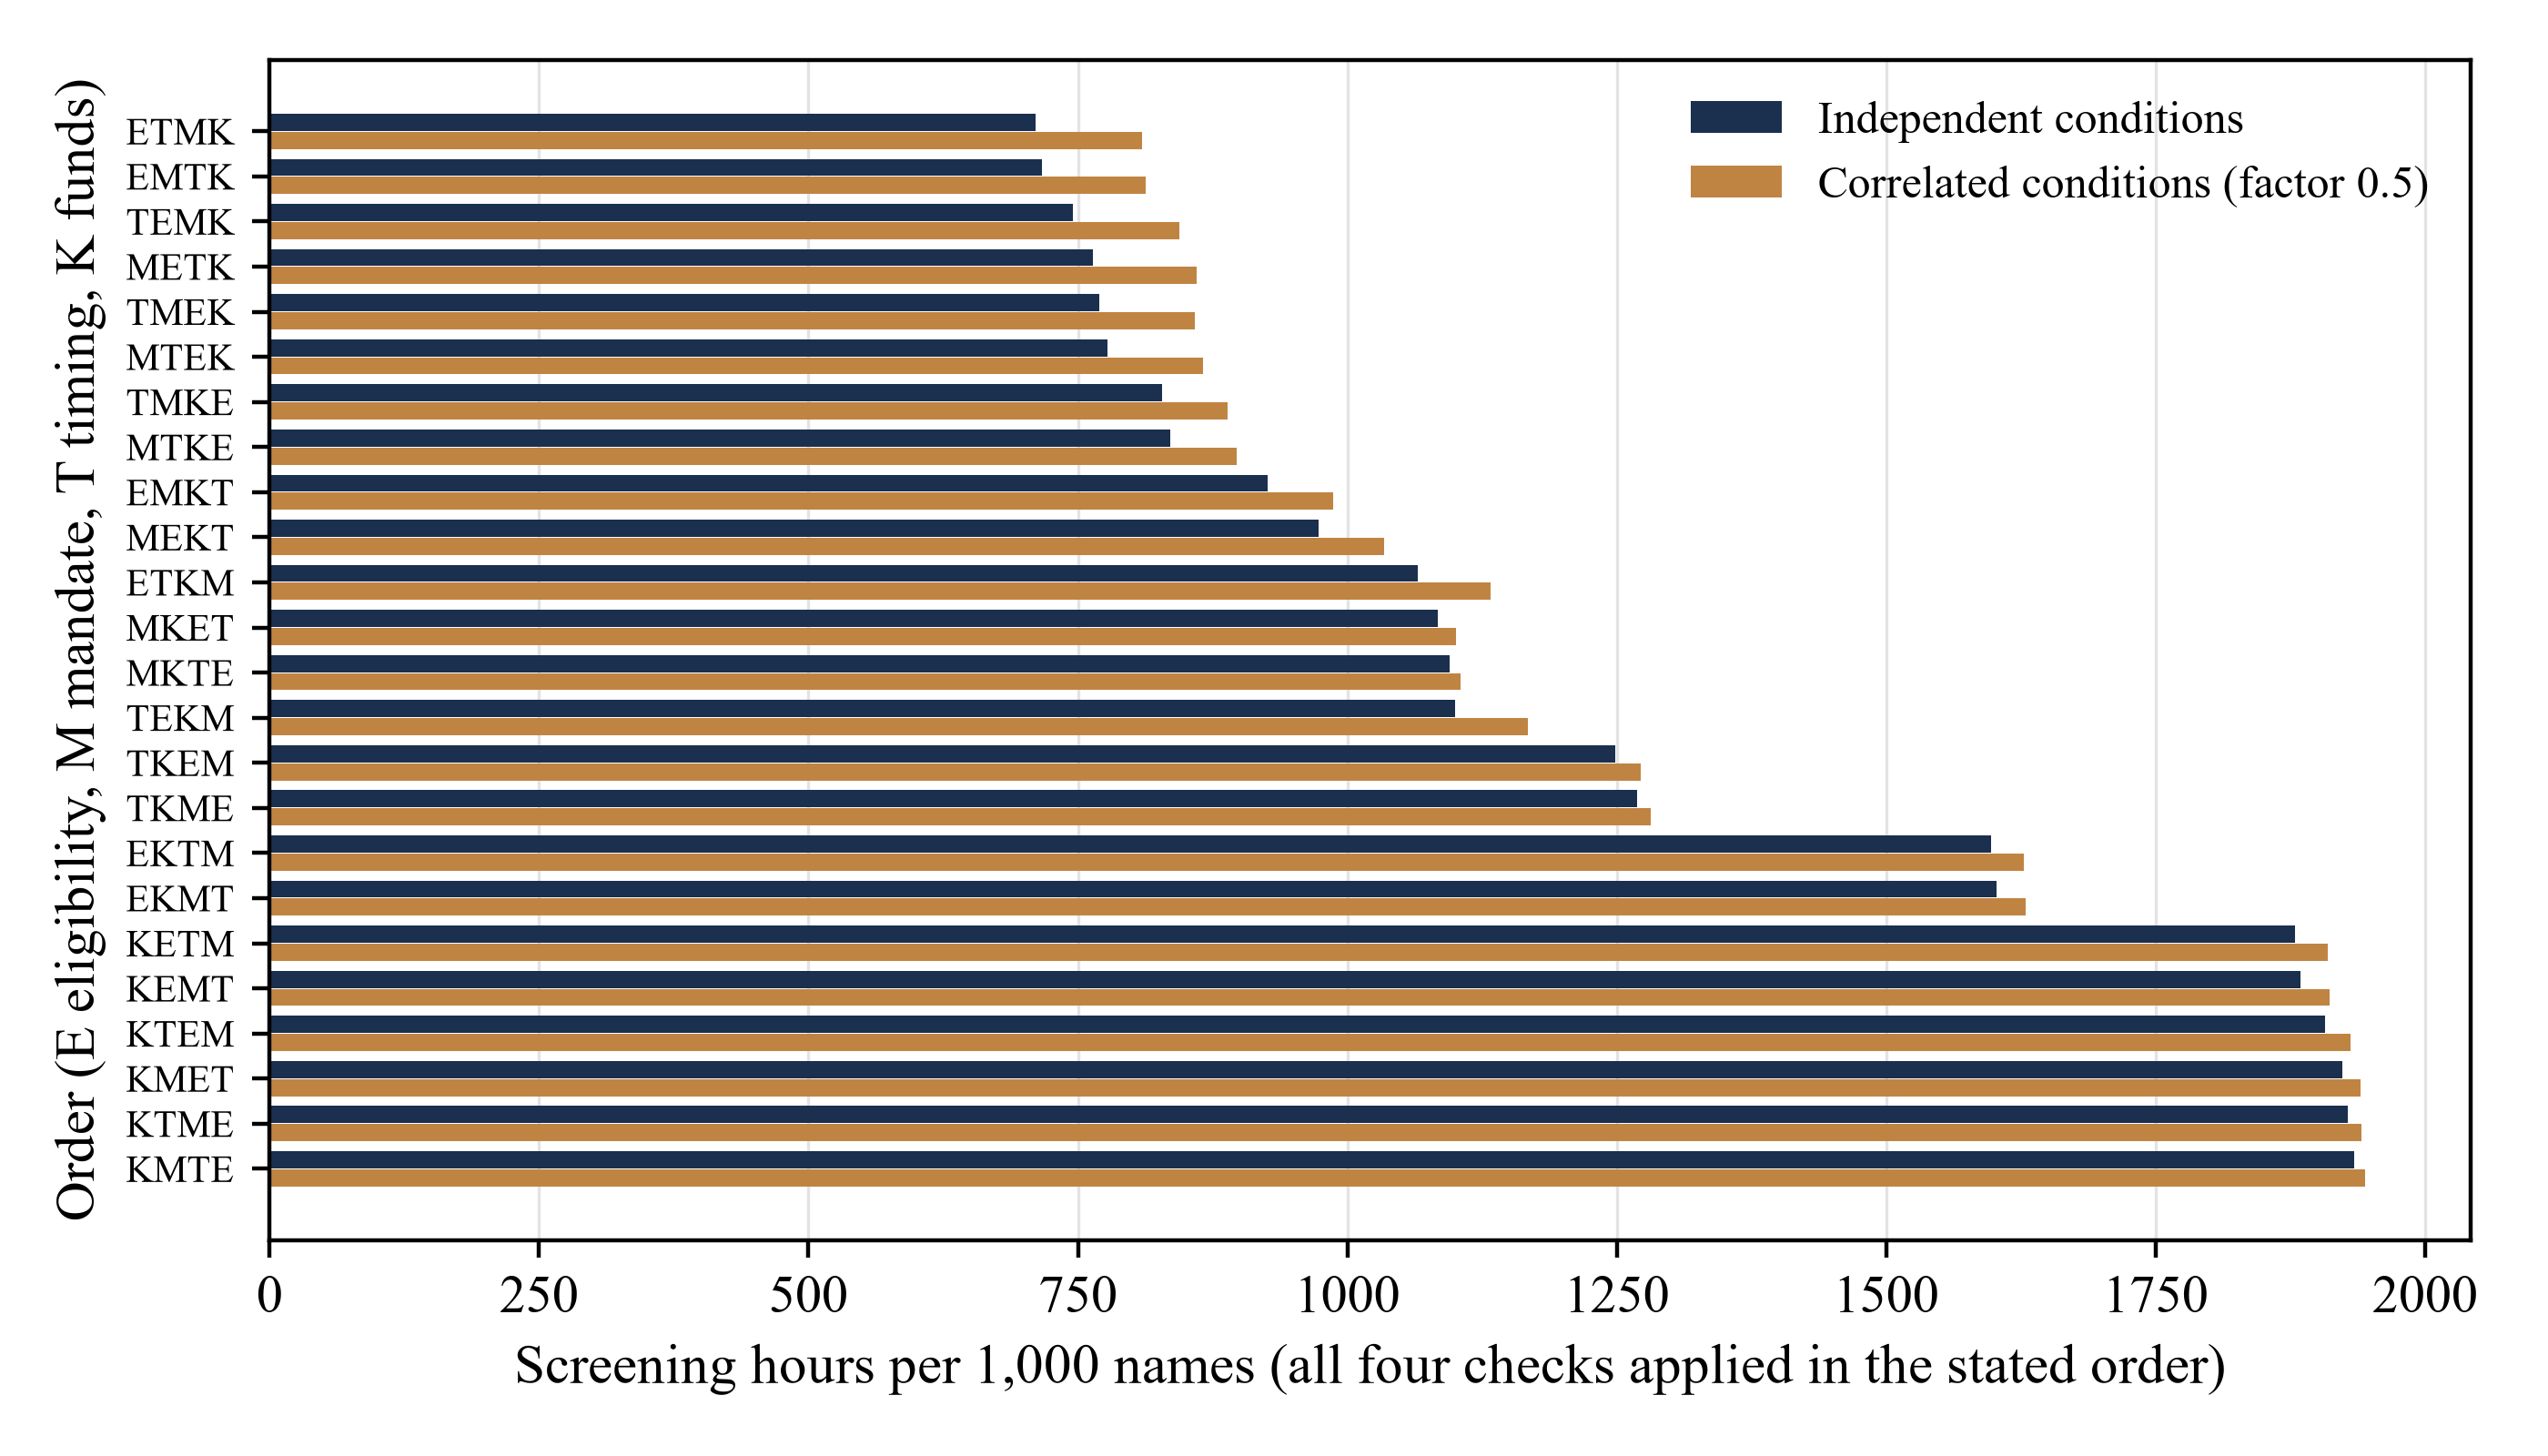
MatchPoint analysis of the constructed population. Model output under stated inputs; not an observed result. Sorted by hours under independent conditions.
15 Add a check only while the meetings it saves exceed its cost and the commitments it loses
Equation 4 compares the expected value of the meetings a check saves with the time it takes and the expected commitments it costs through rejection and delay. Time records can price the check and the meetings. The decision-maker must state how it values a commitment and test the decision across a plausible range. The ordinary campaign offers incomplete evidence on rejected names. An audit can estimate which rejected names were fundable; a separate lawful follow-up design is needed to estimate how often those names would have signed.
In equation 4, a is the share of names reaching the check, φₐ is the fundable share among them, and rⱼ is the probability that the check rejects a name that cannot convert. The delay on the check is dⱼ days, ρ is the share of fundable names whose windows remain open after the delays of the checks already in the policy, and the other symbols are as before. The left side of 4b is the value of meetings saved on non-convertible names. The right side is the check's cost plus the net cost of rejecting fundable names, which is the value of a lost commitment less the meeting saved.
For the best policy, appending timing changes net value by −1,164 hours and appending funds by −924 hours, and the model confirms both against direct evaluation. Table 8 and Figure 5 vary the value of a commitment. At low values the three-check policy is best and loses 26.7% of the fundable names. Above 165 hours the best policy is Eligibility > Mandate; above 504 it is Mandate; above 830 it is Eligibility; and above 1,040 hours no screening is best. The crossing is 173 times the modelled cost of one meeting. It compares the simulated alternatives at the stated inputs; required checks are outside that choice.
Scroll across to see all columns.
| Commitment value (hours) | Highest net value policy | Fundables lost | Non-convertible meetings avoided | Commit-ments | Net value |
|---|---|---|---|---|---|
| 25 | Eligibility > Timing > Mandate | 26.7% | 91.0% | 26.2 | -804 |
| 50 | Eligibility > Timing > Mandate | 26.7% | 91.0% | 26.2 | -150 |
| 100 | Eligibility > Timing > Mandate | 26.7% | 91.0% | 26.2 | 1,159 |
| 200 | Eligibility > Mandate | 12.9% | 75.8% | 31.1 | 3,948 |
| 400 | Eligibility > Mandate | 12.9% | 75.8% | 31.1 | 10,169 |
| 800 | Mandate | 10.2% | 67.5% | 32.1 | 22,895 |
| 1,600 | No screening | 0.0% | 0.0% | 35.7 | 51,120 |
| 3,200 | No screening | 0.0% | 0.0% | 35.7 | 108,240 |
MatchPoint analysis of the constructed population. Model output under stated inputs; not an observed result. Value in analyst hours; all other inputs at base values.
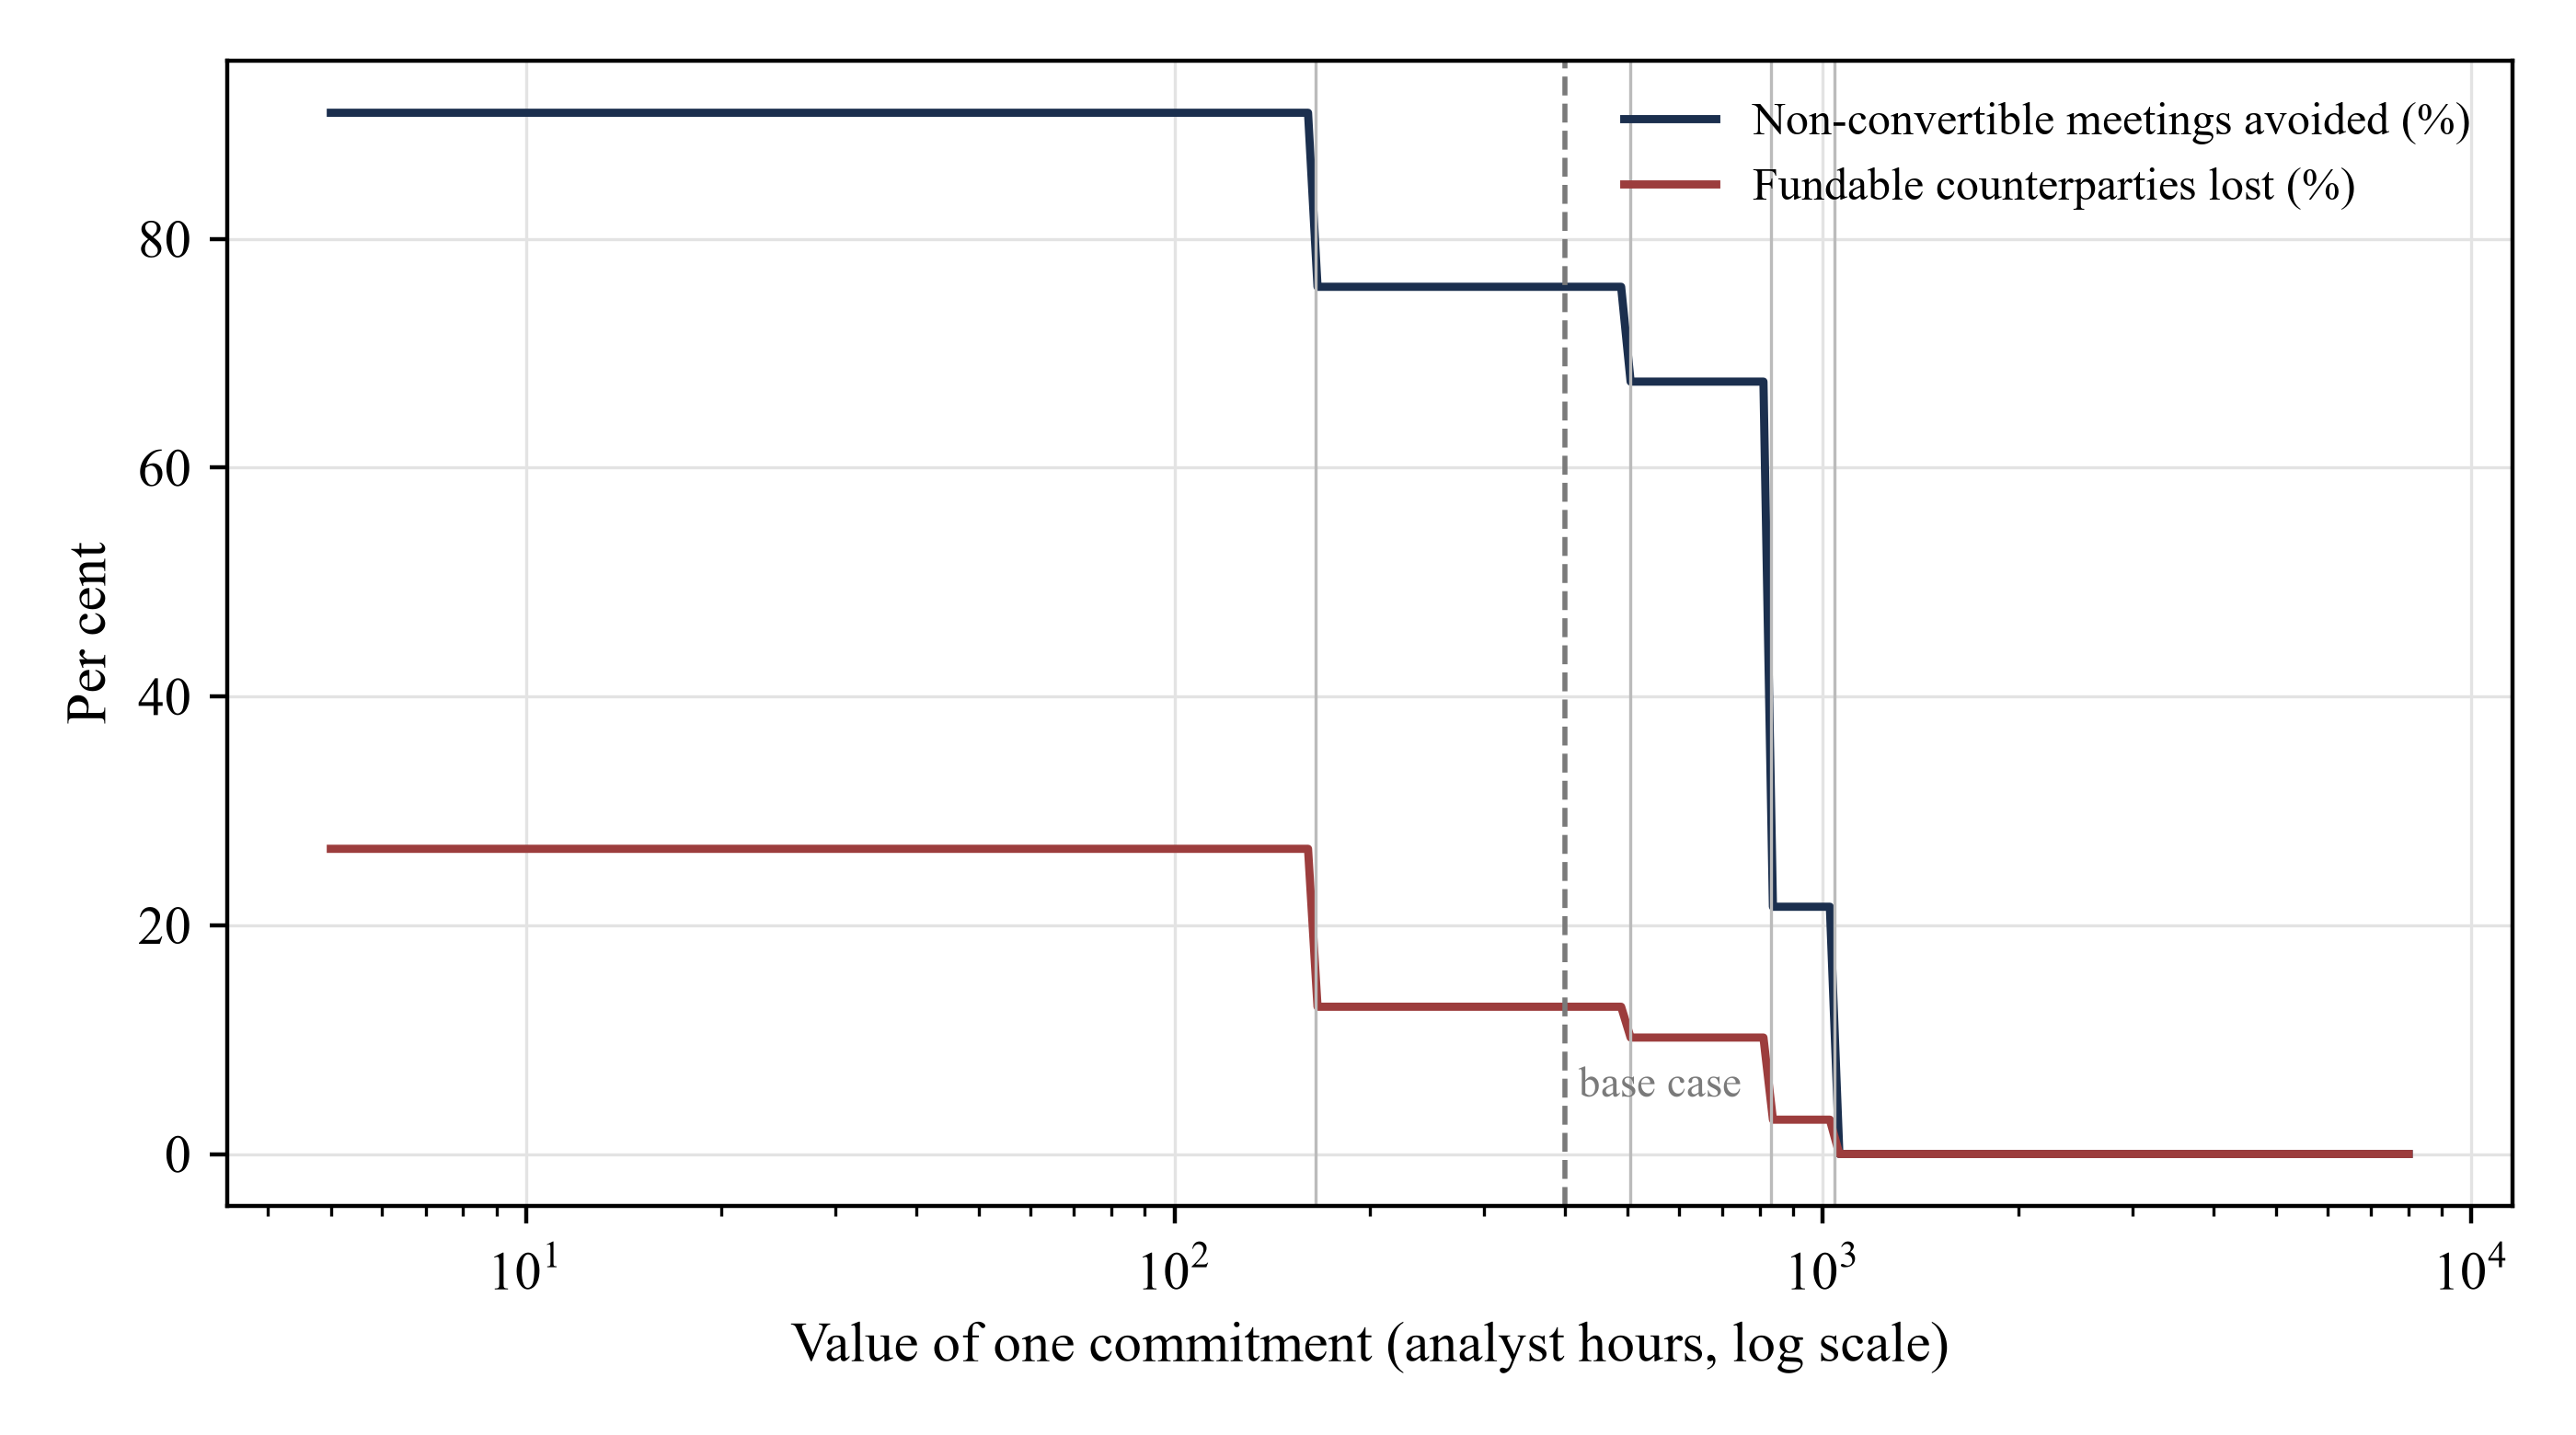
MatchPoint analysis of the constructed population. Model output under stated inputs; not an observed result. Vertical lines mark changes of the best policy.
16 Each stress case leaves a different signature in the numbers a raiser can observe
Table 9 freezes the base policy, Eligibility > Mandate, and changes one input at a time, then reports the policy that would be best under the changed input. The first stress sets a one-factor correlation of 0.5 among the conditions. It raises the fundable share to 23.7%, about 2.0 times the base share, and the frozen policy has a regret of 2.0% with Mandate best. The signature is a higher commitments-per-meeting rate and a higher pass rate for later checks conditional on earlier passes. The cost order is unchanged.
Stale mandate records, with sensitivity 0.70 and specificity 0.80 for the mandate check, are the dangerous case. The pass rate moves only from 31.7% to 30.2%, a change a manager would not notice, yet lost fundable names rise from 12.9% to 32.2% and the frozen policy has a regret of 16.4%. A colder market, with mandate fit and live timing both at 0.25, cuts the frozen policy's net value to 2,548, while no screening has a net value of −900, and the best policy adds timing. Faster closing windows leave the two-check policy almost unchanged, at regret 0.0%, but raise the loss under the full chain to 38.1%.
Unverified self-certification, with eligibility specificity at 0.55, raises the pass rate to 34.0% and lowers commitments per meeting from 9.8% to 9.1%, while commitments stay at 31.1. That is the opposite signature: the pass rate rises, conversion per meeting falls and no commitment is lost. The two signatures can be told apart. A fall in sensitivity shows as a small fall in pass rate with silent commitment loss. A fall in specificity shows as a rise in pass rate and a fall in conversion per meeting.
Scroll across to see all columns.
| Stress case | Pass rate | Commit-ments per meeting | Commit-ments | Frozen net value | Re-optimised policy | Re-optimised net value | Regret |
|---|---|---|---|---|---|---|---|
| Base case | 31.7% | 9.8% | 31.1 | 10,169 | Eligibility > Mandate | 10,169 | 0.0% |
| Correlated conditions (factor 0.5) | 34.7% | 17.8% | 61.9 | 22,321 | Mandate | 22,785 | 2.0% |
| Stale mandate records (sensitivity 0.70, specificity 0.80) | 30.2% | 8.0% | 24.2 | 7,491 | Eligibility | 8,966 | 16.4% |
| Colder market (mandate fit 0.25, live timing 0.25) | 25.4% | 4.4% | 11.1 | 2,548 | Eligibility > Timing > Mandate | 2,778 | 8.3% |
| Faster closing windows (daily hazard 0.010) | 31.7% | 9.7% | 30.9 | 10,069 | Eligibility > Mandate | 10,069 | 0.0% |
| Unverified self-certification (eligibility specificity 0.55) | 34.0% | 9.1% | 31.1 | 10,003 | Mandate | 10,068 | 0.6% |
MatchPoint analysis of the constructed population. Model output under stated inputs; not an observed result. Frozen policy is Eligibility > Mandate. Net values in analyst hours per 1,000 names; regret is the shortfall against the re-optimised policy.
17 Comparing screened with unscreened names misstates the effect when the raiser chose which names to screen
A raiser that screens only the names it doubts will find that screened names commit less often, and may conclude that screening destroys commitments. The comparison confounds screening with the doubt that prompted it. The model builds this case with a recorded tier, strong or weak, and an unrecorded signal, good or bad, both of which shift the fundable share and the probability of being screened. The true effect of the best policy is −4.60 commitments per 1,000 names. The bias arises without any bad faith: ordinary judgement about which names deserve a closer look is enough to produce it.
In equation 5, Y is commitments per name, A equals one if the name was screened, x is the recorded tier and wₓ is its population share. The second estimator is a stratified form of inverse probability weighting, which creates a pseudo-population in which assignment does not depend on the recorded trait. A review of weighting methods for missing data notes that a misspecified parametric model for the selection may give significantly biased results. [14] Weighting repairs bias only for traits that were recorded.
Table 10 gives the result. When the raiser screens the names it doubts, the naive estimate is −29.51 against a true −4.60, 6.4 times too large, and adjusting for the recorded tier gives −20.13, still 4.4 times too large. When it screens the names it favours, the naive estimate is 20.51, the wrong sign, and the adjusted estimate is 10.98, still the wrong sign. Random assignment recovers −4.60. The correction fails because the unrecorded signal drives both choices. No amount of weighting on recorded data removes it.
Scroll across to see all columns.
| Assignment rule | Share screened | True effect | Naive comparison | Adjusted for recorded tier |
|---|---|---|---|---|
| Screens the names it doubts | 52% | -4.60 | -29.51 | -20.13 |
| Screens the names it favours | 43% | -4.60 | 20.51 | 10.98 |
| Random assignment | 50% | -4.60 | -4.60 | -4.60 |
MatchPoint analysis of the constructed population. Model output under stated inputs; not an observed result. Effect of the Eligibility > Mandate policy; exact expectations, not simulated.
18 Sampling variability can mask the loss of commitments
The exact loss of commitments from the best policy is 4.60 per 1,000 names, from 35.7 to 31.1. A real campaign draws a random number of commitments. Table 11 simulates 4,000 replications of a two-arm comparison with the best policy against no screening, for cohorts of 250 to 10,000 names per arm, using seed 20261014. At 1,000 names per arm the 5th to 95th percentile of the observed difference runs from −18.0 to 9.0 commitments per 1,000, and in 32% of replications the screened arm shows equal or more commitments than the unscreened arm.
The hours saved are measured with far less noise. At 1,000 names per arm they lie between 3,575 and 3,874 hours per 1,000 names, a range of about 8% of the mean. The consequence is an asymmetry in what a campaign can show. The saving is visible in a single campaign, and the loss is not visible even in a large one. A team that reports results from one cohort will therefore credit screening with savings and attribute its lost commitments to chance. Figure 6 shows the spread by cohort size.
At 80% power and a 5% two-sided level, the illustrative trial requires approximately 23,988 names per arm and 198,450 analyst hours. Even at 10,000 names per arm, the screened arm records as many or more commitments in 4% of simulated replications. The sample-size calculation depends on the underlying rates and the size of the difference.
Scroll across to see all columns.
| Names per arm | Mean difference | 5th to 95th percentile | Share with equal or higher commitments in screened arm | Hours saved (5th to 95th) |
|---|---|---|---|---|
| 250 | -5.0 | -32.0 to 20.0 | 42% | 3,428 to 4,017 |
| 500 | -4.6 | -24.0 to 14.0 | 39% | 3,513 to 3,938 |
| 1,000 | -4.4 | -18.0 to 9.0 | 32% | 3,575 to 3,874 |
| 2,000 | -4.5 | -13.5 to 5.0 | 22% | 3,623 to 3,831 |
| 5,000 | -4.6 | -10.2 to 1.2 | 11% | 3,663 to 3,791 |
| 10,000 | -4.6 | -8.8 to -0.4 | 4% | 3,682 to 3,775 |
MatchPoint analysis of the constructed population. Model output under stated inputs; not an observed result. 4,000 replications per row; mean difference in commitments per 1,000 names (screened minus unscreened); hours saved per 1,000 names.
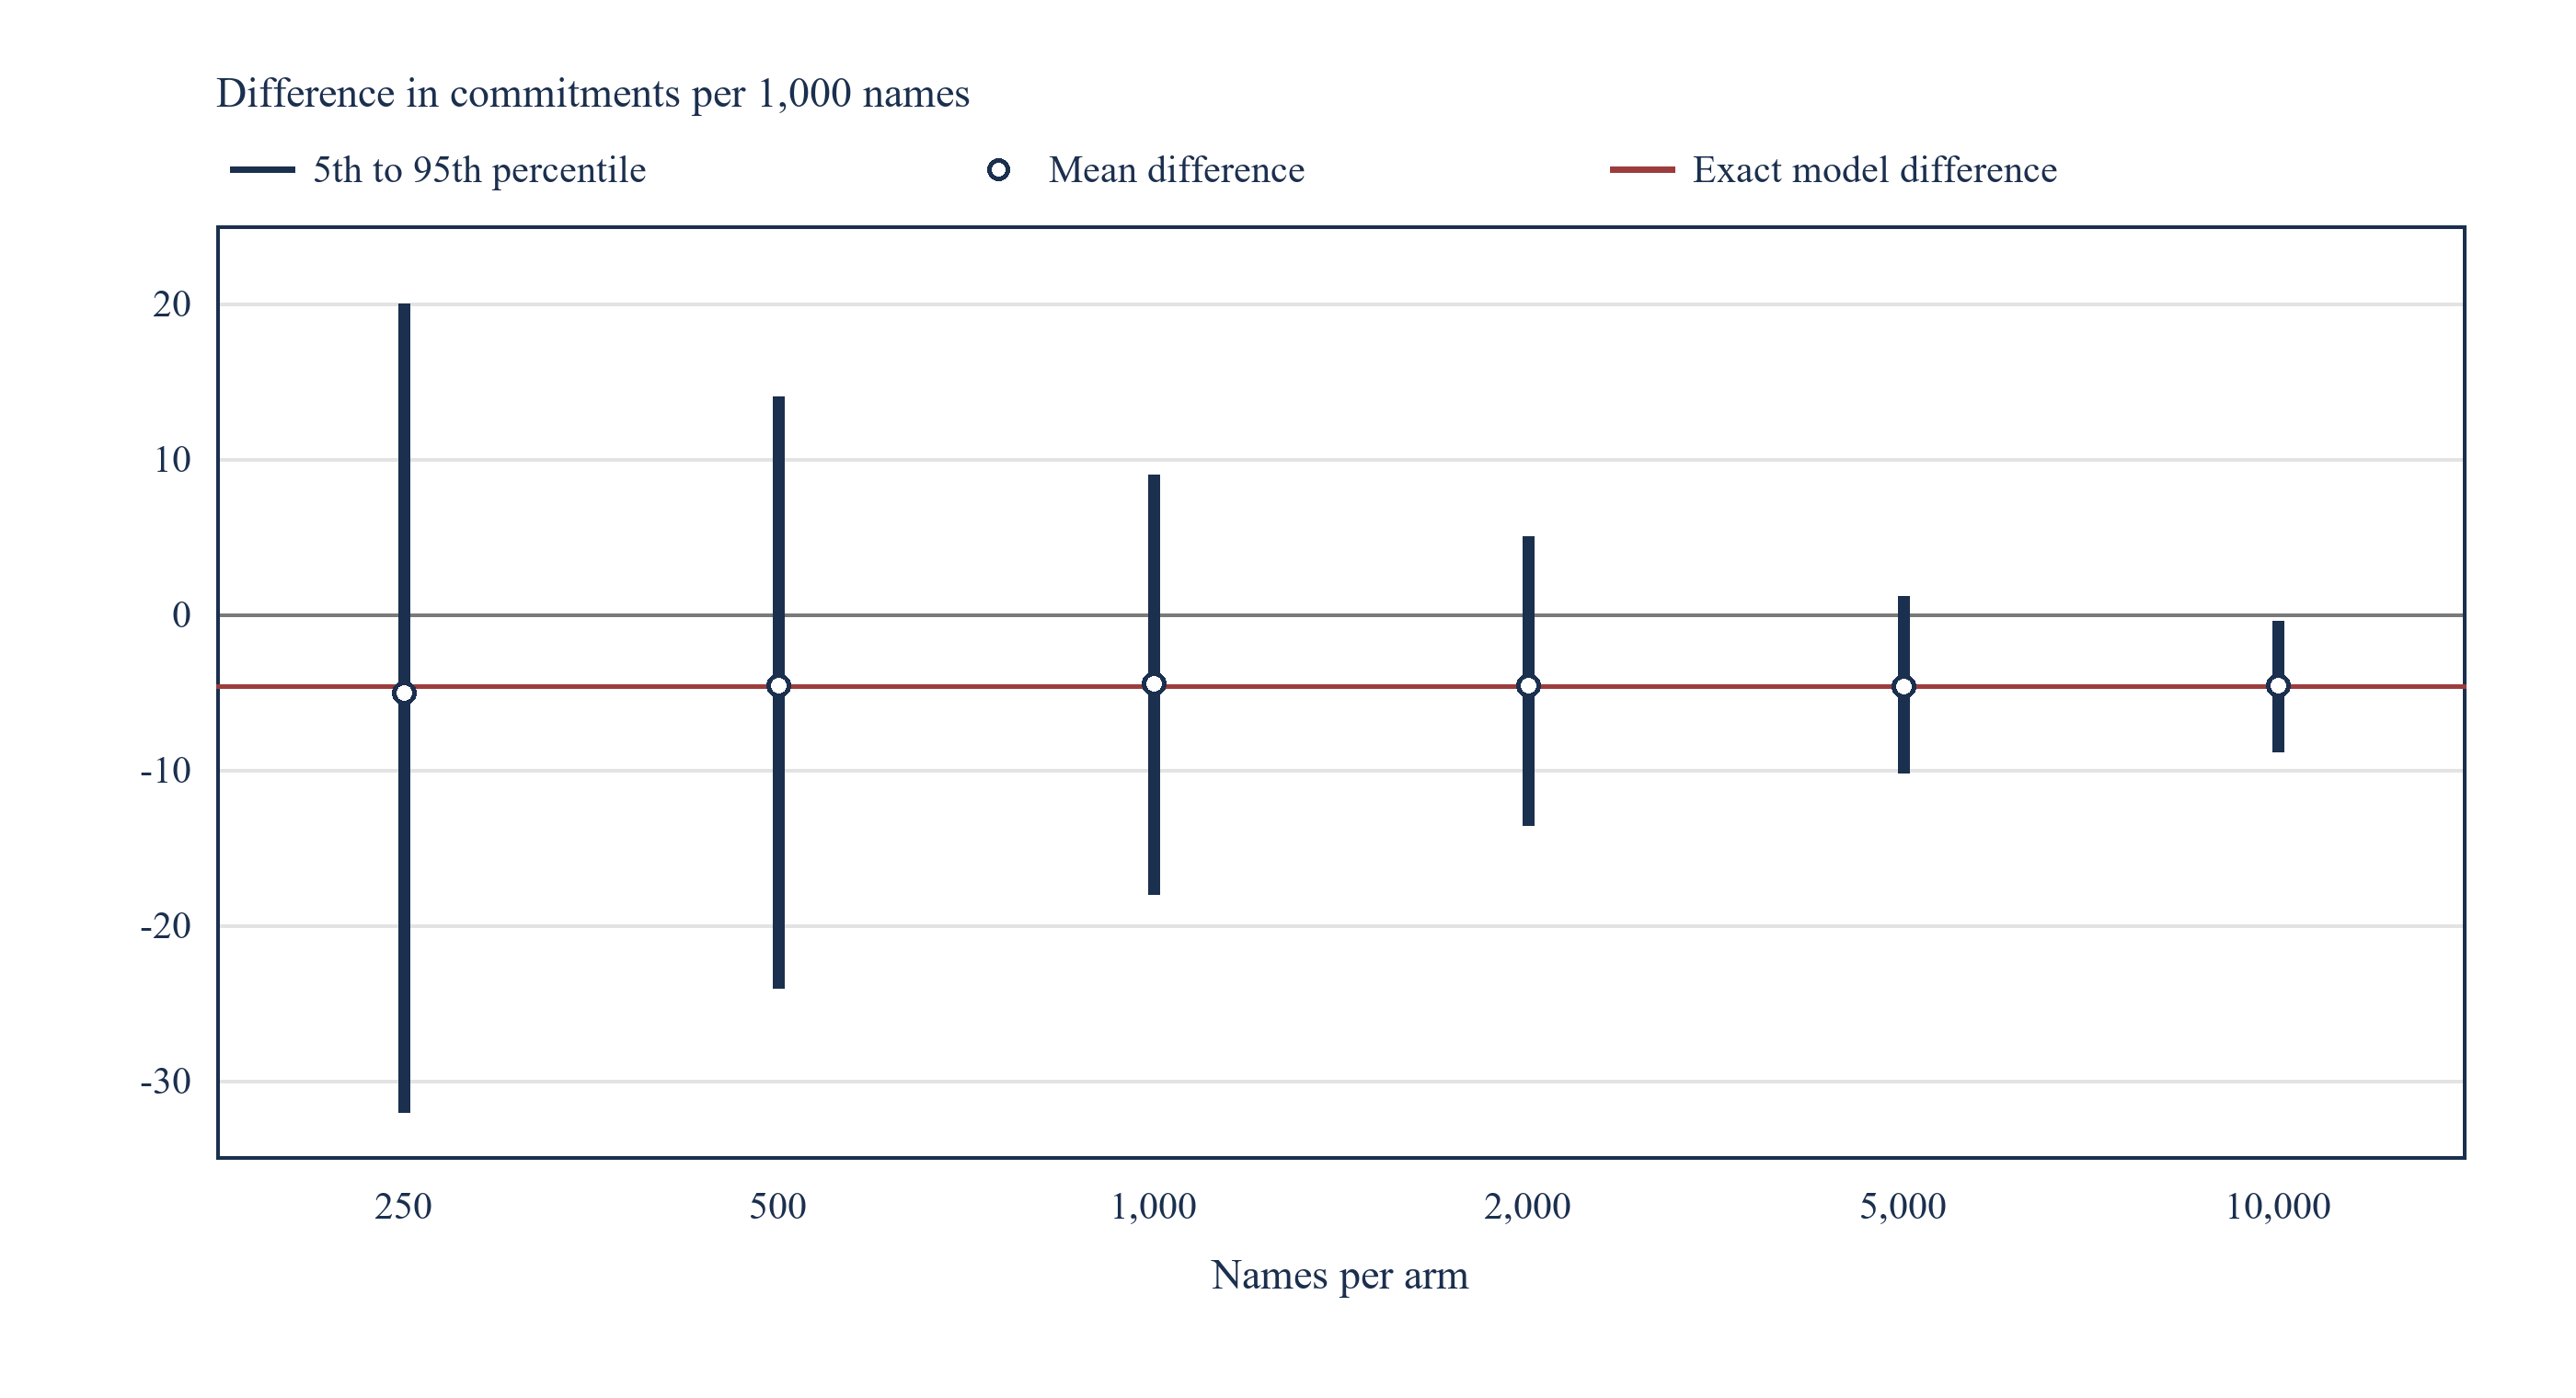
MatchPoint analysis of the constructed population. Model output under stated inputs; not an observed result. Bars show the 5th to 95th percentile of 4,000 replications; the line is the exact difference. Differences are screened minus unscreened commitments per 1,000 names.
19 Timestamped records and two separate study samples
The constructed experiment cannot say what a real screen loses. A consented study can estimate it if it records a few things at the right time. The unit is the name-campaign pair, because the same investor may be fundable for one raise and not another. Each pair carries the longlist entry date, the date and result of each check, the meeting request and date, and every later stage to signature or withdrawal. Timestamps are needed because eligibility, timing and funds are conditions at a date. Table 12 sets out the design.
Obtain jurisdiction-specific legal review before collecting records or contacting anyone. Identify the applicable notice, lawful basis, marketing rule and retention period, including any consent requirement, for each proposed activity. [7, 8, 9] Distinguish corporate and individual subscribers where relevant. Restrict access to individual identifiers and record the minimum suppression information needed to honour objections where lawful. Keep contact permissions and eligibility to receive an offer as separate fields from commercial fit.
Use two separate sampling procedures. For diagnostic accuracy, draw random samples of both passes and failures within each check's arriving population and verify their status using the same deeper reference procedure, blinded to the screen decision where feasible. For commercial outcomes, randomise a permitted follow-up only among people who failed a discretionary commercial check and are independently cleared for the proposed contact. Keep offer eligibility, marketing permissions, and required compliance checks in force in both arms. Pre-register assignment, the observation window and a spending limit. Analyse by assignment, and report unresolved or unobserved outcomes separately.
Outcome definitions must be fixed before the first record. A qualified meeting is one held with a counterparty that the audit later classifies as fundable. Diligence progression is the receipt of a request for documents or access to a data room from the counterparty. A signed commitment is a written, binding subscription or term acceptance, counted at its date. Withdrawals, rejections and silence are recorded with reasons. These three outcomes, taken in sequence, let a study show where in the funnel a screen moves names, and the signed commitment remains the one on which the decision rests.
Scroll across to see all columns.
| Element | Specification |
|---|---|
| Unit | Name-campaign pair, with entity and individual contact identifiers kept separate |
| Consent and notice | Record lawful basis, notice and applicable contact permission; keep suppression data only as needed and lawful |
| Timestamps | Entry, each check result, request, meeting, diligence, term discussion, signature or withdrawal |
| Outcomes | Primary: signed commitment within a stated window. Secondary: qualified meeting, diligence progression, hours |
| Sampling and assignment | Audit both passes and failures; randomise permitted follow-up only within the independently cleared commercial-failure group |
| Sample size | Set from the audit and hold-out calculations in the next section, not from the campaign size |
| Analysis plan | Sampling weights for diagnostic rates; intention-to-treat for assigned follow-up; state the outcome window |
| Governance | Pre-registered outcome definitions; legal review per jurisdiction; independent holder of the randomisation log |
MatchPoint framework. Proposed design; no study has been run and no data are held.
20 Sampling design for screening accuracy and lost commitments
Separate the probability of fundability among failures from the probability of a signed commitment if a permitted meeting were offered. In the best modelled policy, 68.3% of names fail a check and 2.2% of those are fundable. The assumed common conversion rate produces a modelled commitment rate of 0.66% among failed names. Table 13 compares three illustrative evidence budgets. A two-arm comparison needs about 23,988 names per arm and 198,450 hours under the model inputs.
For the eligible population offered a permitted hold-out meeting, the signed-commitment rate can be estimated by following all assigned names through a fixed outcome window, including those who decline. The illustrative precision calculation assumes 1,013 completed observations and prices them at 6,077 hours. The deeper-record audit illustration uses 831 audits and 1,246 hours to estimate fundability among failures; it does not price the additional pass audit needed for sensitivity. These planning figures depend on sample composition, the assumed outcome rate, and the cost of completing follow-up. For a rare outcome, recalculate precision using an interval suited to sparse events and the expected rate in the independently cleared group.
To estimate sensitivity at a given check, weight the reference-confirmed fundable counts in the pass and fail samples back to their full strata using their sampling probabilities. Divide the weighted fundable pass count by the sum of the weighted fundable pass and fail counts. A failure-only audit estimates the fundable share of failures; it lacks the pass count required for this denominator. Report reference disagreements, unresolved cases and sampling uncertainty. Apply the same method within the arriving population at each stage; that population has already passed the preceding checks. Use the follow-up experiment for commitment outcomes in its cleared population. Extending its conversion rate to other rejected names requires a stated assumption and sensitivity analysis.
Scroll across to see all columns.
| Design | Quantity estimated | Names needed | Hours | Limit |
|---|---|---|---|---|
| Two-arm trial, screened against unscreened | Net commitment difference | 23,988 per arm | 198,450 | Detects the lost commitments only at campaign scale |
| Randomised follow-up offers among cleared discretionary-check failures | Cleared-group commitment rate (illustrative 0.5 percentage point margin) | 1,013 | 6,077 | Applies to the independently cleared group only |
| Audit of random screen failures by a deeper check | Fundable share among failures (within 1 point) | 831 | 1,246 | Measures structure, not conversion |
MatchPoint analysis of the constructed population. Model output under stated inputs; not an observed result. Normal approximation at 95% confidence; two-arm trial at 80% power. Audit priced at 1.5 hours.
21 The calculations reconcile exactly and an independent simulation agrees
The model asserts 37 control identities and counts them. They include that truth patterns sum to one under independence and correlation, that each condition keeps its marginal prevalence under correlation, that meetings equal non-convertible meetings plus fundable names met for all 65 policies, and that fundable retention equals the product of sensitivities times the delay factor. The ratio rule is checked against a brute-force search over 24 orders, and the closed-form marginal value in equation 4 is checked against direct evaluation for each check not in the best policy.
A simulation run separately from the exact calculation draws 1,500,000 names per case. The four cases cover two policies under independent and correlated conditions. The largest discrepancy for meetings or fundable names met is about 0.7 standard errors. Screening hours differ by less than one per cent in every case. The replicated cohorts use seed 20261014 and 4,000 replications per size. Table 14 lists the controls. Rounded display applies to all figures; the calculation uses full precision. The simulation is a check on the code and not on the premises: it draws from the same assumptions as the exact calculation, so agreement shows only that the arithmetic and the sampling logic are consistent.
These checks establish arithmetic consistency under the model assumptions. The simulation generates outcomes from the same conditions the screens test. The decision thresholds depend on the assumed inputs and need observed evidence before application to a campaign.
Scroll across to see all columns.
| Control | Expected result |
|---|---|
| Truth patterns sum to one | Independent and correlated joints equal 1 within 1e-10 |
| Fundable share | Equals product of four prevalences (11.9%) |
| Policy enumeration | 65 ordered subsets of four checks |
| Meetings and hours identities | Hold for all 65 policies |
| Fundable retention | Equals product of sensitivities times delay factor |
| Ratio rule | Equals brute-force minimum screening hours over 24 orders |
| Marginal inclusion formula | Equals evaluated change in net value for each check not in the best policy |
| Independent simulation | 1,500,000 names per case across four cases; maximum discrepancy about 0.7 standard errors |
| Selection bias | Full adjustment and random assignment recover the true effect |
| Replicated cohorts | 4,000 replications per cohort size, seed 20261014 |
| Total assertions counted | 37 controls passed |
MatchPoint analysis. Controls asserted by the model on every run; the count is reported by the model.
22 Report the screen to a client as hours saved, commitments at risk and the audit that bounds the risk
Report the change in meetings and analyst hours, with the comparison period or assigned control group stated. Use verified audit labels to estimate how many avoided meetings would have involved names that could not convert. Estimate signed commitments at risk separately from permitted follow-up or from an explicitly modelled conversion assumption. Report the interval and the value per commitment used in the decision.
State each check, its position in the sequence, its pass rate and the sampling fractions for both pass and fail strata. Report unresolved audit labels and the size of the cleared follow-up group. Present commitments per meeting alongside total commitments and total hours. If those measurements are unavailable, present the scenario results for planning and disclose the missing observations.
Apply equation 4 to discretionary checks within the lawful set of choices. Use documented costs and expected losses, including the risk of rejecting fundable names. If the estimated benefit is sensitive to the value of a commitment, test the check in a cleared pilot. Route decisions based on uncertain evidence to review before excluding a name.
23 Data and AI can maintain the checks, but a classifier does not remove the need for the audit
Candidate uses for automation include extracting mandate terms from published documents, matching entities to registers and preparing a timing enquiry for review. A lower check cost improves its modelled value with other inputs held fixed. A stale document or an incorrect match can change the error rates. Evaluate cost, delay and screening accuracy together before replacing a human check.
Evaluate an automated screen against reference labels in a sample drawn from both passes and failures among the names reaching that stage. Weight observations by their sampling probabilities. A test set of previously met names excludes some of the cases that determine the false-negative rate. Retain the model version and dated evidence for each reviewable decision.
Human decision rights should stay explicit. A person approves a policy and its order, approves the audit sample, and decides whether a rejected name with a changed circumstance returns to the list. A rejection should record the check, the evidence and its date, so that a later change in mandate or timing can reopen the name. Without that record a rejection cannot be audited, and the false-negative rate cannot be estimated. The paper reports no trained model and no measured benefit from AI; it specifies how a claimed benefit would be tested.
24 Limitations and the evidence needed before adding a check
The experiment is authored and deterministic in its structure. The four conditions are binary, the checks err independently in the base case, and the conversion rate of a met fundable counterparty is the same for all. Real conditions are graded, and counterparties change their mandates. The model omits the cost of a failed closing after signature, the benefit of a relationship formed in a meeting that does not convert, and any effect of a screening enquiry on the counterparty's view of the raiser. These omissions could move the break-even in either direction.
The regulatory sources are a sample. They cover SEC rules, United Kingdom client categorisation and electronic marketing, DIFC client classification, Abu Dhabi Global Market customer due diligence, the UAE federal data protection statute and one international standard. The Saudi Arabian capital markets text and separate DIFC and ADGM data protection rules were not reviewed. The Dubai client classification text cited is version 51 of July 2026. The secondary review used for the ordering rule restates the original result. Thresholds change; any live use requires current applicable texts and legal advice. Nothing here is investment, legal or regulatory advice.
Fix the policy under evaluation and audit random samples of passes and failures at each stage. Evaluate the possible loss of signed commitments with a separate permitted follow-up design where feasible. Revisit equation 4 with observed inputs and a range of stated commitment values. Where conversion outcomes remain unobserved, show how the policy choice changes across plausible conversion rates.
References
- U.S. Securities and Exchange Commission. 17 CFR 230.501(a), accredited investor definition. 2025 annual CFR, GovInfo. https://www.govinfo.gov/content/pkg/CFR-2025-title17-vol3/xml/CFR-2025-title17-vol3-sec230-501.xml
- U.S. Securities and Exchange Commission. 17 CFR 230.506(c), conditions for general solicitation and non-exclusive verification methods. 2025 annual CFR, GovInfo. https://www.govinfo.gov/content/pkg/CFR-2025-title17-vol3/xml/CFR-2025-title17-vol3-sec230-506.xml
- Financial Conduct Authority. FCA Handbook, Conduct of Business Sourcebook, COBS 3.5, Professional clients (rules 3.5.2R and 3.5.3R). Indexed Handbook text displayed as of 19 November 2026. https://handbook.fca.org.uk/handbook/cobs3/cobs3s5
- Dubai Financial Services Authority. The DFSA Rulebook, Conduct of Business Module (COB), consolidated version COB/VER51/07-26, July 2026, rules 2.3.1 to 2.3.8. https://dfsaen.thomsonreuters.com/sites/default/files/net_file_store/DFSA1547_12383_VER510726.pdf
- Financial Action Task Force. International Standards on Combating Money Laundering and the Financing of Terrorism & Proliferation: The FATF Recommendations, amended June 2026. Recommendation 10, pp. 14–15. https://www.fatf-gafi.org/content/dam/fatf-gafi/recommendations/fatf-recommendations-2012.pdf
- Financial Services Regulatory Authority, Abu Dhabi Global Market. Anti-Money Laundering and Sanctions Rulebook (AML), version VER11.210526, chapter 8, Customer Due Diligence. https://assets.adgm.com/download/assets/Anti-Money+Laundering+and+Sanctions+Rules+and+Guidance+VER11.210526+.pdf/6a0053227a6911ef819fe625b52cf370
- United Kingdom. The Privacy and Electronic Communications (EC Directive) Regulations 2003, regulation 22, as amended with effect from 5 February 2026. Revised version on legislation.gov.uk, accessed 14 October 2026. https://www.legislation.gov.uk/uksi/2003/2426/regulation/22
- Information Commissioner's Office. Guidance on direct marketing using electronic mail, updated 28 April 2026. How do we comply with the PECR electronic mail marketing rules? Accessed 20 November 2026. https://ico.org.uk/for-organisations/direct-marketing-and-privacy-and-electronic-communications/guidance-on-direct-marketing-using-electronic-mail/how-do-we-comply-with-the-pecr-electronic-mail-marketing-rules/
- United Arab Emirates. Federal Decree by Law No. (45) of 2021 Concerning the Protection of Personal Data, arts. 2, 4 and 31. Official published English text, accessed 20 November 2026. https://uaelegislation.gov.ae/en/legislations/1972/download
- Gompers, P., Gornall, W., Kaplan, S. N. and Strebulaev, I. A. How Do Venture Capitalists Make Decisions? NBER Working Paper 22587, September 2016, Table 6 and section on the deal funnel. Later published in the Journal of Financial Economics. https://www.nber.org/papers/w22587
- Bernstein, S., Korteweg, A. and Laws, K. Attracting Early-Stage Investors: Evidence from a Randomized Field Experiment. Journal of Finance 72(2), 2017, 509-538. Page-level description read; full text not reviewed. https://www.gsb.stanford.edu/index.php/node/399181
- Weitzman, M. L. Optimal Search for the Best Alternative. Econometrica 47(3), May 1979, 641-654. Abstract only reviewed. https://www.econometricsociety.org/publications/econometrica/1979/05/01/optimal-search-best-alternative
- Ünlüyurt, T. Sequential testing problem: A follow-up review. arXiv:2511.15742, November 2025; published in Discrete Applied Mathematics 377 (2025), 356-369. Cites Butterworth (1972) for the series-system ordering. https://arxiv.org/abs/2511.15742
- Li, L., Shen, C., Li, X. and Robins, J. M. On weighting approaches for missing data. Statistical Methods in Medical Research 22(1), 2013, 14-30 (online 2011). https://pmc.ncbi.nlm.nih.gov/articles/PMC3998729
About the Author
Chennakeshav (CK) is a corporate finance and investment banking executive with 25+ years of global experience in deal origination, structuring and execution across M&A, growth capital and corporate strategy. He has led value-creation mandates for founders, corporates and funds — bridging the boardroom view to hands-on execution and close.
His career spans Morgan Stanley, HSBC, Lloyds Banking Group, EWEC, ADQ portfolio companies and Emirates Growth Fund, across TMT, real estate, fintech, deeptech, cleantech, infrastructure and energy. He has partnered with C-suite leaders, private equity and venture funds, sovereign wealth funds and family offices to finance complex fund raises and scale-up ventures, and has led M&A due diligence, post-merger integration and business-transformation initiatives to create value.
At Matchpoint Partners he is Managing Partner, leading the firm's corporate finance, M&A and capital-raising practice. He holds an MBA from London Business School, an engineering degree from VTU and a Master of Laws (LLM, in progress) from UCL London.
An active start-up mentor, CK mentors at Techstars, DIFC FinTech Hive, Startup Grind, Founder Institute and IN5, serves as Entrepreneur Mentor in Residence (EMiR) at London Business School, and judges the Entrepreneurship World Cup.
https://www.linkedin.com/in/ckadya/
https://www.matchpoint-partners.com/team/ck-adya.html
Disclaimer
This paper is part of a continuing series on the structure of private and alternative markets. The views expressed are the author's own. The paper is for information only, describes market structure in general terms, and does not constitute investment, legal, tax or regulatory advice or a recommendation in respect of any security, vehicle or counterparty.
