

1 The decision is how much of the file to send before the first conversation
A sponsor, founder or fund manager preparing an approach to investors faces a choice that precedes any scoring or ranking of the list. The first message can carry a name-free description, a verified summary of the headline numbers, a full information memorandum, or access to documents that only a counterparty in diligence would normally see. Each step gives the recipient more to judge and gives the sender less control over what happens to the material. This paper treats that choice as a measurable trade-off between the response gained and the confidentiality exposure created.
The paper does not ask which investors to contact, how to rank them or how to reach them through introductions; those questions belong to neighbouring work on mandate fit and on route to the investor. It asks only how deep the first disclosure should be for a list that has already been chosen, and when the next layer should be released.
We propose a framework with four parts. First, a ladder of five disclosure stages with a record of what each releases. Second, a scoring of every item on relevance to the recipient, sensitivity to the sender and verifiability. Third, a mapping of each stage to the rules that govern who may receive it. Fourth, an authored quantitative experiment that varies first-approach depth and reports replies, qualified meetings, diligence, commitments and expected loss. The experiment is constructed and reports no observed result.
2 Define the outcome and the exposure before choosing a depth
A reply is not the aim of an approach. The outcome that matters is a qualified meeting: a conversation with an investor who is able to invest, at a stage of its process where a decision can be made, and who has seen enough of the file to know what it is considering. Beyond that, the paper counts progression into diligence and a signed commitment, with a round counted as complete when 2 or more commitments are obtained.
Exposure needs an equally precise definition. We define it as the expected loss to the sender if recipients who hold the file pass it on, use it against the sender or allow it to be seen by a competitor, customer or employee. Two things set the size of that loss: how sensitive the material held by each recipient is, and how likely that recipient is to leak it given the legal and commercial protection in place. A teaser that names no one carries little exposure however many people receive it. A data room opened to the whole list carries a great deal.
The comparison between response and exposure is made on a common money scale in the experiment. A deal value of USD 100 million sets the loss from a leak at full sensitivity, and a benefit of USD 15 million sets the value of completing the round. These are stated model inputs with no market source; Section 16 varies the benefit, and the leak hazard that scales expected loss.
The simulation uses mandate fit as a binary authored flag and defines a qualified meeting as a meeting with that flag. It does not separately model investment-committee authority, current deployment timing, legal eligibility or an observed check size. Those commercial checks remain necessary in an actual process and are not validated by the simulated meeting count.
3 Disclosure is a signal that buys response and creates exposure at the same time
Arrow identified the core difficulty in 1962. The value of information to a purchaser is not known until the purchaser has it, but once it has been disclosed the purchaser has in effect acquired it without cost. Where the seller cannot retain property rights in the use of the information, the buyer decides on less than optimal criteria, such as the average value of information of that class. The passage concerns inventions and research. It establishes the paradox as a general feature of selling information and does not measure its size. [1]
The later literature on verifiable disclosure asks what a seller does when it can prove facts about its product. In the standard result described by Shishkin, Titova and Zhang, a sender who can prove a favourable state reveals it, and this unravels until all states are revealed. Their working paper explains that this result depends on the receiver being able to adjust its action continuously. When the receiver chooses among a few actions, as an investor does when it replies or does not, equilibria in which the sender withholds some information are possible. The paper is a theoretical model with no confidentiality cost and no empirical content. [2]
Milgrom's survey in the Journal of Economic Perspectives reviews the theoretical arguments about how sellers disclose information to encourage buyers, and the role of regulation in encouraging efficient disclosure. The discussion here relies on the abstract's stated theoretical scope. [3] These sources justify two design choices: an investor's reply is a binary decision on a noisy signal that sharpens with disclosure, and withholding may be optimal. They supply no parameter for either.
4 The closest field evidence concerns what investors respond to, not how deep to disclose
Bernstein, Korteweg and Laws ran a randomised field experiment on AngelList with about 4,500 active early-stage investors and nearly 17,000 emails, randomising the information on start-up characteristics in each email. The average investor responded strongly to information about the founding team but not to information about traction or existing lead investors, while the least experienced investors responded to all categories. The Stanford summary adds that response was measured by whether an investor chose to learn more about the business. This is the closest study to our question. [4]
The difference from this paper is important. That experiment varied which categories of information an investor saw, in a setting where the information was already shared on a platform and confidentiality was not at issue. It did not vary the depth of a confidential file and it did not measure leakage or commitments. Only the abstract and the institutional summary were read, not the full paper. It supports the view that response depends on the content of the first message. It does not tell a sender how much to disclose.
Boone and Mulherin examine how firms are sold using data on the private, pre-public process. They report that half of the targets in their sample were auctioned among multiple bidders while the remainder negotiated with a single bidder, and that public bidder counts understate the competition that occurs privately. The abstract was the only part opened. The result shows that a private process with several recipients is common in the settings studied, which is why the number of recipients of confidential material matters. It is a study of acquisitions of public targets and says nothing about response to different disclosure depths. [5]
5 Use a five-stage ladder and record what each stage releases and to whom
The ladder used throughout has five stages. The blind teaser describes sector, size band and geography without naming the company. The verified teaser adds headline figures that the recipient can check, such as audited revenue or a lender-confirmed facility. The information memorandum adds customer concentration, contract terms and the plan. The first data-room tier adds management accounts, contracts and the capitalisation table. The second tier adds named customers, pricing, intellectual property and employee terms. The ladder is an analytical device, and none of the sources opened establishes it as a market convention.
Each stage needs a record: what was released, to whom, on what date, under what confidentiality terms and with what verification. The record is useful for three reasons. It lets the sender answer a regulator or counterparty who asks what was disclosed, trace a leak to the stage at which it became possible, and compare stage-by-stage conversion in later campaigns, as the design in Section 20 requires. Table 1 sets out the proposed record.
| Stage | What the recipient receives | Gate before release | Record kept |
|---|---|---|---|
| Blind teaser | Sector, size band, geography, one-line mandate | Recipient on the approved list | Date, recipient, version |
| Verified teaser | Headline figures with a named verifier | Recipient screened for fit and for the relevant promotion rule | As above plus verifier and evidence |
| Information memorandum | Customers, contracts, plan, management | Signed confidentiality agreement | Signatory, date, agreement version |
| Data room tier 1 | Management accounts, contracts, cap table | Evidence of fit and of authority to proceed | Access log by document |
| Data room tier 2 | Named customers, pricing, IP, employee terms | Advanced diligence and named team list | Access log, watermark, named users |
Proposed record. The ladder is an authored device; no source establishes it as a market convention.
The table separates what is released from the gate that must be passed first. The gate for the first two stages is a decision by the sender about the recipient, not a document. The gate for the memorandum is a signed agreement. The later gates are evidence that the recipient is able and authorised to proceed. A sender who skips a gate has made an explicit choice to accept the exposure that follows, and the record should show that choice.
6 Score every item on relevance, sensitivity and verifiability before assigning a stage
A stage is a bundle of items, and an item belongs in the earliest stage at which its relevance to the recipient outweighs its sensitivity to the sender. Relevance is how much the item changes an investor's decision to engage. Sensitivity is how much harm follows if the item reaches a competitor, a customer or an employee. Verifiability is whether the recipient can check the item without further disclosure. An item that is highly relevant, of low sensitivity and easily verified belongs in the first message. An item of high sensitivity and low relevance to a first decision does not belong there.
Table 2 gives an authored scoring for a typical operating company. The scores run from 1 to 5 and are the author's judgement about the generic case, not measurements. A sender should replace them with its own, which will differ by sector: customer names are central to a software company and incidental to a landowner.
| Item | Relevance | Sensitivity | Verifiable by recipient | Earliest stage |
|---|---|---|---|---|
| Sector, size band, geography | 3 | 1 | Partly | Blind teaser |
| Audited revenue and profit range | 5 | 2 | Yes, from filings or auditor | Verified teaser |
| Customer concentration, unnamed | 4 | 3 | Partly | Memorandum |
| Material contract terms | 4 | 4 | Yes, in the room | Memorandum, summary |
| Capitalisation table and shareholder terms | 4 | 3 | Yes | Data room 1 |
| Named customers and pricing | 3 | 5 | Yes | Data room 2 |
| Source code, formulae, process detail | 2 | 5 | Partly | Data room 2, restricted |
| Employee-level data | 1 | 5 | Yes | Data room 2, anonymised |
Authored scores from 1 (low) to 5 (high) for a generic operating company. Judgement, not measurement; replace with the sender's own scoring.
The table shows why the memorandum stage is a natural dividing line. Items scoring 4 on relevance and 3 or 4 on sensitivity, such as customer concentration, contract terms and the capitalisation table, have no safe place in a first message, and equally no reason to wait until advanced diligence. They are the items that a signed agreement exists to release, at the memorandum or the first data-room tier. The experiment later translates the table into numbers: cumulative sensitivity of 0.02, 0.10, 0.35, 0.65 and 1.00 at the five stages, which are inputs and not findings.
7 Confidentiality protection follows the steps taken, not the label on the document
Both the United States and the European Union define a trade secret by reference to steps the holder has taken. The United States definition in the Defend Trade Secrets Act requires that the owner has taken reasonable measures to keep the information secret and that the information derives independent economic value from not being generally known. The EU Trade Secrets Directive requires that the information is secret, has commercial value because it is secret and has been subject to reasonable steps under the circumstances. Neither states what steps suffice for a particular disclosure. [6, 7]
The consequence for outreach is that sending a file widely without conditions can weaken the protection that the sender would later wish to rely on. A document released to a long list without a confidentiality agreement, or under a click-through that nobody reads, provides weaker evidence of reasonable steps than one released to a named person under a signed agreement. This is an inference from the wording of the definitions. The statutes do not say that an unsigned release forfeits protection, and no case law or national transposition was reviewed.
Regulation FD in the United States shows the same mechanism from the issuer's side. It requires an issuer that discloses material non-public information to certain market professionals and holders to make public disclosure, at the same time for an intentional disclosure and promptly otherwise, but it excludes a disclosure made to a person who expressly agrees to maintain the information in confidence, and one made to a person who owes a duty of trust or confidence to the issuer. [8] Its scope depends on the issuer definition in 17 CFR 243.101(b), including the relevant reporting status and exclusions. A private fundraising label alone does not determine applicability. The provision demonstrates a specific confidentiality exception within that regime and does not establish general permission to disclose.
The model assigns different assumed hazard reductions to a signed agreement and a click-through gate. The cited legal definitions establish the relevance of reasonable protective measures; they do not establish either the effectiveness or the ordering of these model protection factors. None supplies a size for either reduction. The experiment uses 75% and 35% as stated protection factors and varies them in a stress case.
8 Pre-announcement trading evidence and recipient-count controls
Public-takeover studies provide evidence on pre-announcement trading, where announcements and prices make unusual market activity observable. Augustin, Brenner and Subrahmanyam examine equity options trading before M&A announcements. In the October 2015 draft read for this paper, about 25% of takeovers show statistically significant positive abnormal option volume in the 30 days before announcement. The authors argue that the pattern is consistent with informed trading and cannot be explained by deal predictability, speculation, news and rumours, insider trading by corporate insiders or leakage in the stock market. They also report that the SEC litigates only about 7% of deals in their sample. [9]
What the study establishes is that information about a confidential transaction appears to reach the market before announcement in a material share of public deals. What it does not establish is the channel. Abnormal volume does not identify who leaked, whether a sender's counterparties were involved or whether any single approach to an investor caused it. It concerns listed targets, not private raises, and is a working paper draft. It documents pre-announcement trading patterns without estimating a causal relationship between recipient counts and leakage. The model's accumulation of exposure across recipients is an authored mechanism, and this study supplies no private-placement leak rate.
The UK Takeover Code expresses the same principle as a rule. Rule 2.1 requires persons privy to confidential information to treat it as secret, to pass it on only where necessary and to minimise the chances of a leak. Rule 2.2(e) requires an announcement when negotiations or discussions are about to be extended to include more than a very restricted number of people, and Note 1(d) on Rule 2.2 states that the Panel should be consulted if the parties wish to approach a wider group without making an announcement. [10]
The Code applies to offers for companies within its scope, not to private fundraising. Its relevance here is as an institutional statement that the number of recipients is itself a risk variable, which the experiment represents by counting every recipient at the stage of the file it holds.
9 The perimeter rules decide who may receive an investment-related message at all
In the United Kingdom, section 21 of the Financial Services and Markets Act 2000 prohibits a person from communicating, in the course of business, an invitation or inducement to engage in investment activity unless the person is authorised or the content is approved by an authorised person that is permitted to give the approval. The Financial Promotion Order provides exemptions, including for communications made only to investment professionals or to high net worth companies, where the sender believes on reasonable grounds that recipients are within the category or the communication is reasonably directed only at them. [11, 12]
The DFSA Rulebook in the Dubai International Financial Centre contains a comparable prohibition. Rule 3.4.1 prevents a person other than an authorised person from making a financial promotion in or from the DIFC, subject to listed exceptions, including a communication directed at and capable of acceptance exclusively by a person who appears on reasonable grounds to be a professional client of a specified type. Rule 3.5.1 requires reasonable care that a communication intended only for professional clients is not sent to anyone who appears not to be one and carries a clear statement to that effect. [13]
In the United States, Rule 502(c) of Regulation D prohibits an issuer relying on the exemption from offering or selling by general solicitation or general advertising, except where Rule 504(b)(1) or Rule 506(c) applies. Rule 502(b)(2) separately requires, where a sale under Rule 506(b) is made to a purchaser who is not an accredited investor, a written description of material written offering information given to accredited investors, and an opportunity to ask questions. Depth is therefore not uniform: what one investor is shown can create obligations towards another. [14]
Where the instrument is listed, the EU Market Abuse Regulation adds a further layer. Article 11, as amended by Regulation (EU) 2024/2809 from December 2024, defines a market sounding as communication of information, before any announcement of a transaction, to gauge the interest of potential investors. The disclosing party must consider, and record in writing, whether inside information will be disclosed, and keep its records for at least five years. Obtaining consent, warning the recipient against trading and of its duty of confidentiality, and recording what was disclosed, to whom and when, are optional conditions for treating the disclosure as made in the normal exercise of its duties. [15]
| Regime | Provision read | Trigger | Effect on depth or recipient |
|---|---|---|---|
| UK financial promotion | FSMA s21; FPO arts 19 and 49 | Invitation or inducement to invest | Send only to recipients within an exemption, or have content approved |
| DIFC financial promotion | DFSA GEN 3.4.1 and 3.5.1 | Promotion in or from the DIFC | Professional-client exemption; statement; no other recipients |
| US private offering | 17 CFR 230.502(b), (c) | Offer under Regulation D | No general solicitation; information duties to non-accredited buyers |
| EU market sounding | MAR art 11 | Pre-announcement approach about a listed instrument | Written assessment; five-year records; consent optional for safe harbour |
| UK takeovers | Takeover Code rules 2.1, 2.2 | Possible offer for a company in scope | Secrecy; announce if approach goes beyond a very restricted number |
| Selective disclosure by US issuers | 17 CFR 243.100 | Disclosure of material non-public information | Confidentiality undertaking removes the public disclosure duty |
| Trade secrets | 18 USC 1839(3); Directive 2016/943 art 2(1) | Reliance on secrecy later | Reasonable measures or steps must be shown |
Summary of provisions opened for this paper. Status and date are given in the References. Not legal advice and not a statement that any provision applies to a given raise.
10 Personal data rules limit the list as well as the file
A target list is a collection of personal data about named individuals at investors, and contact must respect data protection law where it applies. The General Data Protection Regulation requires, in Article 5, that personal data are collected for specified, explicit and legitimate purposes and limited to what is necessary for those purposes. Article 14 requires a controller that did not obtain the data from the individual to provide specified information, at the latest at the time of first communication where the data are used for that purpose. [16]
Article 21(2) and (3) give the individual a right to object at any time to processing for direct marketing, after which the data may no longer be processed for that purpose, and Article 21(4) requires that the right be explicitly brought to the individual's attention at the latest at the first communication. These provisions bear on disclosure depth because a first message that is itself a marketing communication triggers the notice and objection duties whatever it contains.
The regimes of the Dubai International Financial Centre, the Abu Dhabi Global Market and the UAE federal law were identified as relevant to a Gulf list, but their official texts could not be opened in this session, and the paper makes no statement about their content. A sender with recipients in those jurisdictions should check each regime directly.
These sources justify a design rule rather than an input: the list should be built and held for the specific purpose of the approach, the first message should state who is contacting the recipient and why, and an objection to direct marketing should end processing for that direct-marketing purpose, subject to the applicable scope of Article 21. The experiment treats such opt-outs as ordinary non-response, which is a simplification.
11 A constructed experiment varies first-approach depth and holds everything else fixed
The experiment is constructed and reports no observed result. In each campaign the sender approaches 200 investors. A share of 30% could invest, and 15% are strategic or competitor-adjacent recipients with a higher leak hazard. Each investor values the deal at a level that combines the quality of the deal, common to all, and the investor's own taste. Table 4 lists the inputs, Table 5 the ladder and Figure 1 the resulting sequence.
| Input | Constructed value | Role in the model |
|---|---|---|
| Investors approached per campaign | 200 | Cohort size; each campaign is replicated 1,000 times |
| Mandate fit (can invest) | 30% | Share of the list that could invest |
| Strategic or competitor-adjacent recipients | 15% | Higher leak hazard and loss given leak |
| Deal quality spread; investor taste spread | 0.50; 1.00 | Standard deviations of value placed on the deal |
| Signal noise, base and credibility offset | 2.5; 0.3 | Noise variance is the first divided by the second plus verified content |
| Stage content, credibility, sensitivity, load | Table 5 | Ladder of five stages |
| Attention hurdle | 0.45 + 0.20 x cost x ln(1 + load) | Value an investor needs before replying |
| Ghosting per round; NDA friction | 10%; 10% | Non-response unrelated to merit |
| Leak hazard, financial; strategic | 0.5%; 3.0% | Per recipient at full sensitivity, before protection |
| Loss given leak at full sensitivity | 4%; 15% of deal value | Financial; strategic recipient |
| Protection by signed NDA; by click-through | 75%; 35% | Proportional cut in leak hazard |
| Deal value; benefit of completing the round | USD 100 m; USD 15 m | Money scale for loss and benefit |
| Round completes at | 2 or more commitments | Binary outcome of a campaign |
| Value discount per round of delay | 5% | Time cost of extra round trips |
Constructed inputs. Each value is an authored assumption and not a market observation. Rounded display.
| Stage | Content weight | Credibility | Signal precision | Stage signal weight | Sensitivity held | Reading load | Non-fit detection |
|---|---|---|---|---|---|---|---|
| Blind teaser | 0.8 | 0.25 | 0.20 | 0.20 | 0.02 | 1 | 30% |
| Verified teaser | 1.2 | 0.80 | 0.58 | 0.42 | 0.10 | 3 | 55% |
| Information memorandum | 1.2 | 0.90 | 1.02 | 0.56 | 0.35 | 12 | 80% |
| Data room tier 1 | 0.8 | 1.00 | 1.34 | 0.63 | 0.65 | 25 | 92% |
| Data room tier 2 | 0.4 | 1.00 | 1.50 | 0.65 | 1.00 | 50 | 97% |
MatchPoint analysis of the constructed ladder. Inputs and derived stage signal weights; not observed values. Reading load is in page-equivalent units.
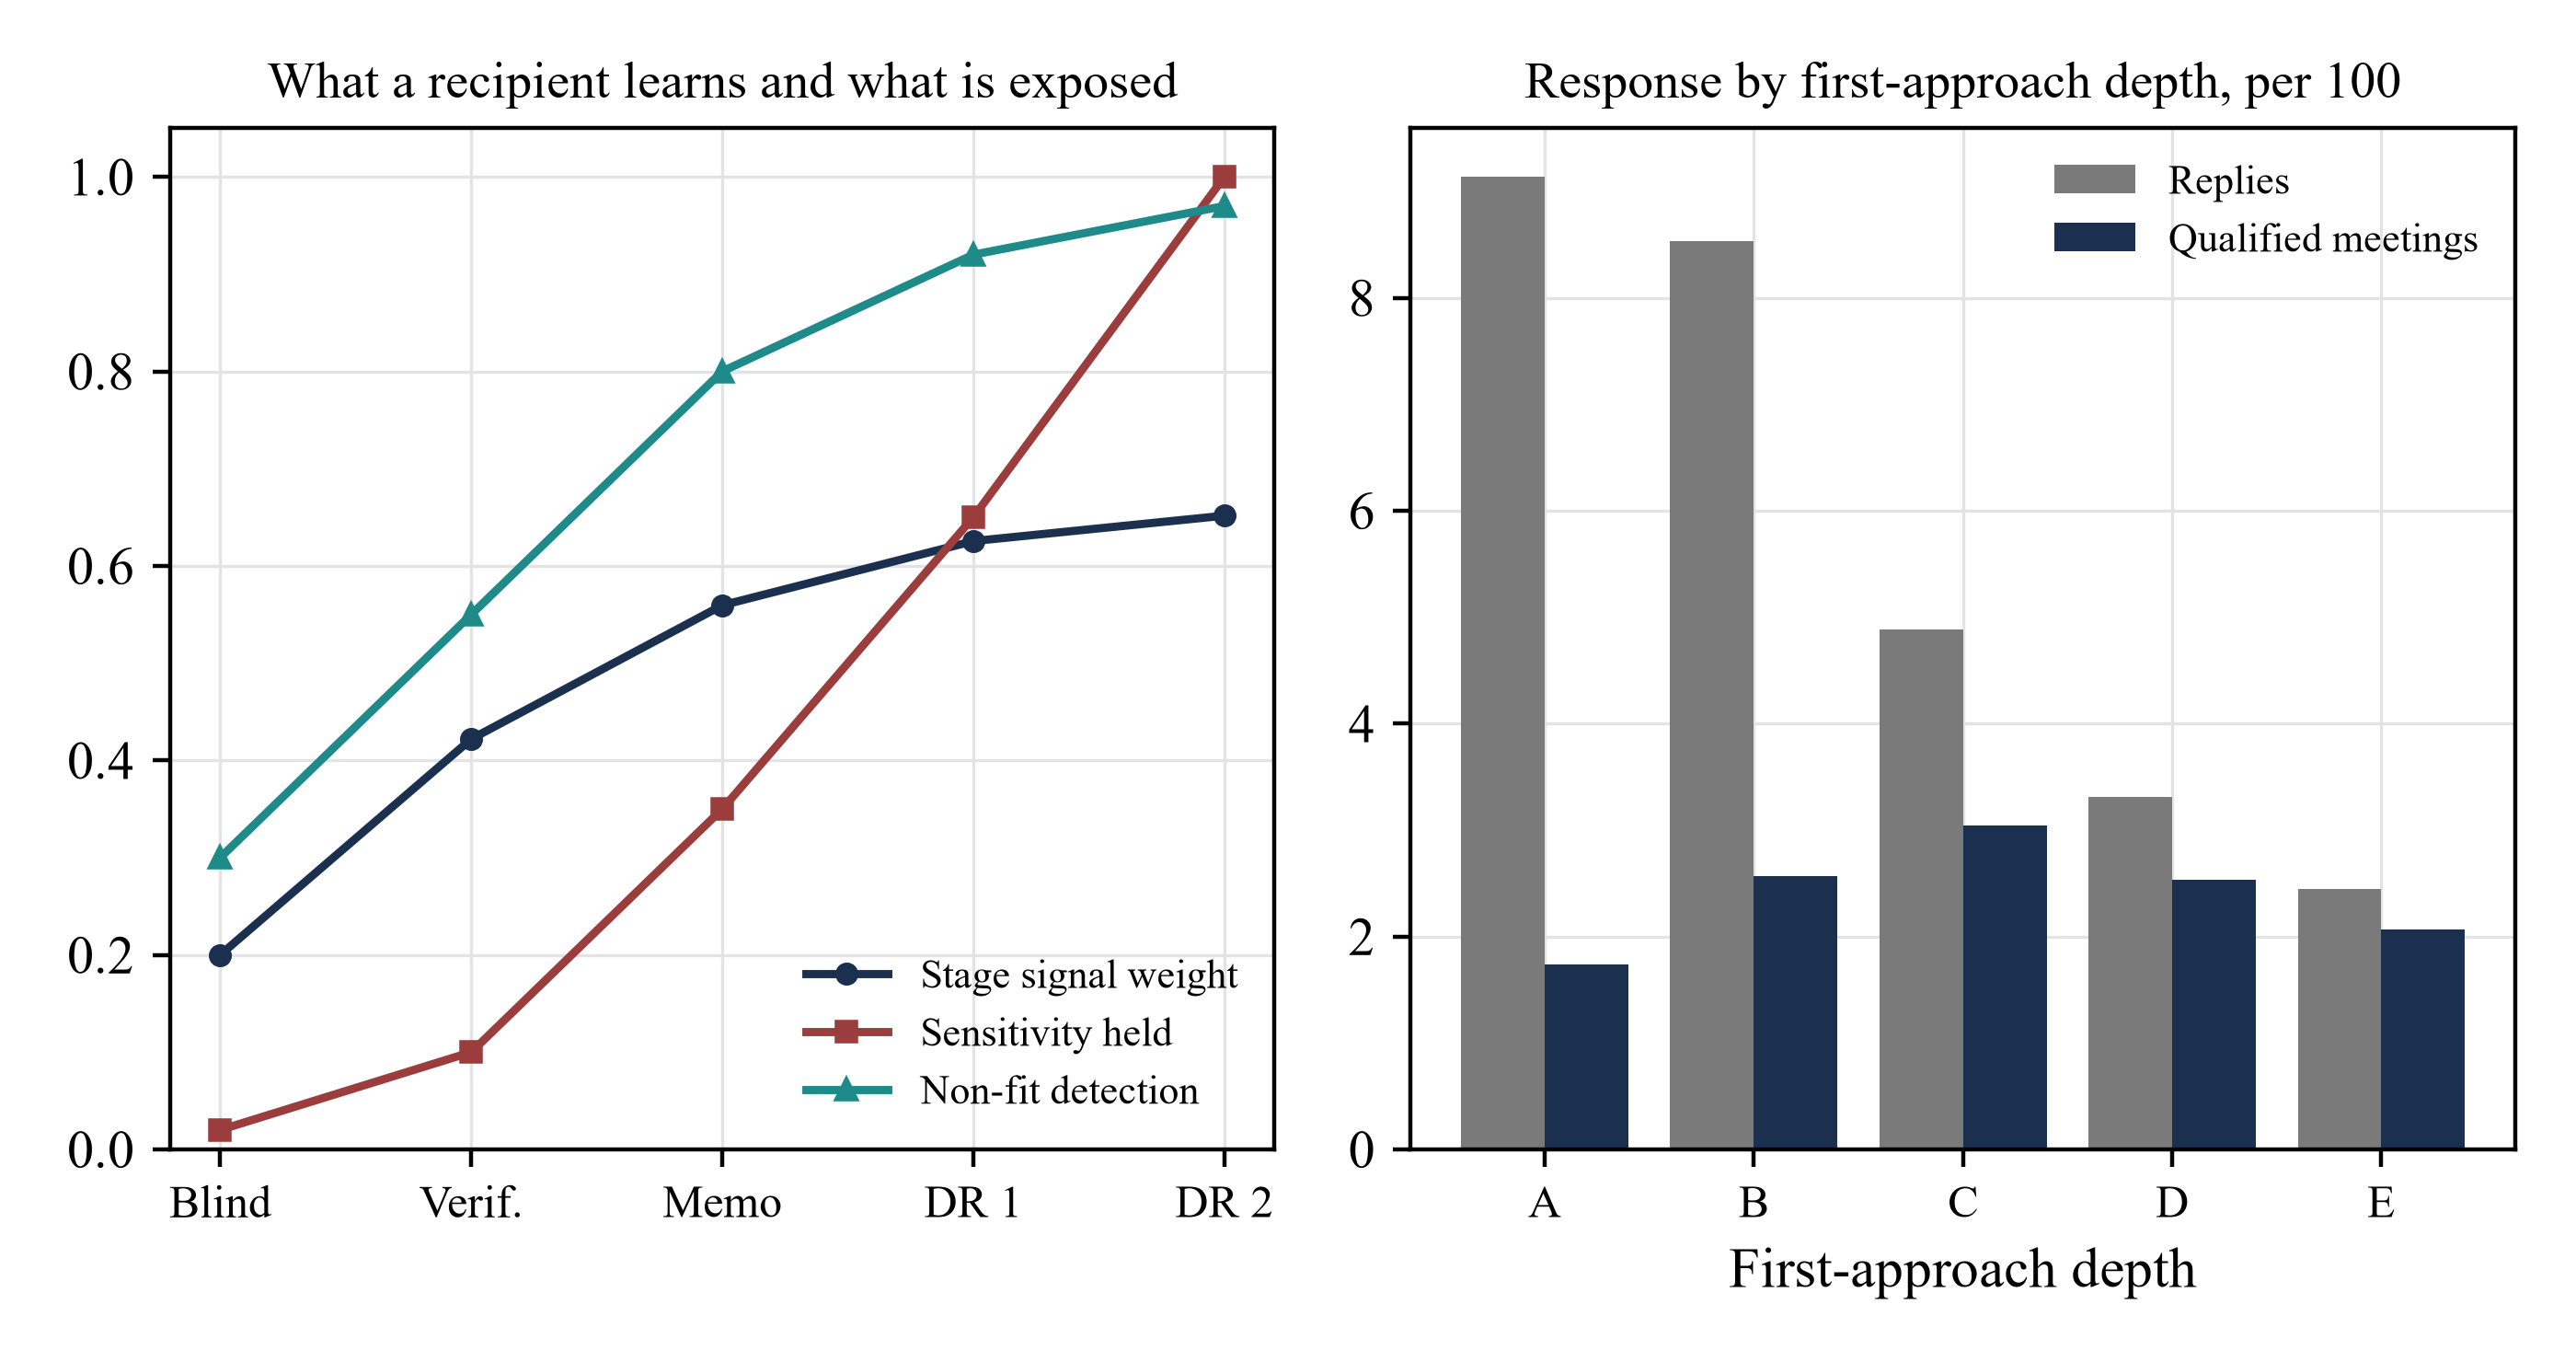
The reply rule follows from the signal. An investor forms a view of the deal from the signal at the stage it receives, shrinks that view towards the prior, and replies if the shrunk value exceeds a hurdle that rises with the reading load and with the investor's own cost of attention. The weight on the signal is 0.20 at the blind teaser, 0.42 at the verified teaser, 0.56 at the memorandum and 0.65 at the final tier. A non-fit investor does not know it is out of mandate until a disqualifier appears, and behaves as if it were fit until then.
In the equations, theta_i is the value investor i places on the deal, z_i is a standard normal draw reused across stages as a common simulation input, and sigma squared is the cross-sectional variance of theta. Each stage uses a marginal Gaussian shrinkage score. Reusing the same draw does not create a nested information process or a coherent sequential Bayesian posterior; recipients in this behavioural experiment apply the specified current-stage score rather than recover value by combining their earlier signals. The noise variance nu_j falls as verified content accumulates: nu_0 is the base noise, kappa_0 an offset, omega_s the content added at stage s and rho_s its credibility. The hurdle combines an attention floor h_0 with attention cost a_i and reading load L_ij, cumulative at first contact and incremental thereafter.
Scroll horizontally to read the figure at full size. You can also open the full-size figure.
MatchPoint analysis of the constructed population. Model output under stated inputs; not an observed result. DR is data room. Left, signal weight, sensitivity and non-fit detection by stage; right, replies and qualified meetings per 100 investors by first-approach depth.
Six approaches are compared. Approaches A to E send the stage named first to everyone and let investors who respond progress to the memorandum. Approach F assigns the memorandum to the top 30% of the list by a noisy fit score, which is a stand-in for what a sender knows about mandate before contact, and the verified teaser to the rest. Every approach is run on the same investors and random draws, so differences come from the approach and not from luck. Each campaign is replicated 1,000 times with seed 1379.
Equation 1b is the attention-threshold pass indicator. An actual first reply in the simulation additionally requires the recipient to have reached that stage and to pass its mandate-disqualification gate; the first-contact flag identifies whether the pass counts as a first reply. Subsequent document delivery, NDA acceptance and meeting ghosting remain separate transitions. These distinctions matter because delivered documents remain exposed after a recipient stops responding.
12 Replies fall with depth, while qualified meetings and commitments peak at the memorandum
Replies per 100 investors fall steadily with first-approach depth, from 9.14 for the blind teaser and 8.53 for the verified teaser to 4.88 for the memorandum, 3.31 for the first data-room tier and 2.45 for the full file. The full file draws 73% fewer replies than the blind teaser. Deeper material raises the investor's reading cost before any relationship exists. Table 6 and Figure 2 give the funnel.
| Approach | Replies | Qualified meetings | Unqualified meetings | Diligence | Commitments | Round completes |
|---|---|---|---|---|---|---|
| A. Blind teaser first | 9.14 | 1.73 | 0.79 | 1.17 | 0.49 | 24% |
| B. Verified teaser first | 8.53 | 2.57 | 1.16 | 1.85 | 0.81 | 38% |
| C. Memorandum first | 4.88 | 3.04 | 1.36 | 2.25 | 1.02 | 46% |
| D. Data room tier 1 first | 3.31 | 2.53 | 0.46 | 1.96 | 0.92 | 43% |
| E. Full file first | 2.45 | 2.06 | 0.15 | 1.63 | 0.79 | 37% |
| F. Tiered by fit score | 7.58 | 2.87 | 1.18 | 2.11 | 0.94 | 44% |
MatchPoint analysis of the constructed population, mean of the replicated campaigns. Model output under stated inputs; not an observed result.
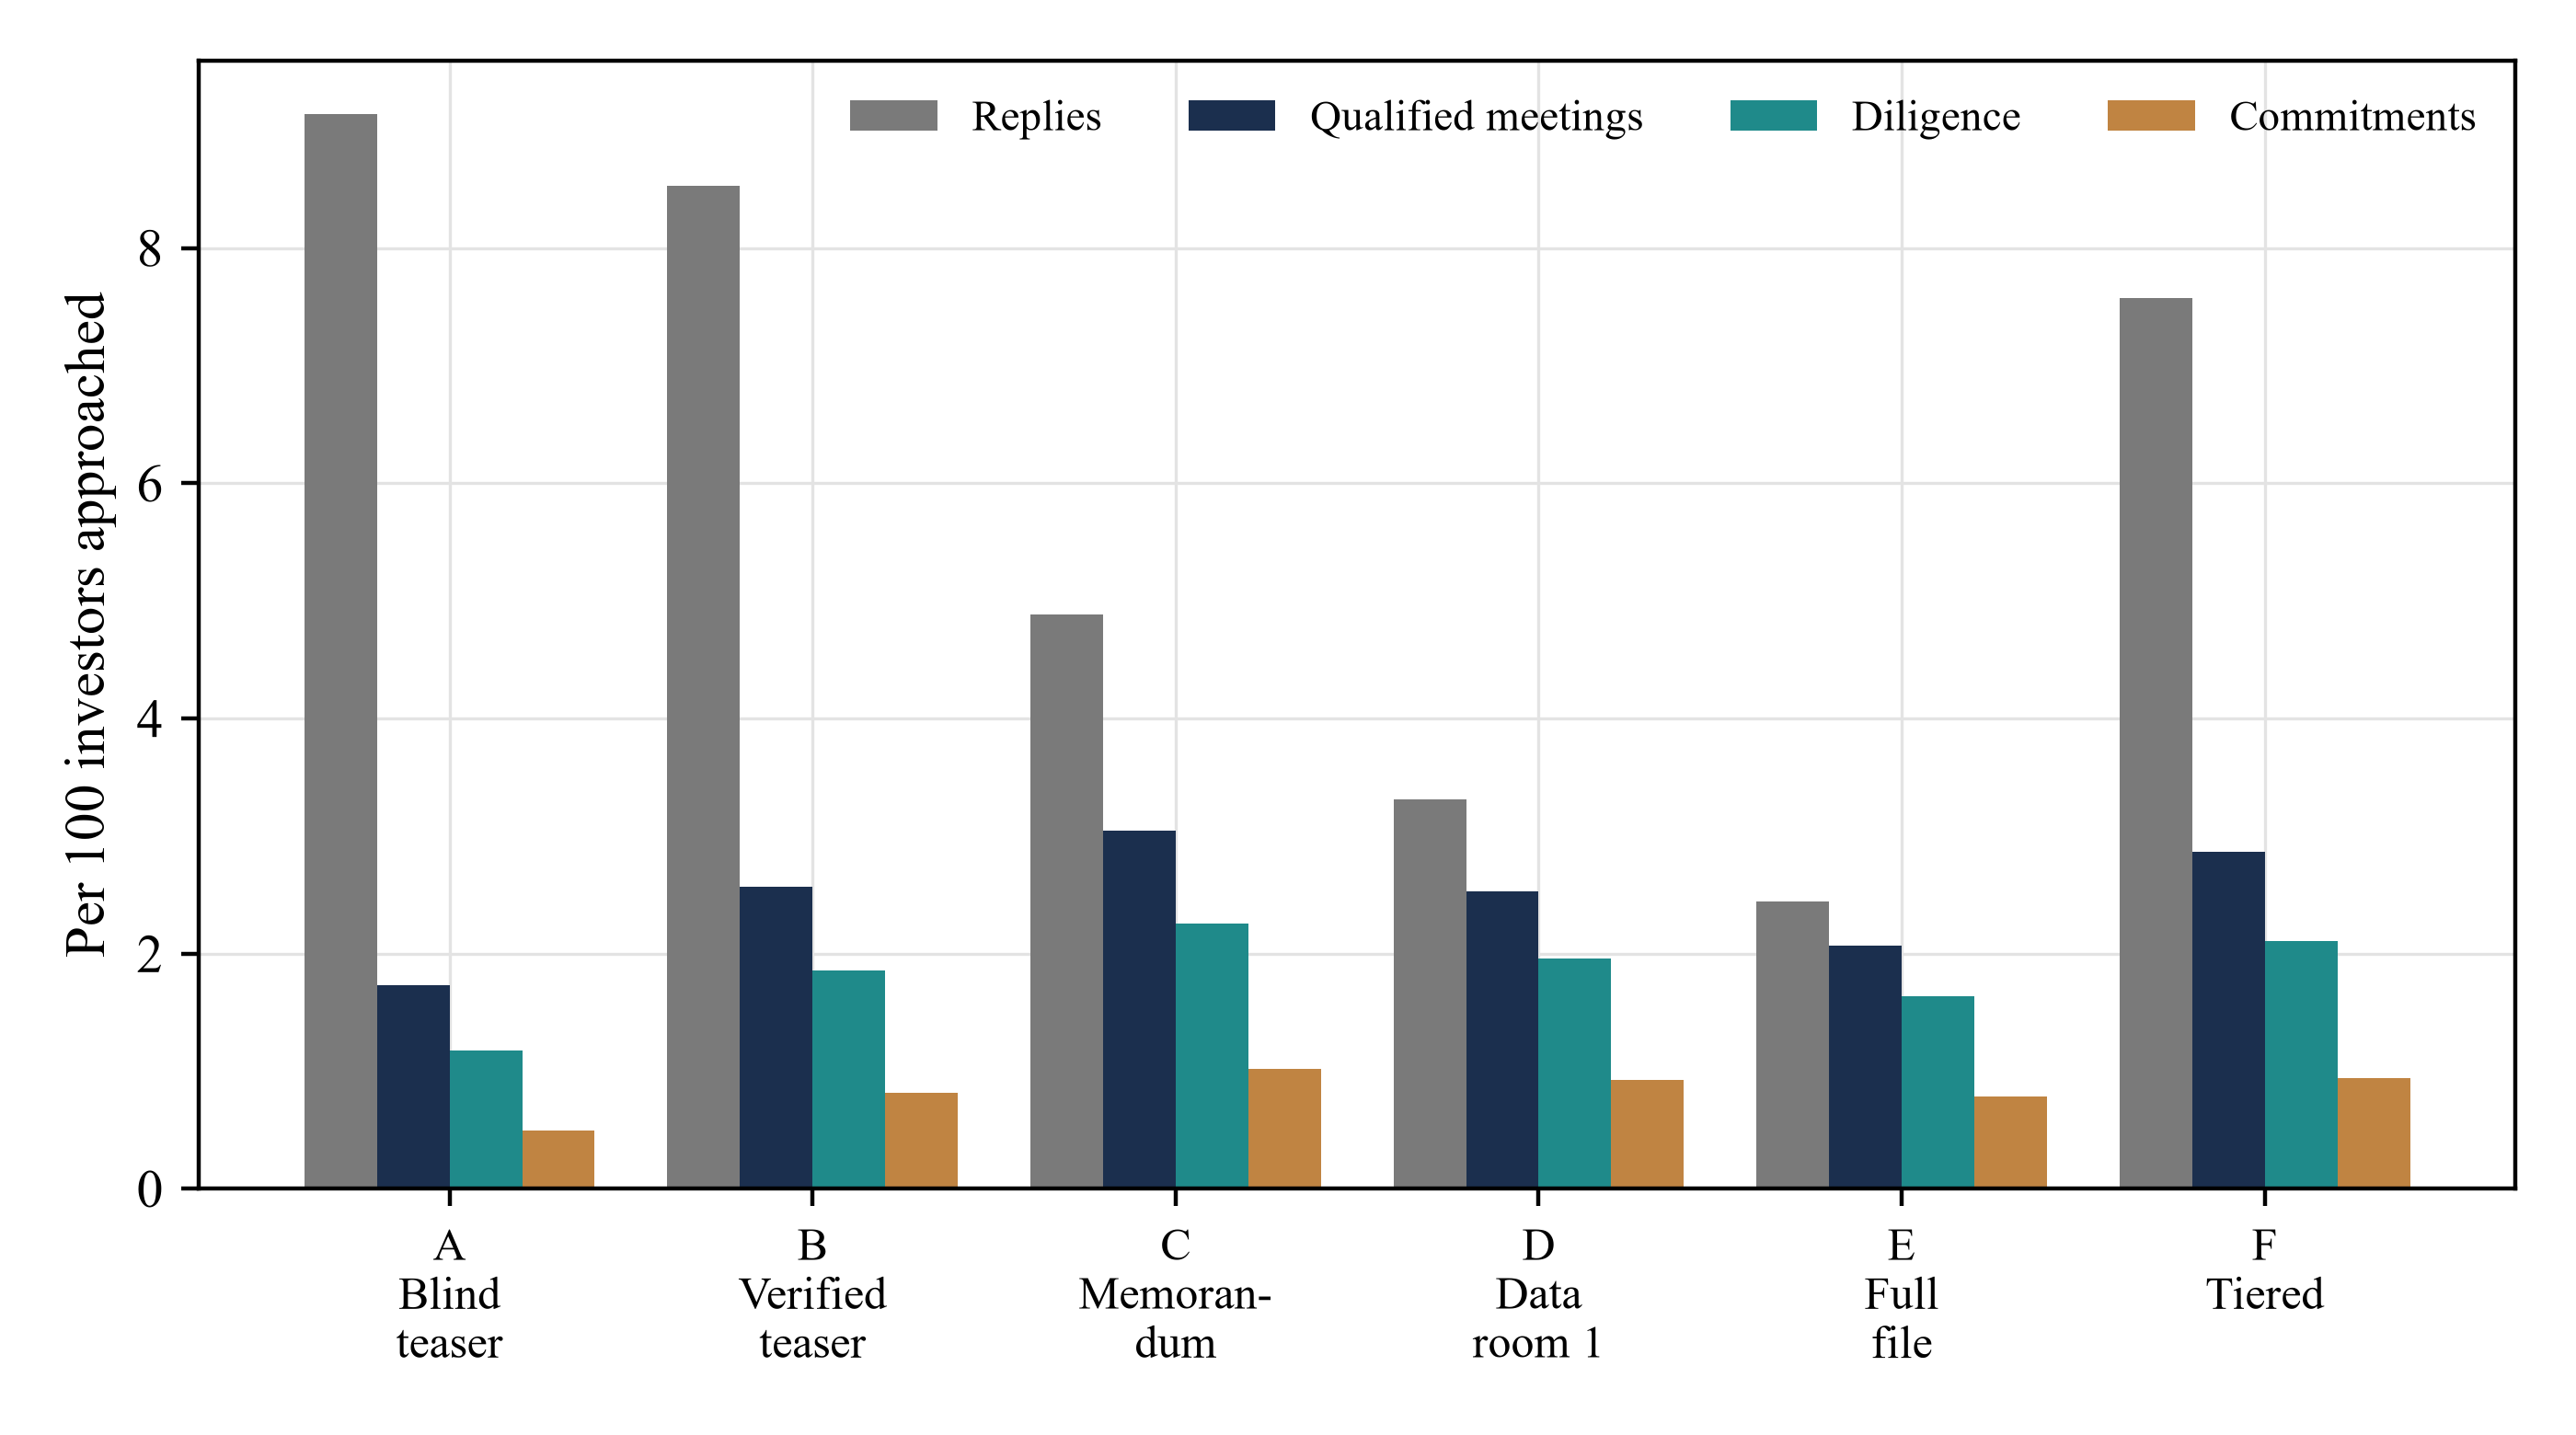
Scroll horizontally to read the figure at full size. You can also open the full-size figure.
MatchPoint analysis of the constructed population. Model output under stated inputs; not an observed result. Per 100 investors approached.
The meetings that occur change in character. For the blind teaser, 31% of meetings are with investors that could never invest, because a non-fit investor has not yet met its disqualifier. For the memorandum the figure is 31% and for the full file 7%. Depth is a screening device: the full file removes nearly all unqualified meetings, but it does so by removing most replies as well. Qualified meetings per 100 are 1.73, 2.57, 3.04, 2.53 and 2.06 for approaches A to E, and rounds from first contact to a qualified meeting fall from 3.00 to 1.00 between the first and third. Beyond the memorandum, reading cost dominates and qualified meetings fall by 32%.
Commitments follow qualified meetings through a further filter for diligence and capacity. Per campaign of 200, mean commitments are 0.98 for the blind teaser, 1.62 for the verified teaser, 2.04 for the memorandum, 1.85 for the first data-room tier, 1.57 for the full file and 1.88 for the tiered approach. The upper benchmark is an oracle in which every investor that can invest meets and decides on the true value without friction, giving 2.96 commitments per 100 investors. The volume-matched random-meeting reference takes the meeting volume of the verified teaser but chooses meetings at random, giving 0.15, as Table 7 shows. The memorandum reaches 34% of this upper benchmark and 6.7 times the random-meeting reference, the verified teaser 27%, the blind teaser 17% and the full file 27%.
| Reference | Qualified meetings | Commitments | Meaning |
|---|---|---|---|
| Ceiling: oracle investor knowledge | 30.23 | 2.96 | Every fit investor meets and decides on true value, with no friction |
| C. Memorandum first | 3.04 | 1.02 | 34% of the ceiling in commitments |
| F. Tiered by fit score | 2.87 | 0.94 | 32% of the ceiling in commitments |
| B. Verified teaser first | 2.57 | 0.81 | 27% of the ceiling in commitments |
| A. Blind teaser first | 1.73 | 0.49 | 17% of the ceiling in commitments |
| E. Full file first | 2.06 | 0.79 | 27% of the ceiling in commitments |
| Volume-matched random-meeting reference at the volume of B | 1.14 | 0.15 | Same meeting volume, chosen without regard to fit or value |
MatchPoint analysis of the constructed population. Per 100 investors; model output under stated inputs; not an observed result.
The distance from the ceiling is not a defect of any approach. It reflects ghosting, the limits of a noisy signal, investors who decline after reading and diligence that does not complete. The choice of depth moves commitments by 107% between the weakest and strongest of the five fixed depths, while the ceiling stands far above all of them. The benchmark gap does not identify whether improving list quality, disclosure depth or another friction would contribute most; those comparisons require separate tests.
13 Expected loss rises with depth several times faster than commitments
Exposure is computed recipient by recipient. Each recipient holds the deepest stage actually delivered, including a recipient who subsequently declines, stops replying or fails a meeting gate. Delivery remains an exposure even when the commercial conversation stops. This delivered-stage maximum sets sensitivity. The sender's total is the sum over all recipients. Equations 2a and 2b give the calculation, and strategic recipients carry a hazard of 3.0% against 0.5% for financial investors at full sensitivity.
Here p_i is the leak probability of recipient i, eta_i its hazard at full sensitivity (0.5% for a financial investor, 3.0% for a strategic one), and pi_i the protection that applies: zero for the two teaser stages, 75% where the memorandum or later stage follows a signed agreement, and 35% where the file was sent with the first approach under click-through terms. S is the sensitivity of the deepest stage held, delta_i the loss given leak at full sensitivity (4% of deal value for a financial investor and 15% for a strategic one), and V the deal value. The constant 0.2 gives even a light teaser a small hazard. All of these are stated inputs.
Expected loss per campaign is USD 0.15 million for the blind teaser, 0.54 for the verified teaser, 1.87 for the memorandum, 5.10 for the first data-room tier and 10.93 for the full file. The full file loses 5.8 times as much as the memorandum, and the memorandum loses 3.5 times as much as the verified teaser. Expected loss per commitment is USD 0.33 million at the verified teaser, 0.92 million at the memorandum and 6.94 million at the full file. The tiered approach loses 50% less than the memorandum for 8% fewer commitments.
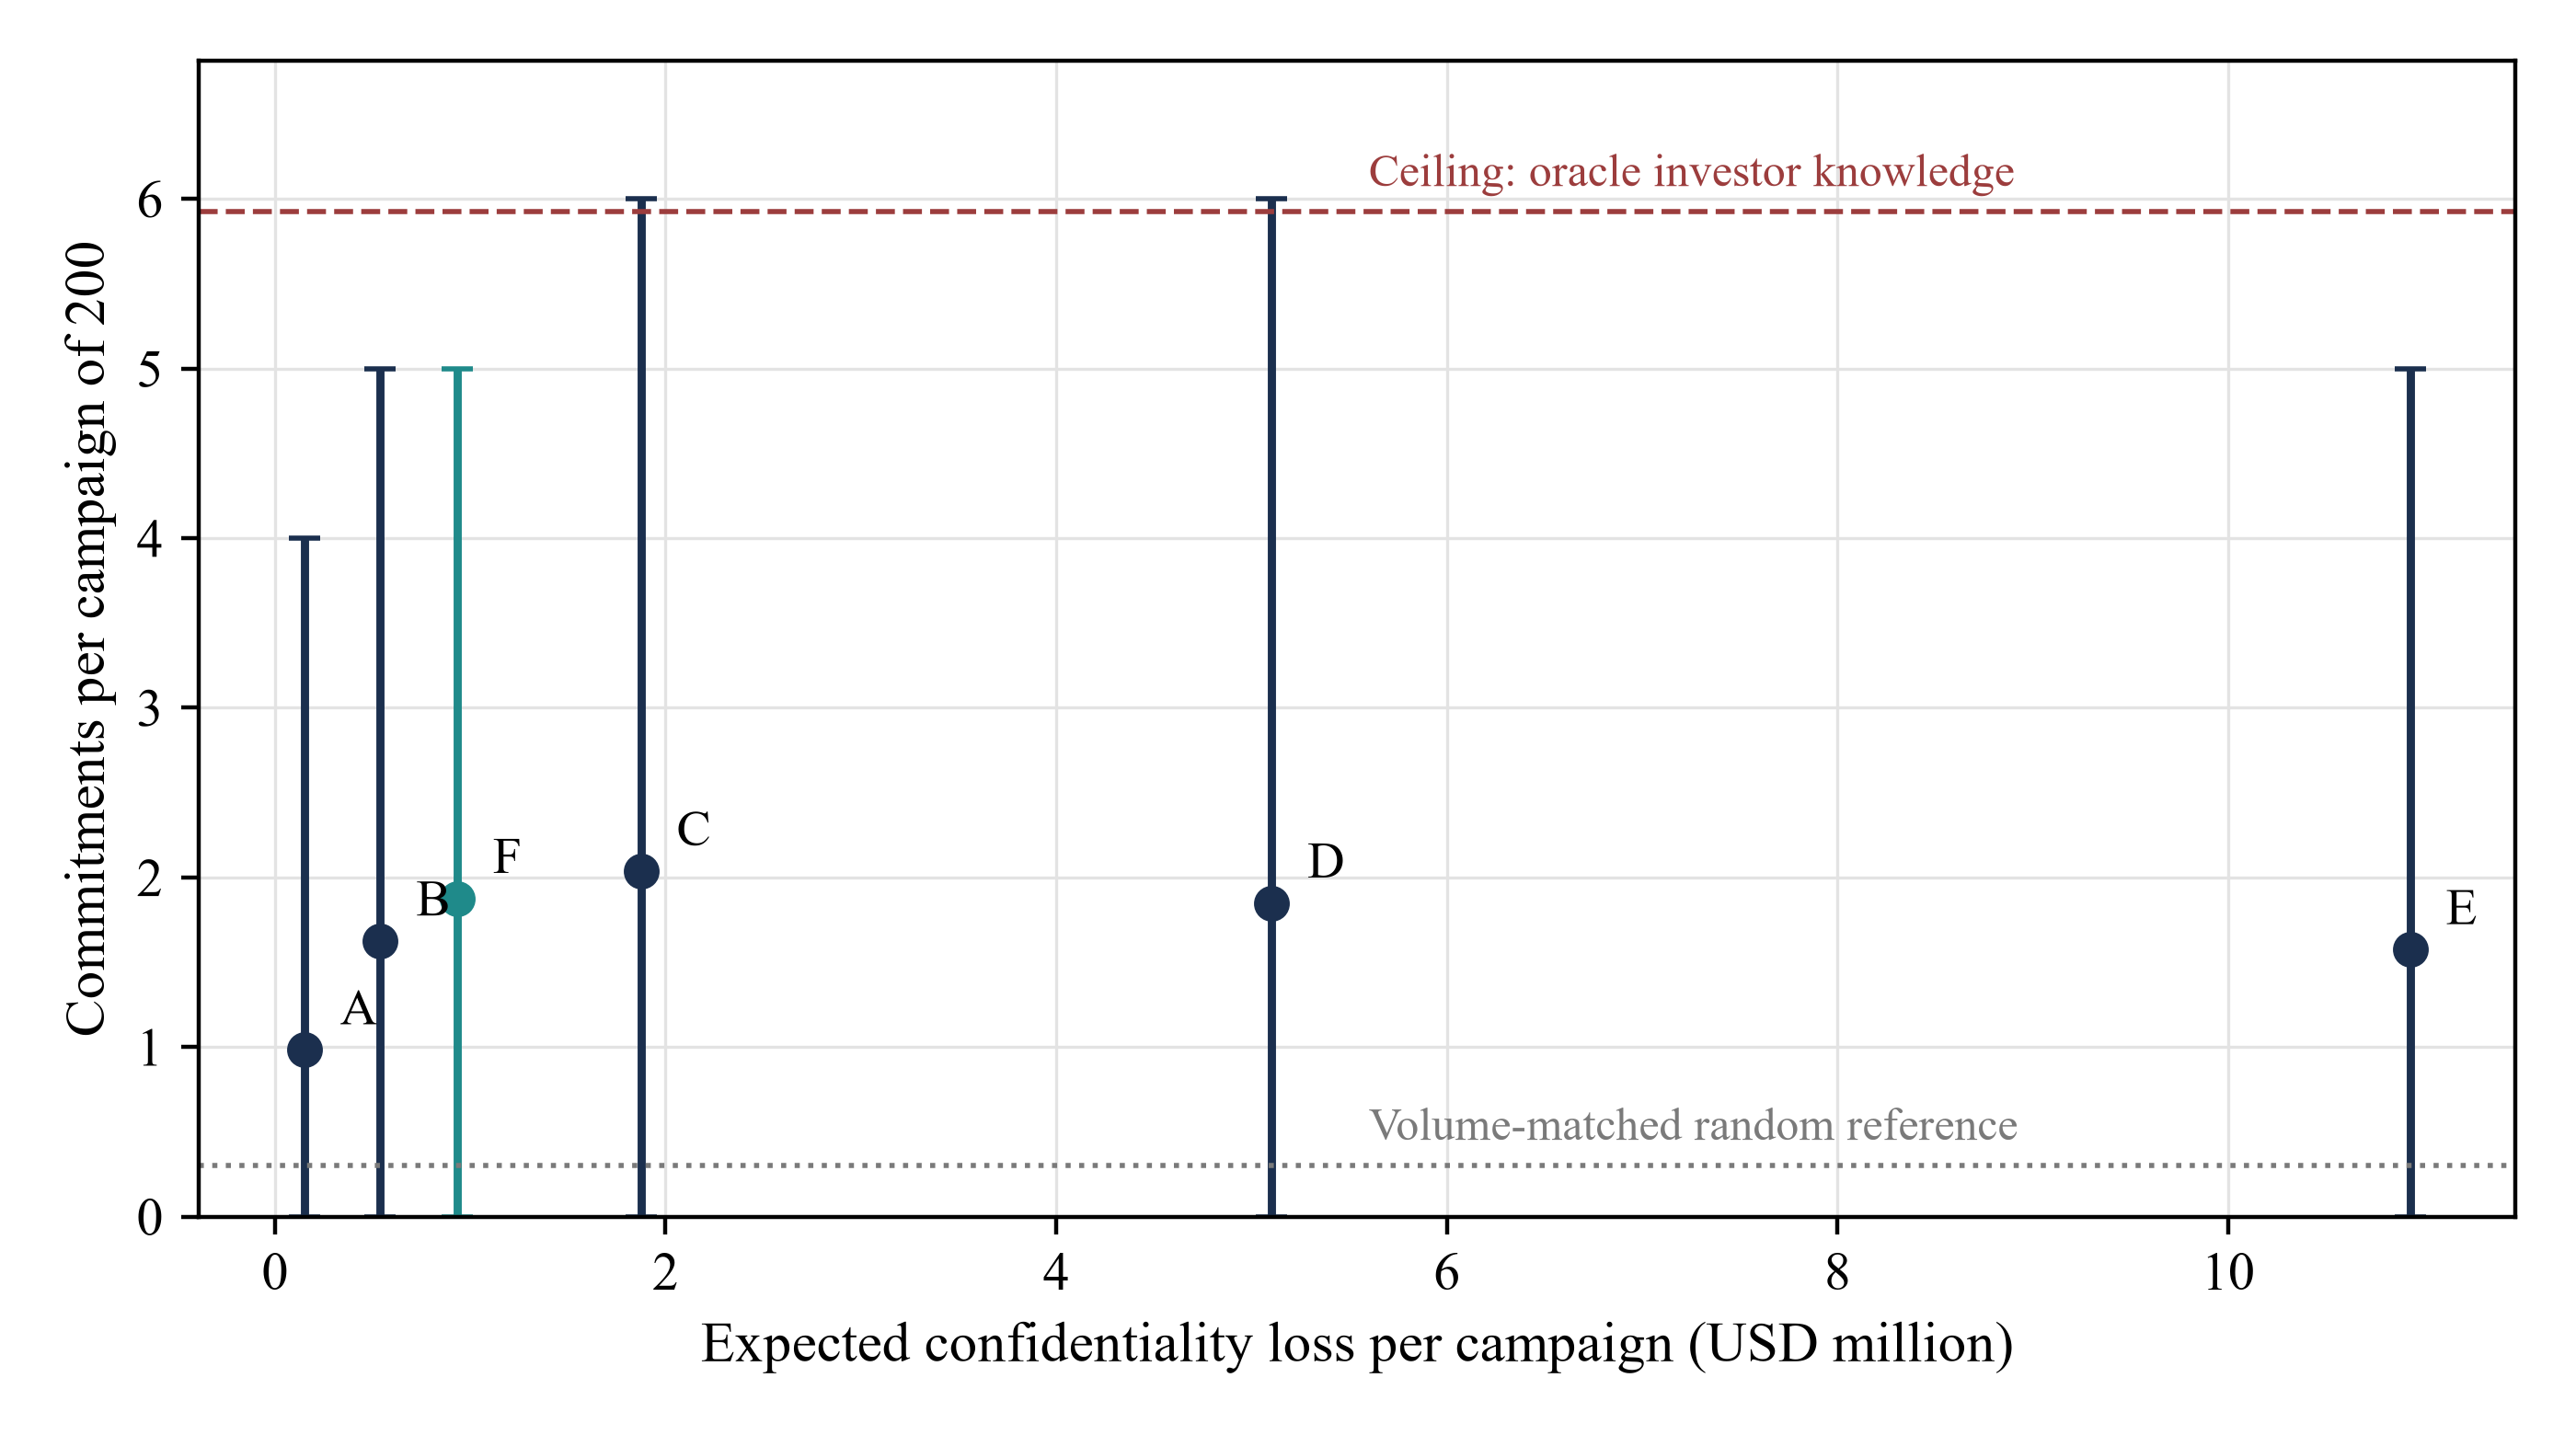
Scroll horizontally to read the figure at full size. You can also open the full-size figure.
MatchPoint analysis of the constructed population. Model output under stated inputs; not an observed result. Points are means of the replications; bars are the 5th to 95th percentile of commitments.
| Approach | Commitments per campaign | 5th to 95th | Expected loss USD m | 95th percentile conditional expected loss | Rounds to meeting | Net value USD m |
|---|---|---|---|---|---|---|
| A. Blind teaser first | 0.98 | 0.0 to 4.0 | 0.15 | 0.30 | 3.00 | 2.92 |
| B. Verified teaser first | 1.62 | 0.0 to 5.0 | 0.54 | 0.74 | 2.00 | 4.67 |
| C. Memorandum first | 2.04 | 0.0 to 6.0 | 1.87 | 2.28 | 1.00 | 4.74 |
| D. Data room tier 1 first | 1.85 | 0.0 to 6.0 | 5.10 | 6.19 | 1.00 | 0.98 |
| E. Full file first | 1.57 | 0.0 to 5.0 | 10.93 | 13.22 | 1.00 | -5.60 |
| F. Tiered by fit score | 1.88 | 0.0 to 5.0 | 0.93 | 1.20 | 1.34 | 5.20 |
MatchPoint analysis of the constructed population. USD million. Net value is benefit of completion, discounted for delay, less expected loss. Model output under stated inputs; not an observed result. The loss percentile describes the distribution of conditional expected campaign loss across simulated campaigns; it is not a realised-loss tail percentile.
Figure 3 shows a frontier in which the first steps from blind to verified material are cheap in exposure and the later steps are not. Moving from the blind teaser to the verified teaser adds USD 0.39 million of expected loss and raises commitments by 65%. Moving from the memorandum to the full file adds USD 9.06 million of expected loss and removes commitments. The full file first is dominated: it has more exposure and fewer commitments than the memorandum.
14 Net value favours a staged or tiered start, and the full file first has negative expected value
Response and exposure are put on one scale by a net value. A campaign earns the benefit of completing the round, discounted by 5% using each campaign's mean rounds to qualified meetings, if it secures 2 or more commitments, and it bears the expected loss. Equation 3a gives the net value of approach a, and equation 3b gives the benefit at which approach a overtakes approach b.
Here B is the benefit of completing the round, C_a is campaign commitments, K* is the required number, d is the delay discount and r_a is the within-campaign mean number of rounds among qualified meetings. A_a averages the discounted completion indicator jointly across campaigns; multiplying the completion frequency by a discount evaluated at an unconditional mean would generally give a different answer. Expected loss follows equation 2b. When A_a exceeds A_b, approach a is preferred above the stated crossing benefit; when it is smaller, the inequality reverses. Equal A values leave expected loss to determine the comparison. The exact linear memorandum-versus-blind-teaser crossing is approximately USD 7.30 million under these inputs. The USD 0.25 million scan first identifies a winning point at USD 7.50 million. Neither figure is an observed market threshold. When a campaign has no qualified meeting, its completion indicator and discounted completion contribution are both zero; this convention avoids assigning an economic meaning to its undefined mean meeting-round count.
Net value per campaign is USD 5.20 million for the tiered approach, 4.74 for the memorandum, 4.67 for the verified teaser, 2.92 for the blind teaser, 0.98 for the first data-room tier and -5.60 for the full file. The three leading approaches lie within USD 0.53 million of each other, but the 5th to 95th percentile band of net value for the memorandum runs from USD -2.2 million to USD 12.7 million, and for the tiered approach from -1.1 to 13.3. The reported means rank these approaches under the chosen inputs. Predictive percentile bands describe variability across simulated campaigns and do not test differences in expected values; the mean ranking supplies no empirical ranking for a real raise. The clear findings are that the first data-room tier has lower mean net value than the leading approaches in the base case, and the full file first has negative mean net value in every evaluated base and stress case.
Whichever leader is chosen, the first message should contain verified headline figures and should not contain the sensitive items of Table 2. Tiering by fit can add value only to the extent that the fit score is informative, which the model does not vary. The full file first has a negative expected net value of USD -5.60 million, and in 33% of campaigns it produces no commitment at all.
15 Stress cases show conditional patterns to investigate
Four authored stress cases alter selected assumptions, with other inputs fixed. The first triples the leak hazard and doubles the strategic share of recipients. The second halves the credibility of verification, so that stated figures carry less weight. The third multiplies reading load by 2.5, which stands for investors with scarce attention. The fourth weakens the confidentiality agreement, cutting protection to 25% for a signed agreement and 10% for click-through. Table 9 and Figure 4 report the resulting simulated patterns and net values. Their construction separates these mechanisms by assumption; real-world diagnosis would require measured exposures and alternative explanations.
| Case | Replies, B | Qualified meetings, B | Commitments per qualified meeting, B | Loss C USD m | Loss E USD m | Best net value |
|---|---|---|---|---|---|---|
| Base | 8.53 | 2.57 | 0.317 | 1.87 | 10.93 | F. Tiered by fit score |
| Hazard tripled, strategic share doubled | 8.53 | 2.57 | 0.317 | 9.89 | 57.79 | B. Verified teaser first |
| Verification half as credible | 6.37 | 1.93 | 0.295 | 1.86 | 10.93 | F. Tiered by fit score |
| Investor attention scarce (reading load x2.5) | 6.15 | 1.89 | 0.333 | 1.87 | 10.93 | F. Tiered by fit score |
| NDA protection weak | 8.53 | 2.57 | 0.317 | 2.72 | 15.14 | F. Tiered by fit score |
MatchPoint analysis of the constructed population. Per 100 investors for replies and meetings; USD million per campaign for loss. Model output under stated inputs; not an observed result.
The hazard stress leaves every response measure unchanged and multiplies loss: expected loss for the memorandum rises from USD 1.87 million to USD 9.89 million and for the full file from USD 10.93 million to USD 57.79 million. Response data would never show this change. The verified teaser has the highest mean net value in this stress, USD 2.38 million, followed by USD 2.30 million for the blind teaser and USD -3.28 million for the memorandum. These are constructed means; their ranking is not a statistically established market result. The weak-agreement stress leaves response unchanged and raises expected loss wherever recipients hold material under a weakened gate, including teaser-first recipients who subsequently receive the memorandum.
The verification stress and the attention stress both reduce replies for the verified teaser, from 8.53 to 6.37 and 6.15 respectively, and both reduce qualified meetings. They are separated by the quality of the meetings that remain. When verification is less credible, commitments per qualified meeting fall from 0.317 to 0.295, because the investor decides on a weaker signal. When attention is scarce they rise to 0.333, because only the investors with the strongest signal pay the reading cost. In this model, meeting quality moves differently under the two shocks. Those movements are candidate diagnostics for investigation and do not identify the cause of lower replies in an actual campaign.
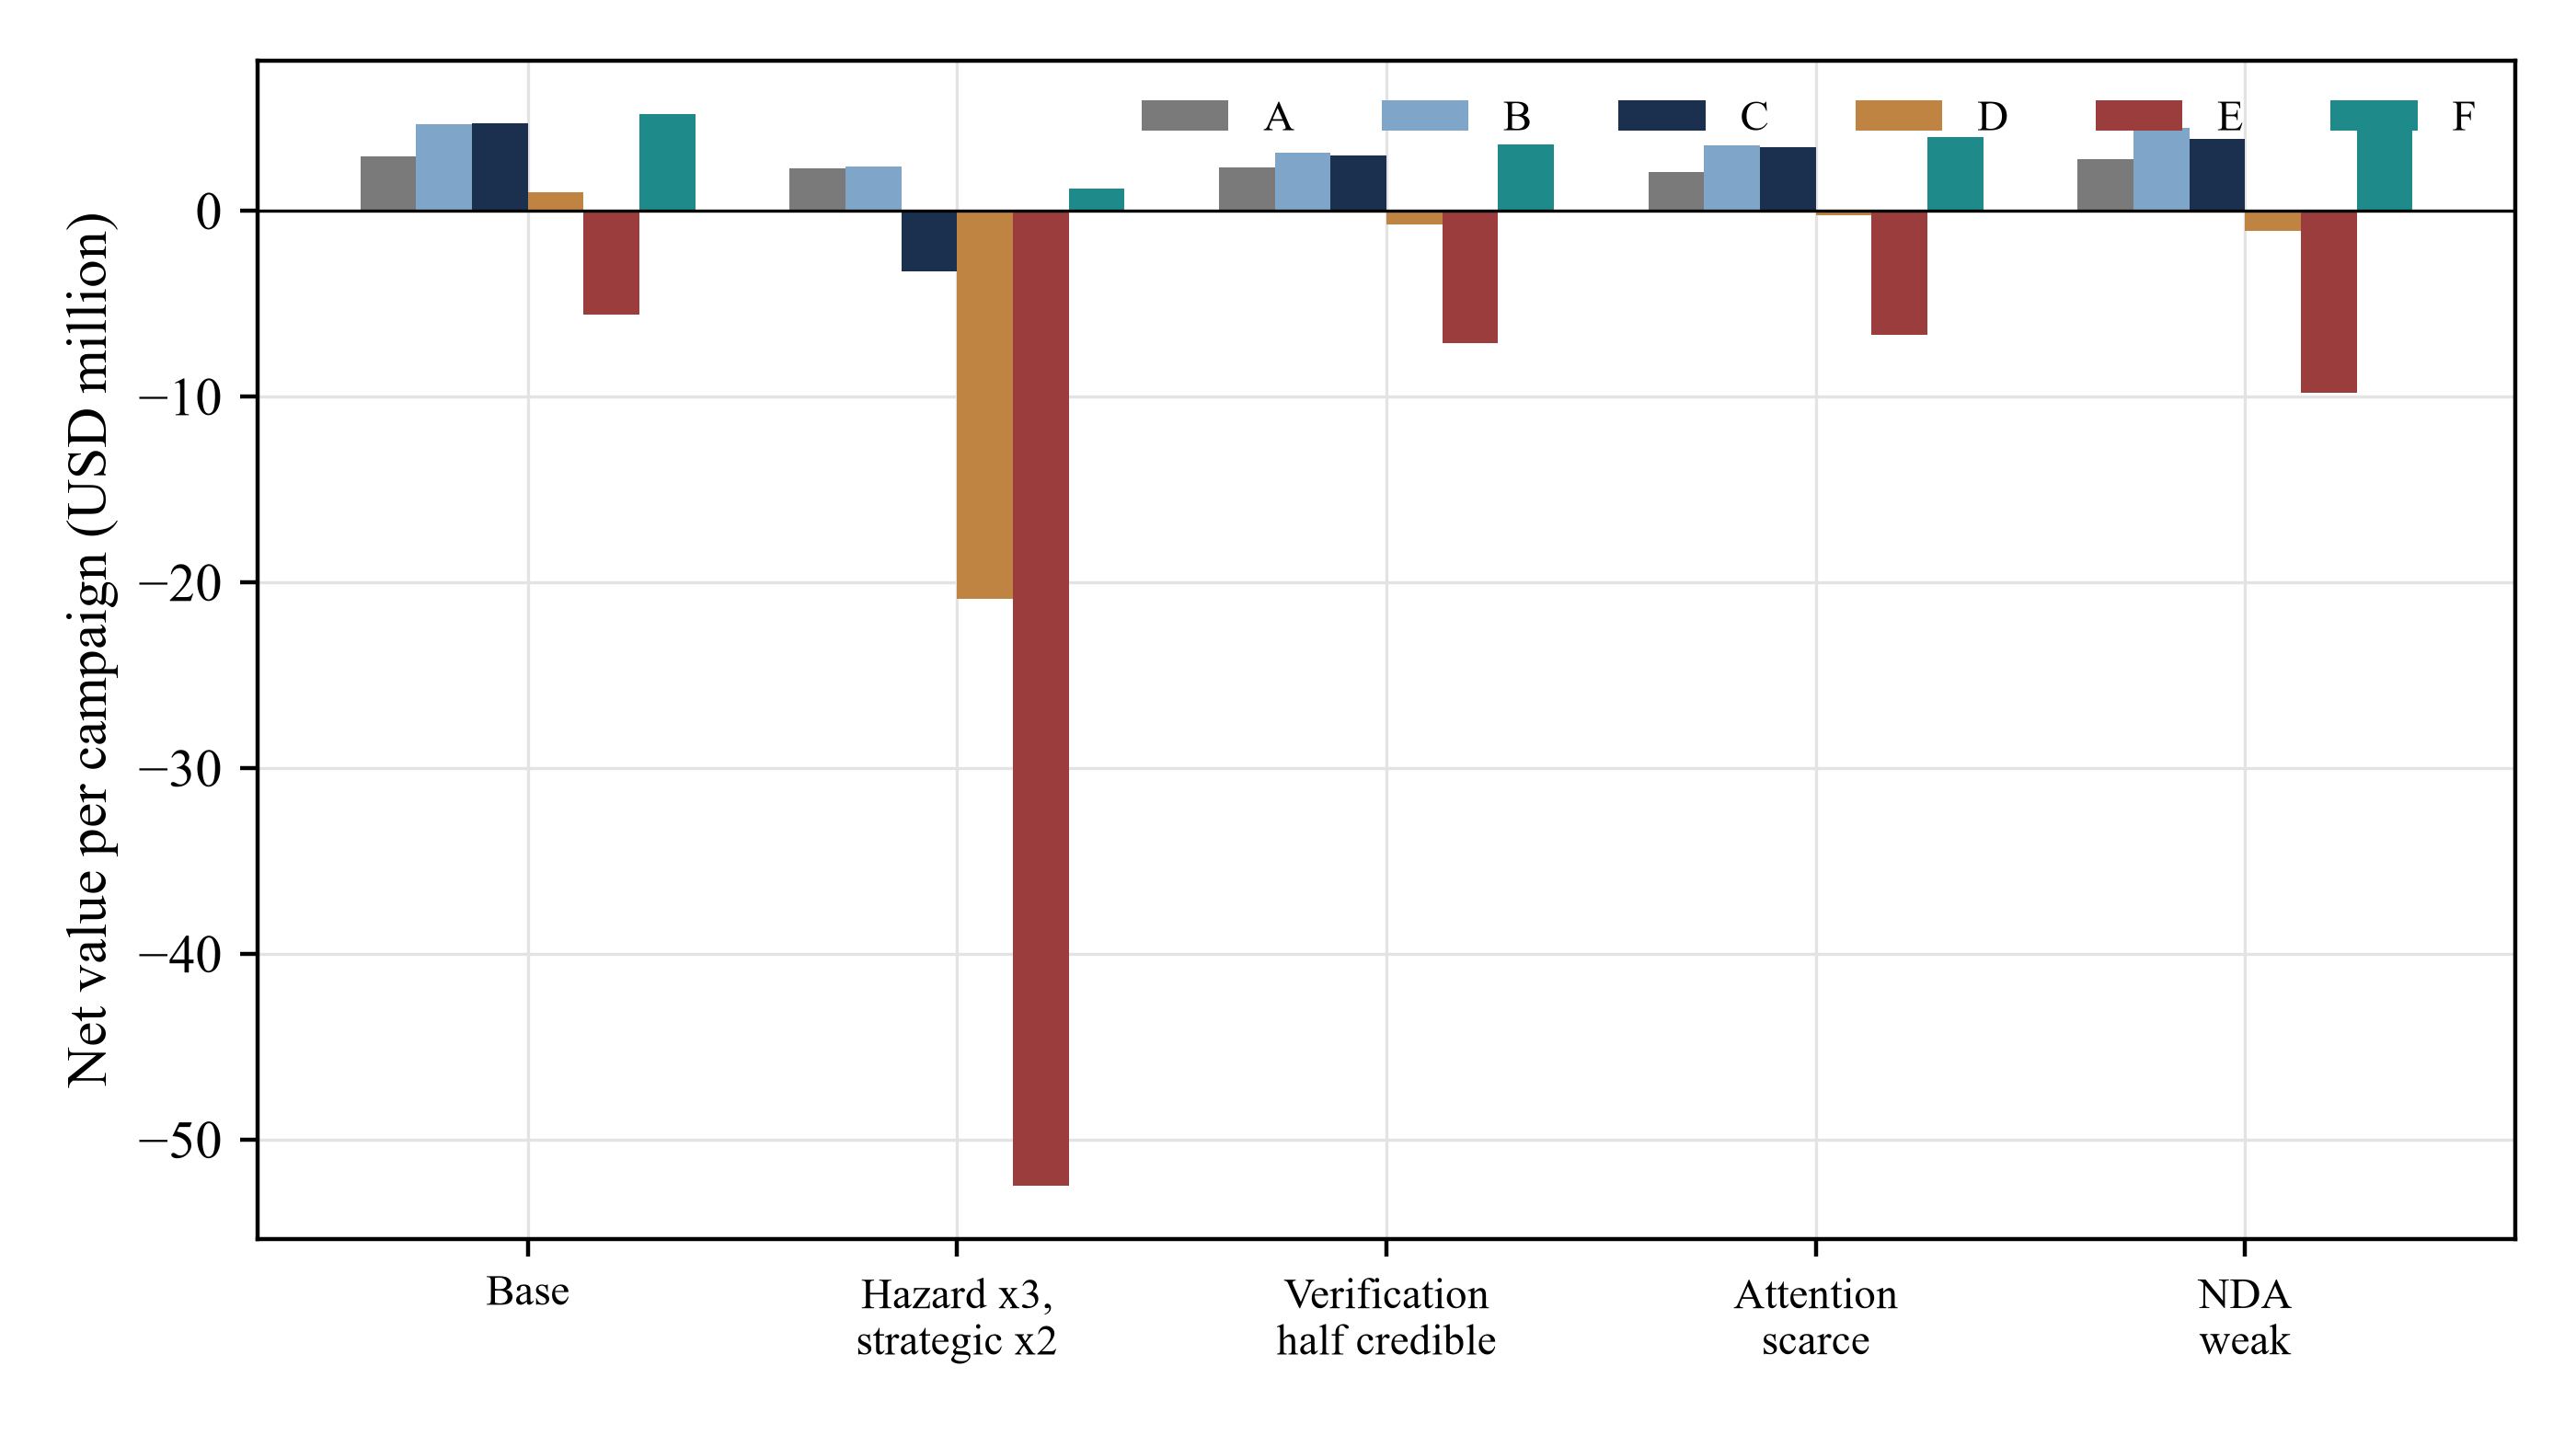
Scroll horizontally to read the figure at full size. You can also open the full-size figure.
MatchPoint analysis of the constructed population. USD million per campaign. Model output under stated inputs; not an observed result. Letters A to F as in Table 6.
In all four stresses the tiered approach or the verified teaser has the highest mean net value, and the full file first is negative in every evaluated case. The hazard stress changes the highest-mean approach from the tiered approach to the verified teaser. A sender who believes its recipients are strategic or its leak hazard high should keep the first message at a teaser and accept the response cost shown in Table 6. A weak agreement changes some pairwise mean rankings while the tiered approach retains the highest mean in that stress.
16 The depth that maximises value moves with leak hazard and with the worth of completing the round
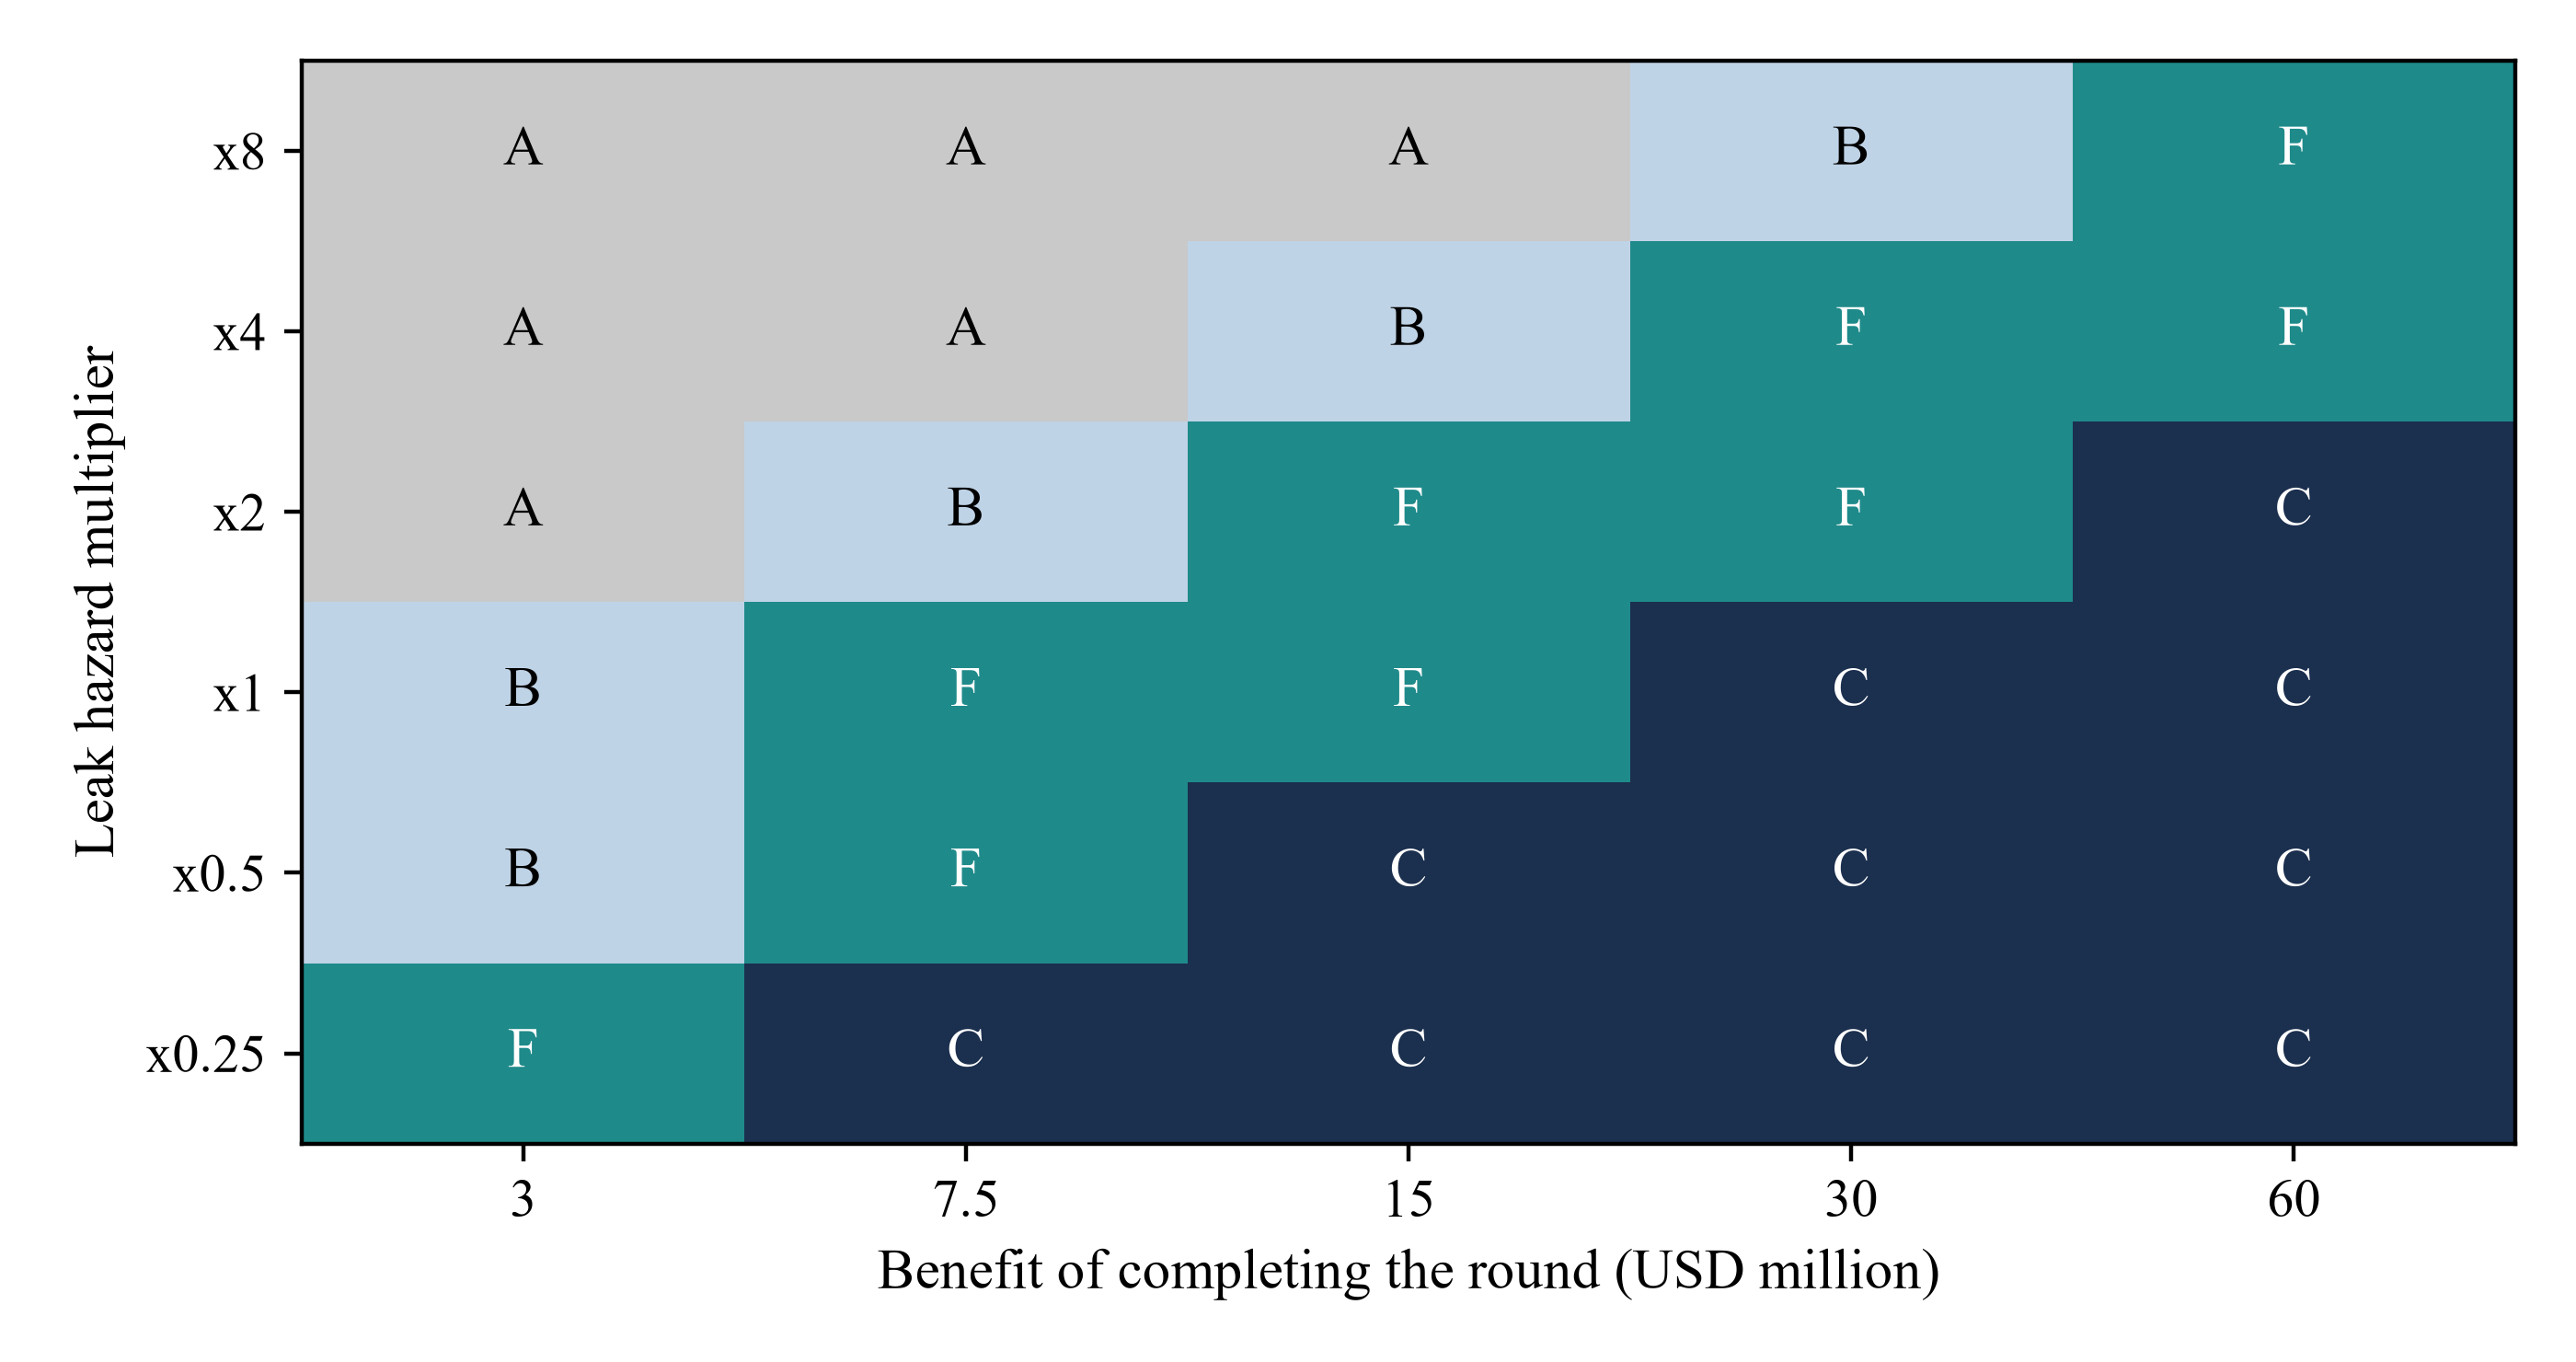
Figure 5 maps the approach with the highest net value across 30 combinations of leak hazard, from a quarter to eight times the base, and the benefit of completing the round, from USD 3 million to USD 60 million. The blind teaser is best in 6 cells, the verified teaser in 5, the memorandum in 10 and the tiered approach in 9. The first data-room tier and the full file are best in none. The base case, at the standard hazard and a benefit of USD 15 million, is won by approach F.
Scroll horizontally to read the figure at full size. You can also open the full-size figure.
MatchPoint analysis of the constructed population. Each cell shows the approach with the highest net value; letters as in Table 6. Model output under stated inputs; not an observed result.
The map shows the shape of the decision. Where the hazard is high and the benefit small, the blind teaser wins; where the hazard is low and the benefit large, the memorandum wins; where both are large, the tiered approach wins, because it concentrates depth where response is likely. A sender can locate itself on the map by asking two questions: how harmful would a leak of the full file be, and how much is completing the round worth. Neither answer comes from outreach data, so both must be stated and challenged before the campaign.
The map also shows what does not change. The deepest approaches are never best, even at the lowest hazard and the highest benefit, because the response penalty of a heavy first message is paid on every recipient while the benefit accrues only to the few who would have replied to a lighter one. That conclusion depends on the reading-cost input. The attention stress in Section 15 tests only a heavier load, which strengthens it; a lighter load was not tested, and the conclusion could reverse for an investor population that always reads everything, such as a handful of lenders running a formal process, which the experiment does not model.
17 Selection bias makes depth look far more valuable on a real list than it is
In a real outreach record, depth is not assigned at random. A sender gives the information memorandum to contacts it knows well, and the verified teaser to everyone else. Warm contacts are more likely to be able to invest, more willing to read and more favourable to the deal. A comparison of the two groups then attributes to depth a difference that belongs to warmth. This is selection into treatment; the question is its size and how much a standard correction repairs.
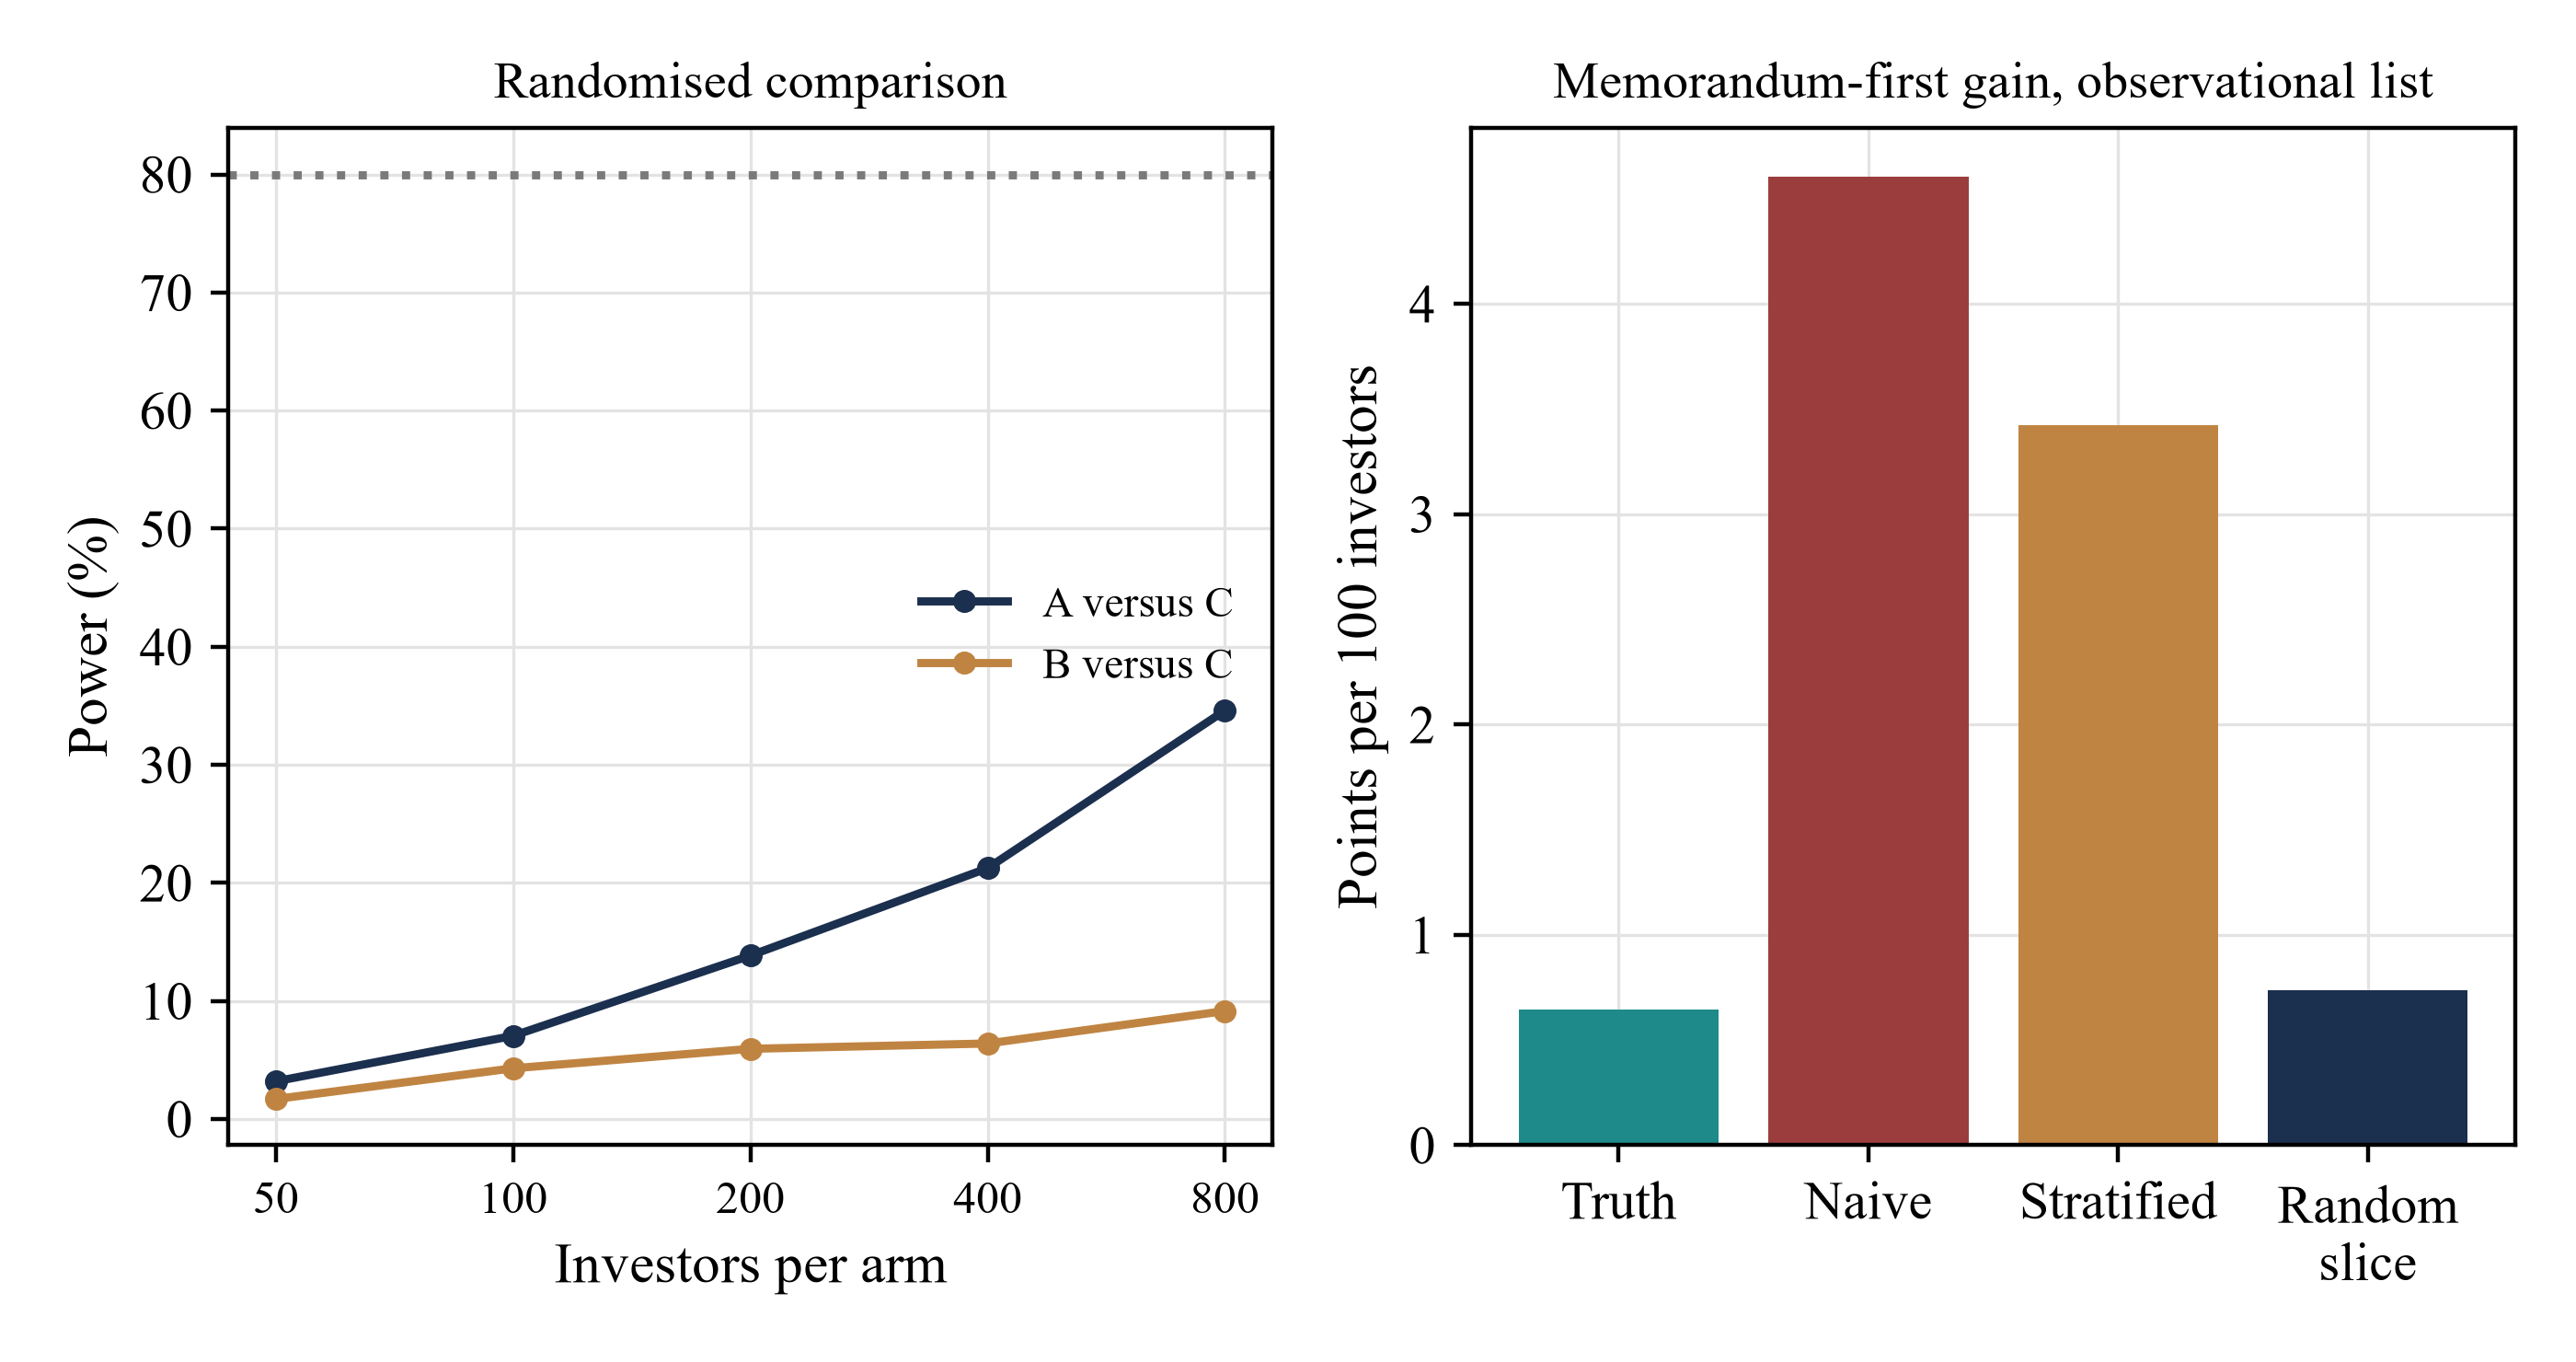
The model creates a list in which a latent warmth measure raises the chance of fit, the investor's valuation and willingness to read. The sender assigns the memorandum to 33% of the list, chosen by warmth with noise, and as a result 39% of the memorandum group could invest against 25% of the others. Because the model computes both outcomes for every investor, the true gain from the memorandum over the verified teaser is known: 0.65 qualified meetings per 100. Table 10 compares estimators.
| Estimator | Gain from memorandum first, qualified meetings per 100 | Comment |
|---|---|---|
| Truth: both outcomes for every investor | 0.65 | Known only because the model computes both outcomes |
| Naive: warm contacts receive the file | 4.60 | Overstates the truth by 613% |
| Stratified on a noisy warmth record | 3.42 | Repairs 30% of the bias |
| Randomised slice of the same list | 0.74 | Unbiased; noisy at small sample size |
MatchPoint analysis of the constructed population of 400 campaigns of 400 investors. Model output under stated inputs; not an observed result. Warmth is recorded with noise.
In the equations, Y is the qualified-meeting indicator, the bars denote group means, g indexes quintiles of the recorded warmth proxy and n_g is the number of investors in quintile g. The naive estimate is 4.60 per 100, which overstates the truth by 613%. Stratifying on a noisy warmth record gives 3.42, which reduces only 30% of the constructed bias, because the record captures warmth imperfectly and warmth acts through fit as well as through willingness. A randomised slice of the same list gives 0.74, close to the truth, but with a wide interval at the sample sizes a single sender has. Randomisation within the specified study supplies a design-based estimate under its assignment and measurement assumptions, as Section 20 specifies.
18 Small campaigns give imprecise estimates of depth effects and leakage
A randomised comparison of two approaches on one list faces two limits, and Table 11 shows both. The gap in qualified meetings between the blind teaser and the memorandum is 1.31 per 100 investors, and between the verified teaser and the memorandum it is 0.48. With 200 investors in each arm, the power to detect the first gap at the 5% level is 14% and for the second 6%. With 800 per arm the power rises only to 35% and 9%. The 5th to 95th percentile of the estimated gap at 200 per arm runs from -2.0 to 3.5 points for the second comparison, so the sign of the estimate is unreliable.
| Comparison | Investors per arm | True gap, points | Mean estimate | 5th to 95th | Power | Wrong sign, significant |
|---|---|---|---|---|---|---|
| A versus C | 50 | 1.31 | 1.30 | -4.00 to 6.00 | 3% | 0.2% |
| A versus C | 100 | 1.31 | 1.25 | -2.00 to 5.00 | 7% | 0.3% |
| A versus C | 200 | 1.31 | 1.27 | -1.00 to 4.50 | 14% | 0.5% |
| A versus C | 400 | 1.31 | 1.32 | -0.50 to 4.00 | 21% | 0.1% |
| A versus C | 800 | 1.31 | 1.21 | -0.25 to 3.25 | 35% | 0.2% |
| B versus C | 50 | 0.48 | 0.42 | -4.00 to 6.00 | 2% | 0.7% |
| B versus C | 100 | 0.48 | 0.41 | -3.00 to 4.00 | 4% | 1.1% |
| B versus C | 200 | 0.48 | 0.44 | -2.00 to 3.50 | 6% | 1.2% |
| B versus C | 400 | 0.48 | 0.45 | -1.50 to 2.50 | 6% | 1.1% |
| B versus C | 800 | 0.48 | 0.47 | -0.87 to 2.00 | 9% | 0.7% |
MatchPoint analysis of 2,000 simulated studies per row; both arms of each study concern the same deal. Gaps in points of qualified-meeting rate per 100. Model output under stated inputs; not an observed result.
Equation 5b approximates the investors required per arm under independent-binomial planning assumptions, where p_0 and p_1 are the qualified-meeting rates of the two approaches, and the z terms are the normal quantiles for the chosen significance level alpha and power 1 minus beta. At a nominal planning target of 80% power, the approximation gives 2,127 investors per arm to separate the blind teaser from the memorandum, and 18,788 per arm to separate the verified teaser from the memorandum. These counts exceed the size of the constructed campaign. Pooling suitably comparable campaigns under a common protocol is one research design for increasing precision; the calculation does not establish the size of any sender's real investor list.
Leaks are harder still. Equation 5a gives the probability of zero actual leak events among n independent recipients with equal leak probability eta and complete event detection. At a hazard of 0.5% per recipient, a campaign of 200 shows no leak with probability 37%, and even 1,000 recipients show none with probability 0.7%. In the model, a campaign with the verified teaser shows no material leak in 98% of replications, the memorandum 59% and the full file 33%, yet their expected losses differ by a factor of several, as Table 12 shows.
| Approach | Material leaks per campaign | Campaigns with zero simulated material leaks | Expected loss USD m |
|---|---|---|---|
| B. Verified teaser first | 0.01 | 98% | 0.54 |
| C. Memorandum first | 0.52 | 59% | 1.87 |
| E. Full file first | 1.10 | 33% | 10.93 |
MatchPoint analysis of the constructed population. A material leak is a simulated event from a recipient holding the memorandum or deeper. The experiment generates events directly and includes no separate reporting or detection model. Model output under stated inputs; not an observed result.
Scroll horizontally to read the figure at full size. You can also open the full-size figure.
MatchPoint analysis of the constructed population. Left, power by arm size; right, estimates of the gain from the memorandum on a list with selection. Model output under stated inputs; not an observed result.
A small campaign may provide little precision about the preferred depth or protection. Under a specified independent-event model with reliable detection, a monitored zero-event period is informative and narrows the likelihood for the hazard. Unreported or undetected events require a separate detection assumption. The sender should combine those observations with recipient counts, document sensitivity and the contractual gates in Table 1 while retaining the uncertainty that remains.
19 The controls pass, and they establish internal consistency only
The model asserts 75 identities and boundary conditions before writing its results. They include the nesting of the funnel, the exact split of meetings into qualified and unqualified, the monotonic rise of exposure with depth, zero loss when hazard is zero or protection is complete, an independent recomputation of loss one recipient at a time, a regression check that the stage signal weight at each stage matches the value that the equations imply, and a reproduction of the base result from the seed. Table 13 lists the principal controls.
| Control | Result |
|---|---|
| Assertions executed by model.py | 75 passed |
| Marginal signal weight against regression of value on signal | Within 0.03 at all five stages |
| Funnel nesting: commitments within diligence within qualified meetings within meetings within replies | Holds for all six approaches in all replications |
| Meetings split exactly into qualified and unqualified | Holds |
| Exposure rises with first-approach depth | Holds for sensitivity-weighted exposure and expected loss |
| Full file first exposes every recipient at full sensitivity | Sensitivity index of 100 per 100 investors |
| Zero hazard and full protection each give zero loss | Both exact |
| Loss recomputed one recipient at a time for one campaign | Agrees to 1e-9 |
| Seed reproduces the base result | Exact |
| Oracle benchmark at or above all six approaches; random reference at or below B | Holds |
| Two-arm test, same approach in both arms, 200 per arm | Rejects in 4.2% of studies at the 5% level |
| Replications; investors per campaign; seed | 1,000; 200; 1379 |
MatchPoint analysis. Model output under stated inputs; not an observed result.
The controls show that the code does what the equations say. They do not show that the equations describe investors. The central circularity should be stated plainly: outcomes in the model are generated from the same relationships that the framework assumes, namely that a sharper signal improves decisions, that reading cost reduces replies and that sensitivity raises exposure. The experiment therefore shows how disclosure depth behaves when those relationships hold. It does not show that they hold, and it cannot tell a sender which of them dominates in a given market.
The same limit applies to the magnitudes. The reply hurdle, hazard, loss given leak and protection factors were chosen for plausible orders of magnitude, with no source. Across the finite base and stress cases evaluated here, qualified-meeting rates peak at an intermediate depth, exposure rises monotonically and the full file first is dominated. The position of the peak, and the ranking of the three leading approaches, depend on inputs that should be replaced with measurements.
20 A consented and timestamped study would replace the assumptions with measurements
The study that would settle the question is feasible for a sender or an adviser that runs many campaigns. Its unit is the recipient within a campaign. Each recipient is on a list built for a stated purpose with a lawful basis for contact and a recorded objection mechanism, and each message and response carries a timestamp. The main outcomes are defined before the study, as in Section 2: reply, qualified meeting, progression to diligence, signed commitment and the time to each. Exposure outcomes are recorded as access logs, watermark traces and any reported incident, with the stage and agreement type at which each recipient held the material.
The central design feature is a randomised slice within a pre-specified eligible population. Recipients above a stated fit-score threshold are assigned to permitted disclosure depths independently of warmth. Under the assignment and measurement assumptions, this identifies an effect for those eligible recipients. Generalising to a broader judgement-managed list requires a supported transport assumption or known positive inclusion probabilities and appropriate weights; the study cannot infer effects for never-eligible recipients from randomisation alone. A pooled design should stratify assignment and analysis by campaign and account for heterogeneous deal characteristics. Equation 5b is an independent-binomial planning approximation using marginal model rates; it does not establish 80% power for a campaign-clustered pooled study. Table 14 sets out the proposed records.
| Element | Specification | Reason |
|---|---|---|
| Unit and list | Recipient within a campaign, list built for a stated purpose | Purpose limitation and a defensible lawful basis |
| Consent and notice | Notice of source and purpose at first contact; opt-out honoured | Data protection duties; clean exclusion |
| Timestamps | Send, open, reply, meeting, diligence, commitment | Rounds and time to outcome |
| Arms | Two or three first-approach depths per campaign | Isolates depth |
| Randomisation | Random assignment within strata of fit score | Removes selection by warmth |
| Outcomes | Qualified meeting, diligence, commitment; exposure log | Defined before the study |
| Sample size | Pool campaigns; target from equation 5b | Neighbouring depths differ by under 1 point |
| Analysis plan | Pre-registered difference in rates with intervals; stratified | Prevents choosing the result |
Proposed design. No study of this kind has been run; no outcome is reported.
Incident records alone provide a limited basis for estimating leakage when exposure and detection are unknown. The study should record recipients at each stage, signed agreements, permitted downstream readers, access-log forwarding and the period during which documents remain available. A hazard model should specify its exposure denominator, detection mechanism and dependence assumptions before updating a stated prior. Both detected leaks and periods of monitored exposure with no detected leak contribute to that likelihood. Zero reported incidents without a defined detection process provide weaker evidence and cannot be treated as proof of zero hazard.
21 Report the choice to the client and the investment committee as a decision with its exposure
A board, client or investment committee should receive the depth decision with the response it is expected to produce and the exposure it creates. The report should state the proposed first-approach depth and the gate to each later stage, the number of recipients expected at each stage, and the item-level scoring behind them. It should state the legal basis for contact and the perimeter rule for each class of recipient.
The report should present exposure and response together, in the form of Table 8: commitments, expected loss and net value for the chosen approach and at least one shallower and one deeper alternative. Every number should be labelled as a model result under stated inputs or as a measured result from a named campaign, and the inputs should be listed. It should state the benefit and the loss given leak that were assumed, show the grid of Figure 5 for those inputs and state where the sender sits on it.
The report should end with the evidence that would change the recommendation: a change in the share of strategic recipients, a regulatory change in the perimeter rules, a campaign result that contradicts the assumed response and any incident of leakage. None of these figures is a forecast and the report should say so.
22 Use operating data and models to maintain the inputs, with a human decision at each gate
Data and automated tools can improve the inputs of this framework without taking over its decisions. A sender can use a language model to read a target's published mandate and score fit, to draft the first message from the verified facts, and to check a draft for items that exceed the stage. Each should be tested against the decision it is meant to improve: whether the fit score predicts a qualified meeting, and whether the draft check catches items scored above the stage's sensitivity.
Release of a stage requires its own confidentiality and regulatory checks. A positive reply alone does not establish that an agreement has been accepted, that the recipient is eligible or that onward readers are authorised. An automated release rule should check the applicable stage gates and retain a named human approval where the proposed process requires one. A single advance to the next stage does not necessarily release the full file. The access log should record the recipient, material released, gate evidence and approving person.
This paper reports no trained model, no measured accuracy and no uplift from automation. A tool that processes the file may itself become a recipient, so it should be assessed for what it exposes as well as for what it saves.
23 A decision rule for a live raise or fund placement
The results support a rule that a sender can apply before each campaign. First, score the items to be disclosed and assign each to the earliest stage at which its relevance outweighs its sensitivity, using Table 2 as the starting point. Second, confirm for each class of recipient that the first message is permitted, by reference to the perimeter rules of Table 3 and the data protection basis for contact. Third, set the first-approach depth at the verified teaser for the general list and at the memorandum for recipients with a strong fit score, which is the tiered approach. The model's memorandum-first comparators use click-through terms at first contact; teaser-first progression includes signed-agreement friction, and later progression assumes signed protection. This asymmetry is part of the hypothetical comparison. Operationally, apply the proposed signed-agreement and regulatory-perimeter gates before releasing a memorandum; a strong fit score alone does not satisfy those gates.
Fourth, hold the data room until a recipient has signed an agreement, has shown fit and has named the people who will read it. Fifth, count recipients at each stage and fix a ceiling before the campaign. In the model, the full file first exposes every recipient at the highest sensitivity, which has lower response and greater expected exposure than the memorandum under the evaluated inputs. Other response-cost or institutional-process assumptions require separate testing. Sixth, state the benefit and the loss given leak in advance and locate the campaign on Figure 5. If the hazard is judged high, because recipients include competitors, move to a teaser and accept the lower response. In the evaluated weak-agreement stress the tiered approach retains the highest mean; an actual release decision still requires its own contractual and regulatory gate checks.
Seventh, build the randomised slice into every campaign so that the next decision rests on measurement. For a fund manager raising from limited partners the ladder is the same with different items: track record and fee terms are relevant, and portfolio company names and valuations are sensitive. The rule depends on the scoring of items, which the sender must supply.
24 Limitations and the next decision
The experiment is constructed. The population, the ladder, the hazards, the losses and the protection factors are authored assumptions, and no observed outreach cohort, client record or incident informs them. Investors are modelled as a single decision with a Gaussian signal, which ignores relationships, reputation, the order in which investors talk to each other and competition among them. Leaks are independent events, which ignores contagion, and the loss given leak is proportional to sensitivity, which ignores the possibility that one item is decisive.
The legal analysis is limited to the texts that were read, in the versions and on the dates stated in the References. This paper does not analyse the DIFC, ADGM or UAE federal data-protection regimes. Nothing in the paper is legal advice, and it makes no statement about whether any rule applies to a particular raise or about the regulatory status of any party.
The next decision for a sender is therefore whether to run the study of Section 20 before settling on a standing policy. For a single raise, the practical decision is narrower: to send the least sensitive material that lets a qualified investor decide to meet, to hold everything else behind a signed agreement and evidence of fit, and to record every release. For an adviser or sponsor with many campaigns, the prize is a measured exposure variable and a measured response curve, in place of the figures that this paper had to assume.
Conditional expected confidentiality loss is an additive damage proxy across recipients. Summing those terms can count related harms more than once when recipients share the same information, while a single decisive disclosure may create a discontinuous loss that the sensitivity index does not capture. The simulated leak indicators are separate event draws; a percentile of campaign expected loss is not a percentile of realised transaction damage. These modelling choices require calibration and a dependence structure before use in a financial risk limit.
References
- Arrow, K. J. Economic Welfare and the Allocation of Resources for Invention. In The Rate and Direction of Inventive Activity, NBER and Princeton University Press, 1962. Chapter text as hosted by the National Bureau of Economic Research; a historical theoretical source. https://www.nber.org/system/files/chapters/c2144/c2144.pdf
- Shishkin, D., Titova, M. and Zhang, K. Withholding Verifiable Information. arXiv:2206.09918, version 4, May 2026. Working paper, not peer reviewed at the time of reading; theoretical. https://arxiv.org/pdf/2206.09918
- Milgrom, P. What the Seller Won't Tell You: Persuasion and Disclosure in Markets. Journal of Economic Perspectives 22(2), Spring 2008, pp. 115-131. Abstract-level evidence. https://www.aeaweb.org/articles?id=10.1257/jep.22.2.115
- Bernstein, S., Korteweg, A. and Laws, K. Attracting Early Stage Investors: Evidence from a Randomized Field Experiment. Stanford Graduate School of Business Research Paper 3006, 2014, later published in the Journal of Finance 72(2), 2017. Abstract record and the school's summary of the study (Stanford Graduate School of Business Insights, 30 July 2015) were read, not the full paper. https://ideas.repec.org/p/ecl/stabus/3006.html
- Boone, A. L. and Mulherin, J. H. How Are Firms Sold? Journal of Finance 62(2), April 2007, pp. 847-875. Abstract-level evidence. https://ideas.repec.org/a/bla/jfinan/v62y2007i2p847-875.html
- United States Code, Title 18, section 1839, Definitions (Defend Trade Secrets Act definition of trade secret, paragraph 3). Text as published by the Legal Information Institute, Cornell Law School. https://www.law.cornell.edu/uscode/text/18/1839
- Directive (EU) 2016/943 of the European Parliament and of the Council of 8 June 2016 on the protection of undisclosed know-how and business information (trade secrets), Article 2. Text as published on EUR-Lex; national transposition not reviewed. https://eur-lex.europa.eu/legal-content/EN/TXT/HTML/?uri=CELEX:32016L0943
- U.S. Securities and Exchange Commission. Regulation FD, 17 CFR 243.100, General rule regarding selective disclosure. Text as published by the Legal Information Institute with amendments to 2011; applies to issuers. https://www.law.cornell.edu/cfr/text/17/243.100 Issuer scope: 17 CFR 243.101(b). https://www.law.cornell.edu/cfr/text/17/243.101
- Augustin, P., Brenner, M. and Subrahmanyam, M. G. Informed Options Trading prior to M&A Announcements: Insider Trading? Working paper, first draft September 2013, draft of October 2015, later published in Management Science. Draft read; the published version may differ. https://uts.edu.au/sites/default/files/FDG_Seminar_160511.pdf
- The Panel on Takeovers and Mergers. The Takeover Code, Rule 2, Secrecy before announcements; the timing and contents of announcements. Fourteenth edition of 11 December 2023, as last amended on 1 May 2026; current at the date of access. https://code.thetakeoverpanel.org.uk/code.pdf
- Financial Services and Markets Act 2000, section 21, Restrictions on financial promotion. Latest available revised text on legislation.gov.uk, accessed 14 October 2026. https://www.legislation.gov.uk/ukpga/2000/8/section/21
- The Financial Services and Markets Act 2000 (Financial Promotion) Order 2005 (SI 2005/1529), articles 19 and 49. Latest available revised text on legislation.gov.uk, accessed 14 October 2026. https://www.legislation.gov.uk/uksi/2005/1529/article/19
- Dubai Financial Services Authority. DFSA Rulebook, General Module (GEN), current version GEN/VER72/07-26, rules 3.4.1 and 3.5.1 on financial promotions, binding rules, accessed 14 October 2026. https://dfsaen.thomsonreuters.com/rulebook/gen-341
- U.S. Securities and Exchange Commission. Regulation D, Rule 502, 17 CFR 230.502, Conditions to be met, paragraphs (b)(2) and (c). Text as published by the Legal Information Institute. https://www.law.cornell.edu/cfr/text/17/230.502
- Regulation (EU) No 596/2014 of the European Parliament and of the Council of 16 April 2014 on market abuse (Market Abuse Regulation), Articles 7, 10 and 11, read with the amendments to Article 11 made by Article 2(4) of Regulation (EU) 2024/2809 of 23 October 2024, in force from 4 December 2024; binding law. https://eur-lex.europa.eu/legal-content/EN/TXT/HTML/?uri=CELEX:32014R0596
- Regulation (EU) 2016/679 of the European Parliament and of the Council of 27 April 2016 (General Data Protection Regulation), Articles 5, 14 and 21. Text as published on EUR-Lex. https://eur-lex.europa.eu/legal-content/EN/TXT/HTML/?uri=CELEX:32016R0679
About the Author
Chennakeshav (CK) is a corporate finance and investment banking executive with 25+ years of global experience in deal origination, structuring and execution across M&A, growth capital and corporate strategy. He has led value-creation mandates for founders, corporates and funds — bridging the boardroom view to hands-on execution and close.
His career spans Morgan Stanley, HSBC, Lloyds Banking Group, EWEC, ADQ portfolio companies and Emirates Growth Fund, across TMT, real estate, fintech, deeptech, cleantech, infrastructure and energy. He has partnered with C-suite leaders, private equity and venture funds, sovereign wealth funds and family offices to finance complex fund raises and scale-up ventures, and has led M&A due diligence, post-merger integration and business-transformation initiatives to create value.
At Matchpoint Partners he is Managing Partner, leading the firm's corporate finance, M&A and capital-raising practice. He holds an MBA from London Business School, an engineering degree from VTU and a Master of Laws (LLM, in progress) from UCL London.
An active start-up mentor, CK mentors at Techstars, DIFC FinTech Hive, Startup Grind, Founder Institute and IN5, serves as Entrepreneur Mentor in Residence (EMiR) at London Business School, and judges the Entrepreneurship World Cup.
https://www.linkedin.com/in/ckadya/
https://www.matchpoint-partners.com/team/ck-adya.html
Disclaimer
This paper is part of a continuing series on the structure of private and alternative markets. The views expressed are the author's own. The paper is for information only, describes market structure in general terms, and does not constitute investment, legal, tax or regulatory advice or a recommendation in respect of any security, vehicle or counterparty.
