

1 Choose the fields of a targeting report by what each one changes in the first wave
A raiser that holds a long list of prospective investors cannot approach all of them at once. Senior time admits a first wave of a few dozen approaches, and analyst time admits verification of a somewhat larger shortlist. A targeting report is the document that records what is known about each prospect, and it can run to dozens of fields. This paper asks a narrow question about that report: which verified attributes change who is approached first, and which remove a prospect that could not have committed in any case. A field that changes neither decision is a cost without a use.
We answer the question with a constructed experiment. A list of 1,500 investors is generated from stated inputs. A vendor-style record is held for every investor and is partly wrong. A shortlist of 300 is formed from the record, and a wave of 75 approaches is drawn from the shortlist. Eight attributes can be verified at a stated cost, and the experiment measures what each verification adds to the expected number of signed commitments in the wave. The experiment is authored, it uses no observed outreach record, and every number in it is a model result under stated inputs.
The paper first builds the framework from published rules and studies [1, 2, 3, 4, 6, 8, 10, 11, 12]. It then defines the measures, runs the experiment, stresses it and shows how much data a real team would need to repeat it. It closes with an evidence design, a reporting format and a decision rule. Its principal limit is stated early: the ranking of attributes depends on assumed weights, and the experiment shows how the method behaves when its premises hold, not that they hold.
2 Define the decision as a fixed wave, and define a field by whether it eliminates or reorders
The decision is the composition of a wave of 75 approaches drawn from a list. The outcome is the number of signed commitments the wave produces, counted at the point where the investor commits. A qualified meeting is counted as an intermediate stage. A field is valuable when learning its true value changes the composition of the wave in a way that raises the expected number of commitments, net of the cost of learning it. A field that does not change the composition has no decision value however interesting it is as description.
Two mechanisms separate the fields. A gate is a condition whose failure makes commitment impossible for this offer: the investor cannot lawfully receive it, its mandate excludes it, its ticket limits do not fit, or it will not accept an approach through an adviser. Verifying a gate eliminates a prospect. An ordering term changes the probability of commitment among prospects that pass. Verifying it reorders the wave. A third class is a proxy, which predicts a gate or an ordering term but adds nothing once that term is verified. A fourth class is decoration, which predicts nothing.
Table 1 lists the twelve fields that the experiment treats. Eight can be verified from a source at a cost. Four are descriptive fields that a vendor record normally carries without verification. The table states the role each field is given in the constructed generating process. These roles are inputs. A real report must establish them from data, which is the subject of the later sections on evidence design.
Scroll across to see all columns.
| Field | Verification source | Role in the experiment | Decision it can change |
|---|---|---|---|
| Eligibility to receive the offer | Classification evidence or regulatory status | Gate | Eliminate |
| Mandate admits strategy and geography | Published investment policy or mandate letter | Gate | Eliminate |
| Ticket window and concentration limit | Published limits, fund size, allocation range | Gate | Eliminate |
| Adviser-led approach permitted | Published procurement or placement policy | Gate | Eliminate |
| Decision-maker identified | Named role confirmed by a second source | Ordering term | Reorder |
| Strategy and stage fit | Reading of recent commitments | Ordering term | Reorder |
| Recent comparable commitments | Fund close and investor lists | Ordering term | Reorder |
| Relationship depth | Own records of contact and history | Ordering term | Reorder |
| Investor type | Vendor record | Proxy for gate rates | Triage |
| Size (assets under management) | Vendor record | Proxy for ticket gate and activity | Triage |
| Headcount | Vendor record | Decoration, correlated with size | None |
| Public reach | Vendor record | Decoration, correlated with size | None |
Role assignments are inputs to the constructed experiment, not findings. Verification sources are examples of the kind of document a team would open.
3 Published investor rules turn some attributes into checkable gates
The CalPERS Public Employees’ Retirement Fund Investment Policy, effective 1 July 2026, illustrates a verifiable ticket constraint. Appendix 4 caps its commitment to a single fund at 35 per cent of that fund. Aggregate net committed capital to one general partner is limited to 15 per cent of total net committed capital in the private equity programme; an exception requires specific committee approval [11, 14]. The percentage bases differ. The fund cap alone implies a fund of at least USD 114.3 million for a USD 40 million commitment. That arithmetic shows neither available headroom nor an intention to invest.
US Rule 506(c) requires accredited purchasers and reasonable steps by the issuer to verify their status. This applies to purchases under the exemption; each outreach route requires its own assessment [8]. Under Rule 501(a)(1), one accredited-investor category covers a public employee plan established and maintained by a state or specified subdivision, agency or instrumentality with total assets above USD 5 million [9]. The DFSA Conduct of Business module specifies a retail default and deemed professional categories. Its large-undertaking test uses the most recent financial statements and requires meeting at least two thresholds: USD 20 million in total assets, USD 40 million in net annual turnover, or USD 2 million in own funds or called-up capital [10].
These sources establish that eligibility and ticket fit are tests with documented thresholds, applied by reference to evidence about the investor. They do not establish that any particular adviser or issuer is required to apply them to an outreach list, since the duties differ by route and jurisdiction. They also supply no base rate. The experiment therefore takes pass probabilities as inputs, and Table 2 records what each rule implies for the report.
Scroll across to see all columns.
| Source | Rule or limit | What the report must hold | Status of the text |
|---|---|---|---|
| CalPERS PERF private equity policy [11, 14] | Fund cap 35%; separate single-GP programme limit 15% with committee-approved exceptions | Fund size, intended ticket and existing GP exposure | Effective 1 July 2026 |
| United States Rule 506(c) [8] | All purchasers accredited; reasonable steps to verify | Status evidence and its date | eCFR current text, read October 2026 |
| United States Rule 501(a) [9] | Includes qualifying public employee plans with assets above USD 5 million | Category and asset evidence | eCFR current text, read October 2026 |
| DFSA conduct of business module [10] | Retail default; deemed professional categories; large undertaking test | Category and latest financial statements | Version 51, July 2026, current when read |
MatchPoint summary of the cited texts. Status as stated in the text of this section. No legal conclusion is drawn about any offering.
4 A report must state the source and date of each field, and hold only fields it uses
A field in a targeting report is useful only if it is accurate when the approach is made. Kaplan and Lerner review commercial private-capital databases and find that they differ in coverage and definitions, depend on voluntary reporting, and carry backfill and selection biases. Platforms group funds by vintage year in three different ways, and one platform may classify a multi-asset investor differently from another. Their summary is that existing databases differ in methodology and frequently produce discrepancies, particularly in transaction-level data. [6] That study concerns venture capital data in 2016. It establishes that two records of the same investor can disagree, not how often.
The consequence for the report is that the word verified needs an object. We propose that every field carries the source, the date it was read and the person who read it. A mandate checked against a published policy in the last ninety days is a different object from a mandate inherited from a vendor label. The experiment later treats the vendor record as a noisy reading of the truth and the verified reading as exact, and the stress cases relax that second assumption.
Personal data set a second limit. Article 5(1) of the United Kingdom General Data Protection Regulation requires data to be adequate, relevant and limited to what is necessary for the purposes of processing, and to be accurate and, where necessary, kept up to date. [12] A field about a named decision-maker therefore needs a stated use. The DIFC Data Protection Law 2020 sets equivalent requirements in Article 9(1): personal data must be relevant and limited to what is necessary for specified purposes, and accurate and, where necessary, kept up to date. [15] We did not review the Abu Dhabi Global Market regulations, and local advice is needed before applying either principle. The practical rule is that a field with no decision value in Table 1 is also a field the report should not hold about an individual.
One further observation concerns what standards exist. Limited partners have standardised the questions they put to managers: the ILPA questionnaire, in its version 2.0 of November 2021, covers twenty topics, is not a required document, and was created to reduce the burden of customised questionnaires. [13] In this review we did not locate an equivalent standard for what a raiser should verify about an investor. The report in this paper is therefore a proposal, and its fields are justified by the experiment, not by convention.
5 The closest field experiment shows what draws investor interest in an offer, not which investor attributes predict commitment
The closest experimental study to our question is a randomised field experiment on a platform that matches start-ups with angel investors. About 17,000 emails went to about 4,500 investors, and the information set in each email was randomised. Investors responded strongly to information about the founding team and not to information about traction or existing lead investors. In the March 2014 draft we read, the effect was driven by the most experienced investors, while the least experienced responded to all categories; in that draft, revealing the team raised the click rate by 2.6 percentage points on a base click rate of about 16.5 per cent, and 2.98 per cent of those who clicked later invested. [1]
That study randomised attributes of the offer, which is what a correspondence design can do. Our question concerns attributes of the investor, which a raiser cannot randomise. The study also records a click, an introduction request and a reported investment, not a signed commitment to a fund. Its authors note that existing databases consist of completed deals, not the pool of start-ups investors considered, which prevents assessment of the selection process. [1] The Journal of Finance version of 2017 reports the same team result in its abstract; we did not open its full text, so the figures above are those of the draft and the published figures may differ.
Surveys give stated preferences. A survey of 885 venture capitalists at 681 firms found that the management team was mentioned as an important selection factor by 95 per cent of firms, and that fit with the fund was ranked as less important. [2] Stated preference concerns what investors say about companies, not what limited partners do with a manager. For limited partners, one study documents large differences in return between classes of investor, with endowments about 14 per cent above average, but it concerns performance and not response to outreach. [7]
These sources establish that information about the offer changes investor attention, that experience moderates the response, and that investor type is associated with outcomes of a different kind. They do not establish which investor attributes predict commitment to a placement. In the search for this paper we found no field experiment that does, and the absence of a result in our search is not proof that none exists. The experiment below is built to fill that gap with a constructed case, and the evidence design later in the paper shows how a real study would fill it with data.
6 Value-of-information analysis gives the measure, and variable-selection theory warns about redundancy
Value of information analysis asks what a piece of information is worth before it is bought. In health economics, the expected value of perfect information for a subset of parameters measures the gain from learning them exactly, and it is an upper bound on the value of any finite study of them. Heath and Baio describe the expected value of sample information as the average gain from a proposed study, and recommend that the partial perfect-information bound be calculated first, because a low bound means a study of those parameters has no value. [4] The setting is health technology assessment, and we adapt only the logic.
Within the same decision model, knowing an attribute exactly bounds the expected benefit of a noisier reading for that outreach decision. Bindels and co-authors report that although stakeholders recognise the relevance of value of information in Dutch reimbursement decisions, it is hardly used, and that results can be biased if structural uncertainty is ignored. [5] That finding is a caution for us. Our results hold within the structure we assume, and a different structure would give different values.
Variable-selection theory adds a warning about measuring value one field at a time. Guyon and Elisseeff show that ranking variables individually is usually suboptimal for building a predictor when variables are redundant, and that a variable useless alone can improve performance in combination, as can two variables that are useless separately. [3] For a report, redundancy means that a field can look valuable alone and add nothing once another is known. Complementarity means that a field can look worthless alone and matter in company. We therefore measure each field three ways: alone, last, and as an average over all orders of verification.
These sources justify the measures as categories. None supplies a value for any attribute of an investor. The values in the sections that follow come entirely from the authored inputs.
7 State the estimand: expected commitments in a fixed wave, under each information set
Let investor i have a probability of signing a commitment, p_i, in equation (1a). It is the product of the gate indicators G_i and a probit term in an index η_i. The index in equation (1b) sums standard normal ordering terms S and one binary term D. A qualified meeting uses the same index with a lower threshold. The ranker is assumed to know this structure and the input weights, which makes every result an optimistic benchmark for what a team can extract. A real team would estimate the weights with error.
In equation (1), Φ is the standard normal distribution function; τ_c is the commitment threshold, set at 2.90 (the meeting threshold is 1.20); g_ig is one if investor i passes gate g, for eligibility E, mandate M, ticket T and route R; S_ik is the k-th ordering term for strategy fit, recent commitments and relationship depth; D_i is one if a decision-maker is identified; and b_k and b_D are weights of 0.70, 0.40, 0.50 and 0.50. An investor who fails any gate has probability zero, however well it scores on the ordering terms.
The ranker scores each shortlisted investor with the subset of eight verified fields and uses the vendor record for the rest. It selects the top 75 scores. V(A) is the sum of the true model probabilities for the selected wave. The difference from the record-only wave measures the gain for each information set.
8 A constructed list of 1,500 investors with stated gate rates, weights and costs
The list has 1,500 investors in six types. Each type has its own pass probability for each gate, shown in Table 3, and larger investors are more likely to pass the ticket gate. Ordering terms are standard normal, and recent commitments are correlated with size at 0.6. A decision-maker is identified for between 35 and 70 per cent of investors by type. Under these inputs about 26 per cent of the list can commit at all, because the gates multiply. The inputs are authored to make the experiment informative. They are not estimates of any real investor population.
Scroll across to see all columns.
| Type | Share | Eligible | Mandate | Ticket | Route | Decision-maker |
|---|---|---|---|---|---|---|
| Public pension | 15% | 0.95 | 0.45 | 0.65 | 0.70 | 0.50 |
| Sovereign or state | 10% | 0.97 | 0.55 | 0.60 | 0.75 | 0.35 |
| Family office | 35% | 0.80 | 0.70 | 0.75 | 0.95 | 0.70 |
| Fund of funds | 15% | 0.90 | 0.50 | 0.70 | 0.85 | 0.60 |
| Foundation | 10% | 0.92 | 0.40 | 0.55 | 0.60 | 0.50 |
| Insurer | 15% | 0.93 | 0.30 | 0.60 | 0.70 | 0.45 |
Authored inputs to the constructed experiment; probabilities at average size. Ticket pass probability rises with size. Not market observations.
The vendor record is held for every investor, and it is noisy. Each gate reading is correct with the probability in Table 4, and each ordering term is read with the noise shown. The relationship term is the noisiest because it lives in the raiser's own records and is not vendor data. Verification replaces the noisy reading with the exact value at the analyst time shown, priced at USD 60 per hour, which is 135 USD per prospect for all eight.
Scroll across to see all columns.
| Attribute | Role in index | Record accuracy or noise | Verification minutes | Index weight |
|---|---|---|---|---|
| Eligibility to receive the offer | Gate | 0.90 | 20 | Gate |
| Mandate admits strategy and geography | Gate | 0.75 | 30 | Gate |
| Ticket window and concentration limit | Gate | 0.80 | 15 | Gate |
| Adviser-led approach permitted | Gate | 0.70 | 10 | Gate |
| Decision-maker identified | Binary term | 0.65 | 15 | 0.50 |
| Strategy and stage fit | Standard normal term | s.d. 1.0 | 25 | 0.70 |
| Recent comparable commitments | Standard normal term | s.d. 0.8 | 15 | 0.40 |
| Relationship depth | Standard normal term | s.d. 1.2 | 5 | 0.50 |
Authored inputs. Verification minutes are analyst time per prospect, priced at USD 60 per hour. Not observed costs.
9 Combine the vendor record with the investor's type and size by Bayes rule, and replace it when verified
The ranker uses what the record and the descriptive fields imply. For a gate, the prior pass probability depends on the investor type and size, and the vendor reading updates it by the odds rule in equation (2a). For an ordering term, the prior mean depends on size for recent commitments, and the noisy reading updates it by the normal rule in equation (2b). A verified attribute is treated as exact. This design makes the record-only ranking as good as the information allows, so that the gain from verification is not inflated by a weak baseline.
Here π_ig is the prior probability that investor i passes gate g and the hatted value is the posterior; a_g is the accuracy of the vendor reading, and the exponent is plus one when the record shows a pass and minus one when it shows a failure; μ_0 and v_0 are the prior mean and variance of an ordering term; r is the noisy reading with noise standard deviation σ; and the hatted mean and variance are the posterior. The score is then the product of the gate probabilities and the expected probit term, as equation (3a) shows.
In equation (3), hatted g is the posterior pass probability of a gate, or one or zero if verified; hatted q is the posterior probability that a decision-maker is identified; hatted μ and hatted σ squared are the mean and variance of the index over the ordering terms; and W(A) is the set of K highest scores. The square-root form uses the identity that the expected normal distribution function of a normal variable equals the distribution function of its mean divided by the root of one plus its variance, which the model checks by quadrature.
10 Random selection and the highest probability wave as model benchmarks
A random wave of 75 approaches from the whole constructed list yields 0.66 expected commitments. The 75 highest true model probabilities in the whole list sum to 10.76; this benchmark assumes full information. Record-only ranking yields 5.14 expected commitments (6.9 per cent of approaches) and 24.3 qualified meetings. Full verification on the shortlist yields 9.31 expected commitments (12.4 per cent) and 47.2 qualified meetings. Table 5 compares these results.
Scroll across to see all columns.
| Benchmark | Expected commitments in the wave | Per approach (%) | Expected qualified meetings |
|---|---|---|---|
| Random wave from the whole list | 0.66 | 0.9 | n/a |
| Record only, best use of the vendor record | 5.14 | 6.9 | 24.3 |
| All eight attributes verified on the shortlist | 9.31 | 12.4 | 47.2 |
| Best wave inside the shortlist | 9.31 | 12.4 | n/a |
| Highest-probability wave in the whole list | 10.76 | 14.3 | n/a |
MatchPoint analysis of the constructed list. Model output under stated inputs; not an observed result. Expected values over 200 replications.
With perfect verification and unchanged gates in the base simulation, full verification matches the highest-probability wave within the shortlist at 9.31 expected commitments. The full-list benchmark is 10.76; the gap measures the effect of restricting verification to the shortlist in this model. Full verification gains 4.17 expected commitments, or 81 per cent, over record-only ranking. Across replications, the standard deviation of the gain is 0.81, and its 95 per cent interval for the mean has half-width 0.11. Random selection provides a comparison point; some waves can score below it.
The result is conditional on the premise of the model: the ranker knows the weights and the vendor accuracies. A team that does not will extract less from the same record, and may gain more from verification. The stress cases quantify that direction.
11 Four in ten approaches in the record-only wave cannot commit, and gates account for the hidden failures
The record-only wave looks well chosen and is not. Of its 75 prospects, 42 per cent fail at least one gate and cannot commit to this offer. Mandate is the largest single source, failing for 24 per cent of the wave, followed by ticket at 11 per cent, route at 9 per cent and eligibility at 5 per cent. Figure 1 shows the shares. These prospects are invisible in a campaign log until they answer, and the wave has already spent its approaches on them.
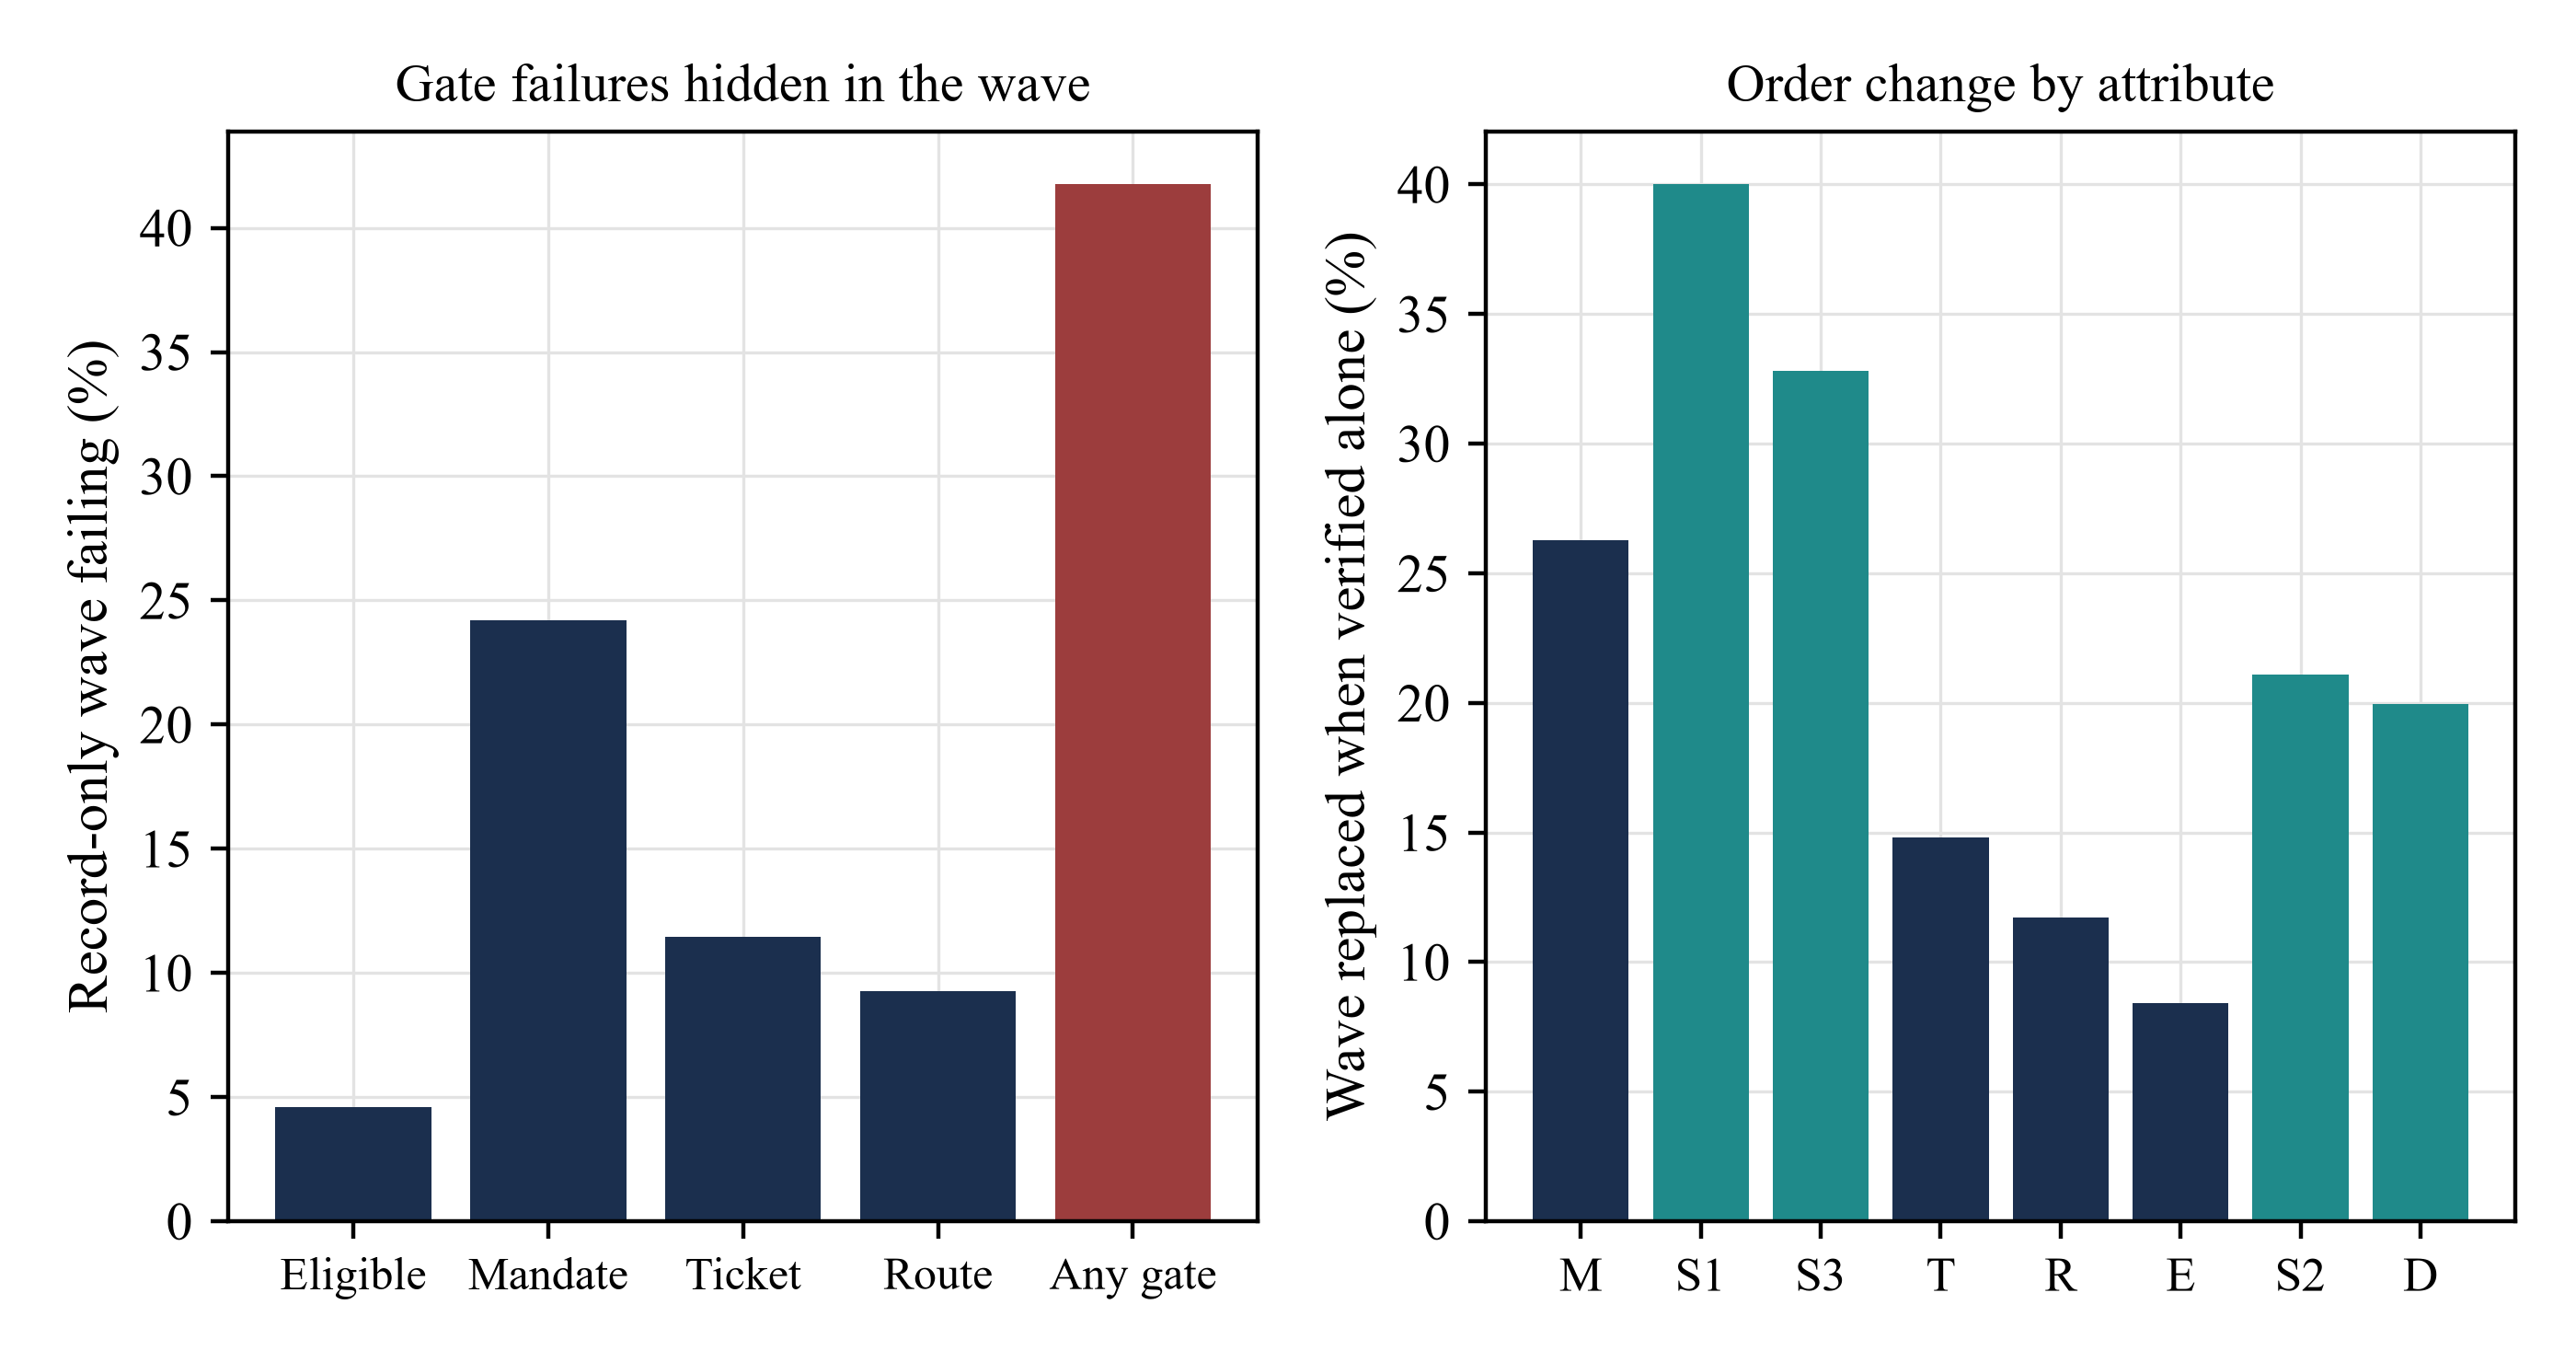
MatchPoint analysis of the constructed list. Model output under stated inputs; not an observed result. Left: share of the record-only wave failing each gate. Right: share of the wave replaced when one attribute is verified alone.
Order change is the second effect. Verifying the strategy-fit term alone replaces 40 per cent of the wave, verifying relationship depth replaces 33 per cent, and verifying mandate replaces 26 per cent. Verifying all four gates replaces 43 per cent, and all eight replaces 58 per cent. After the four gates are verified no member of the wave fails a gate, by construction in the base inputs, but 47 per cent of the wave still contains a prospect that cannot commit when only the three ordering terms are verified. Verifying only the ordering terms raises that share from 42 per cent, because the ranking then concentrates on high scorers that fail a gate. Table 6 gives the full list.
Scroll across to see all columns.
| Attribute verified | Record-only wave failing the gate | Wave replaced | Wave still containing a prospect that cannot commit |
|---|---|---|---|
| Mandate admits strategy and geography | 24% | 26% | 25% |
| Strategy and stage fit | n/a | 40% | 45% |
| Relationship depth | n/a | 33% | 44% |
| Ticket window and concentration limit | 11% | 15% | 35% |
| Adviser-led approach permitted | 9% | 12% | 37% |
| Eligibility to receive the offer | 5% | 8% | 39% |
| Recent comparable commitments | n/a | 21% | 43% |
| Decision-maker identified | n/a | 20% | 42% |
| All four gates verified | 42% any gate | 43% | 0% |
| All eight verified | 42% any gate | 58% | 0% |
MatchPoint analysis of the constructed list. Model output under stated inputs; not an observed result. Failure share is measured on the record-only wave at the verification date. Replacement is measured against the record-only wave.
The implication is direct. A raiser that skips gate verification will approach about four prospects in ten that cannot commit, and eligibility failures, at 3.5 approaches in a wave of 75, carry a regulatory exposure that the commitment count does not price. The model counts commitments only. The eligibility gate is therefore worth more than the commitment arithmetic suggests, and the break-even figures later in the paper understate the case for it.
12 Under the authored weights, mandate and strategy fit carry about half the value, and alone-values overstate the total
Table 7 reports three values for each attribute. Verified alone is the gain from verifying only that attribute. Verified last is the loss from leaving it out of a fully verified report. The Shapley value is the average of the marginal gain over all orders in which attributes could be verified, defined in equation (4a), and it sums to the total gain by equation (4b).
Here J is the set of eight attributes, A is a subset of it, and V is the wave value of equation (3b). Mandate has a Shapley value of 1.098 commitments (26 per cent of the gain) and strategy fit 1.001 (24 per cent). Together they carry about half of the total. The two values are close and no interval was computed for either, so we do not claim that one outranks the other. Relationship depth follows at 0.599, ticket at 0.481, route at 0.342, eligibility at 0.252, recent commitments at 0.213 and decision-maker at 0.184. Figure 2 shows the three values for every attribute.
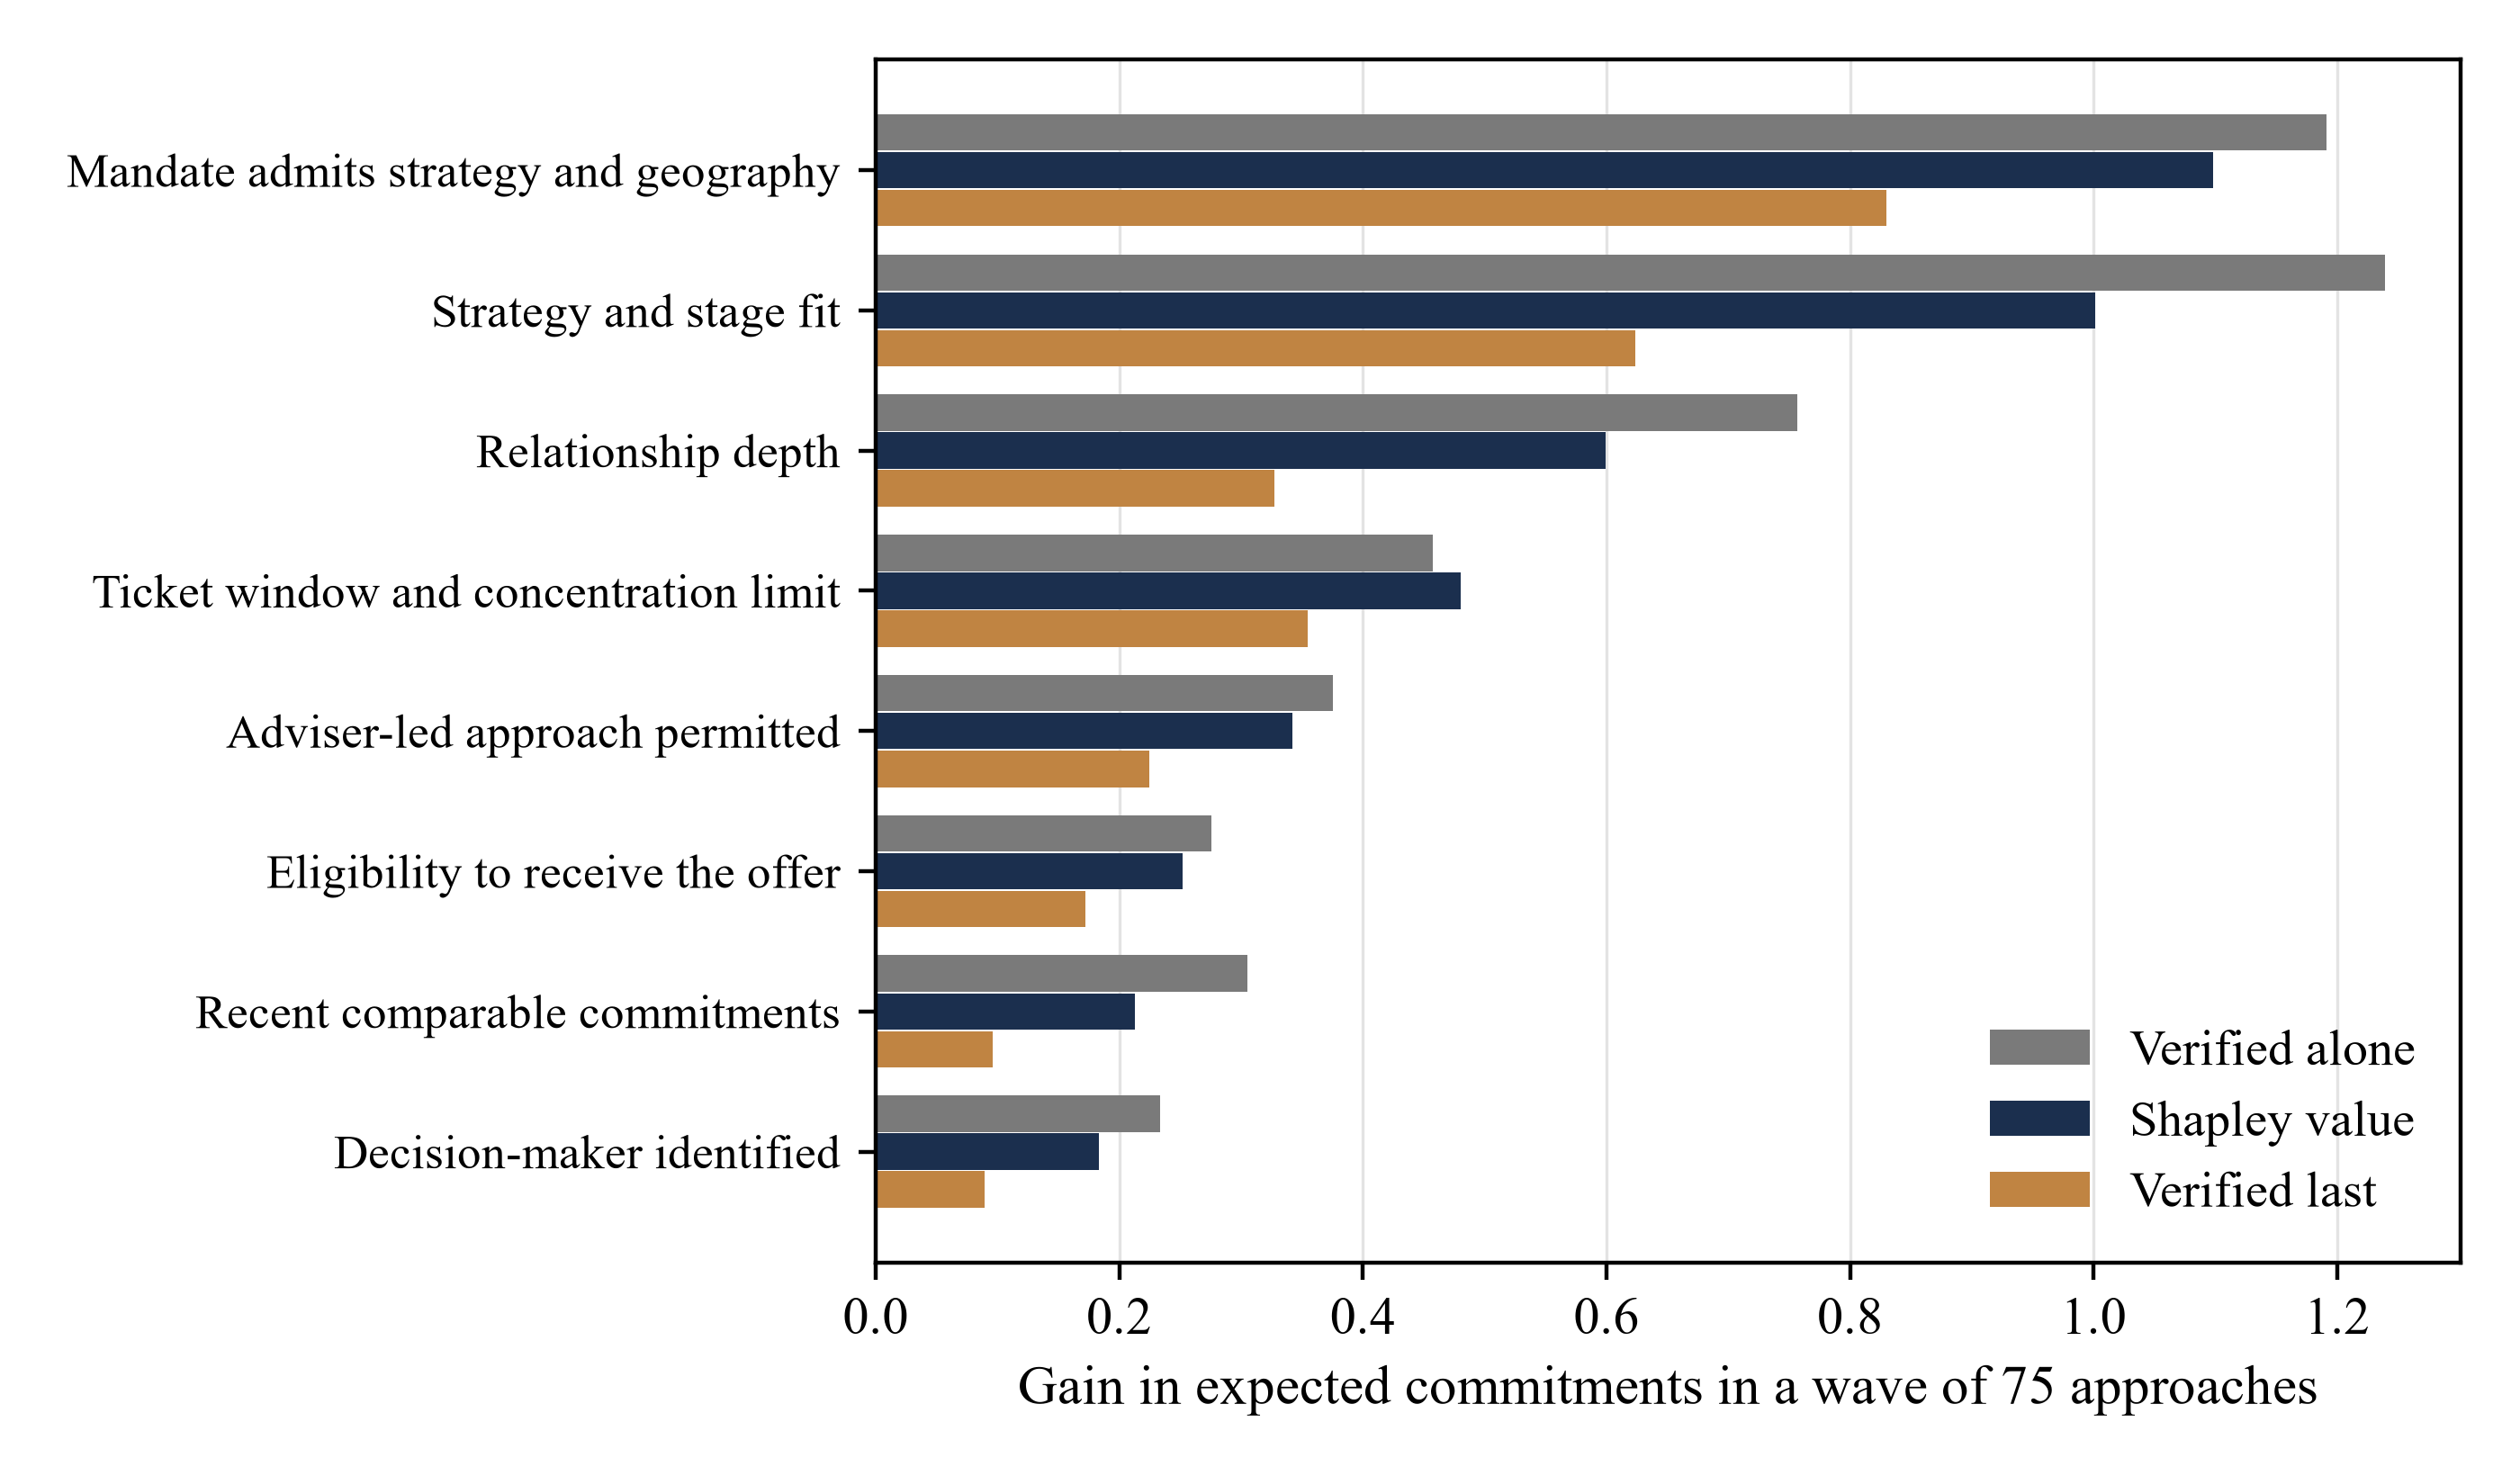
MatchPoint analysis of the constructed list. Model output under stated inputs; not an observed result. Gain in expected commitments in a wave of 75 approaches.
Scroll across to see all columns.
| Attribute | Verified alone | Verified last | Shapley value | Share of gain | Break-even value per commitment (USD) |
|---|---|---|---|---|---|
| Mandate admits strategy and geography | 1.191 | 0.830 | 1.098 | 26% | 8,197 |
| Strategy and stage fit | 1.239 | 0.624 | 1.001 | 24% | 7,491 |
| Relationship depth | 0.757 | 0.328 | 0.599 | 14% | 2,502 |
| Ticket window and concentration limit | 0.457 | 0.354 | 0.481 | 12% | 9,363 |
| Adviser-led approach permitted | 0.376 | 0.225 | 0.342 | 8% | 8,767 |
| Eligibility to receive the offer | 0.276 | 0.172 | 0.252 | 6% | 23,775 |
| Recent comparable commitments | 0.305 | 0.096 | 0.213 | 5% | 21,159 |
| Decision-maker identified | 0.234 | 0.090 | 0.184 | 4% | 24,512 |
MatchPoint analysis of the constructed list. Model output under stated inputs; not an observed result. Break-even is the shortlist verification cost divided by the Shapley value: the value of one signed commitment above which verification pays.
The three measures disagree in the way the theory predicts. The alone values sum to 4.83 and the last values to 2.72, against a total gain of 4.17. Verifying fields alone overstates the gain because fields substitute for one another: once mandate is known, the value of knowing ticket falls. Verifying last understates it for the same reason. Only the average over orders reconciles. The break-even column shows that every attribute pays if one commitment is worth more than about USD 24,512 to the raiser, and the cheaper attributes pay at about USD 2,502. These thresholds rest on the assumed analyst minutes in Table 4 and an assumed rate of USD 60 per hour, and they count commitments only. Whether they are met is a commercial question the paper does not settle.
13 A minimal report of five attributes captures nine tenths of the gain at under two thirds of the cost
A report need not carry all eight verified fields. We rank attributes by gain per dollar, add them greedily, and also search every one of the 256 subsets for the cheapest that reaches a target. The greedy order is S3, S1, R and onward, shown in Table 8 and Figure 3. The cheap relationship term comes first because its verification costs five minutes. Mandate follows later because it costs thirty.
In equation (5), L is the shortlist size, c_j is the verification cost of attribute j per prospect, φ_j is its Shapley value, B_j is its break-even commitment value, and ρ_j(A) is its gain per dollar given the set A already verified. The cheapest subset reaching 90 per cent of the gain is M, T, R, S1, S3, which costs USD 25,500, or 63 per cent of the USD 40,500 needed for all eight. Reaching 95 per cent needs E, M, T, R, S1, S3, at 78 per cent of the cost.
Scroll across to see all columns.
| Step | Attribute added | Cumulative cost (USD) | Expected commitments | Share of full gain |
|---|---|---|---|---|
| 1 | Relationship depth | 1,500 | 5.90 | 18% |
| 2 | Strategy and stage fit | 9,000 | 7.04 | 45% |
| 3 | Adviser-led approach permitted | 12,000 | 7.40 | 54% |
| 4 | Mandate admits strategy and geography | 21,000 | 8.46 | 79% |
| 5 | Ticket window and concentration limit | 25,500 | 8.90 | 90% |
| 6 | Eligibility to receive the offer | 31,500 | 9.11 | 95% |
| 7 | Recent comparable commitments | 36,000 | 9.22 | 98% |
| 8 | Decision-maker identified | 40,500 | 9.31 | 100% |
MatchPoint analysis of the constructed list. Model output under stated inputs; not an observed result. Cost is shortlist size times analyst minutes at USD 60 per hour.
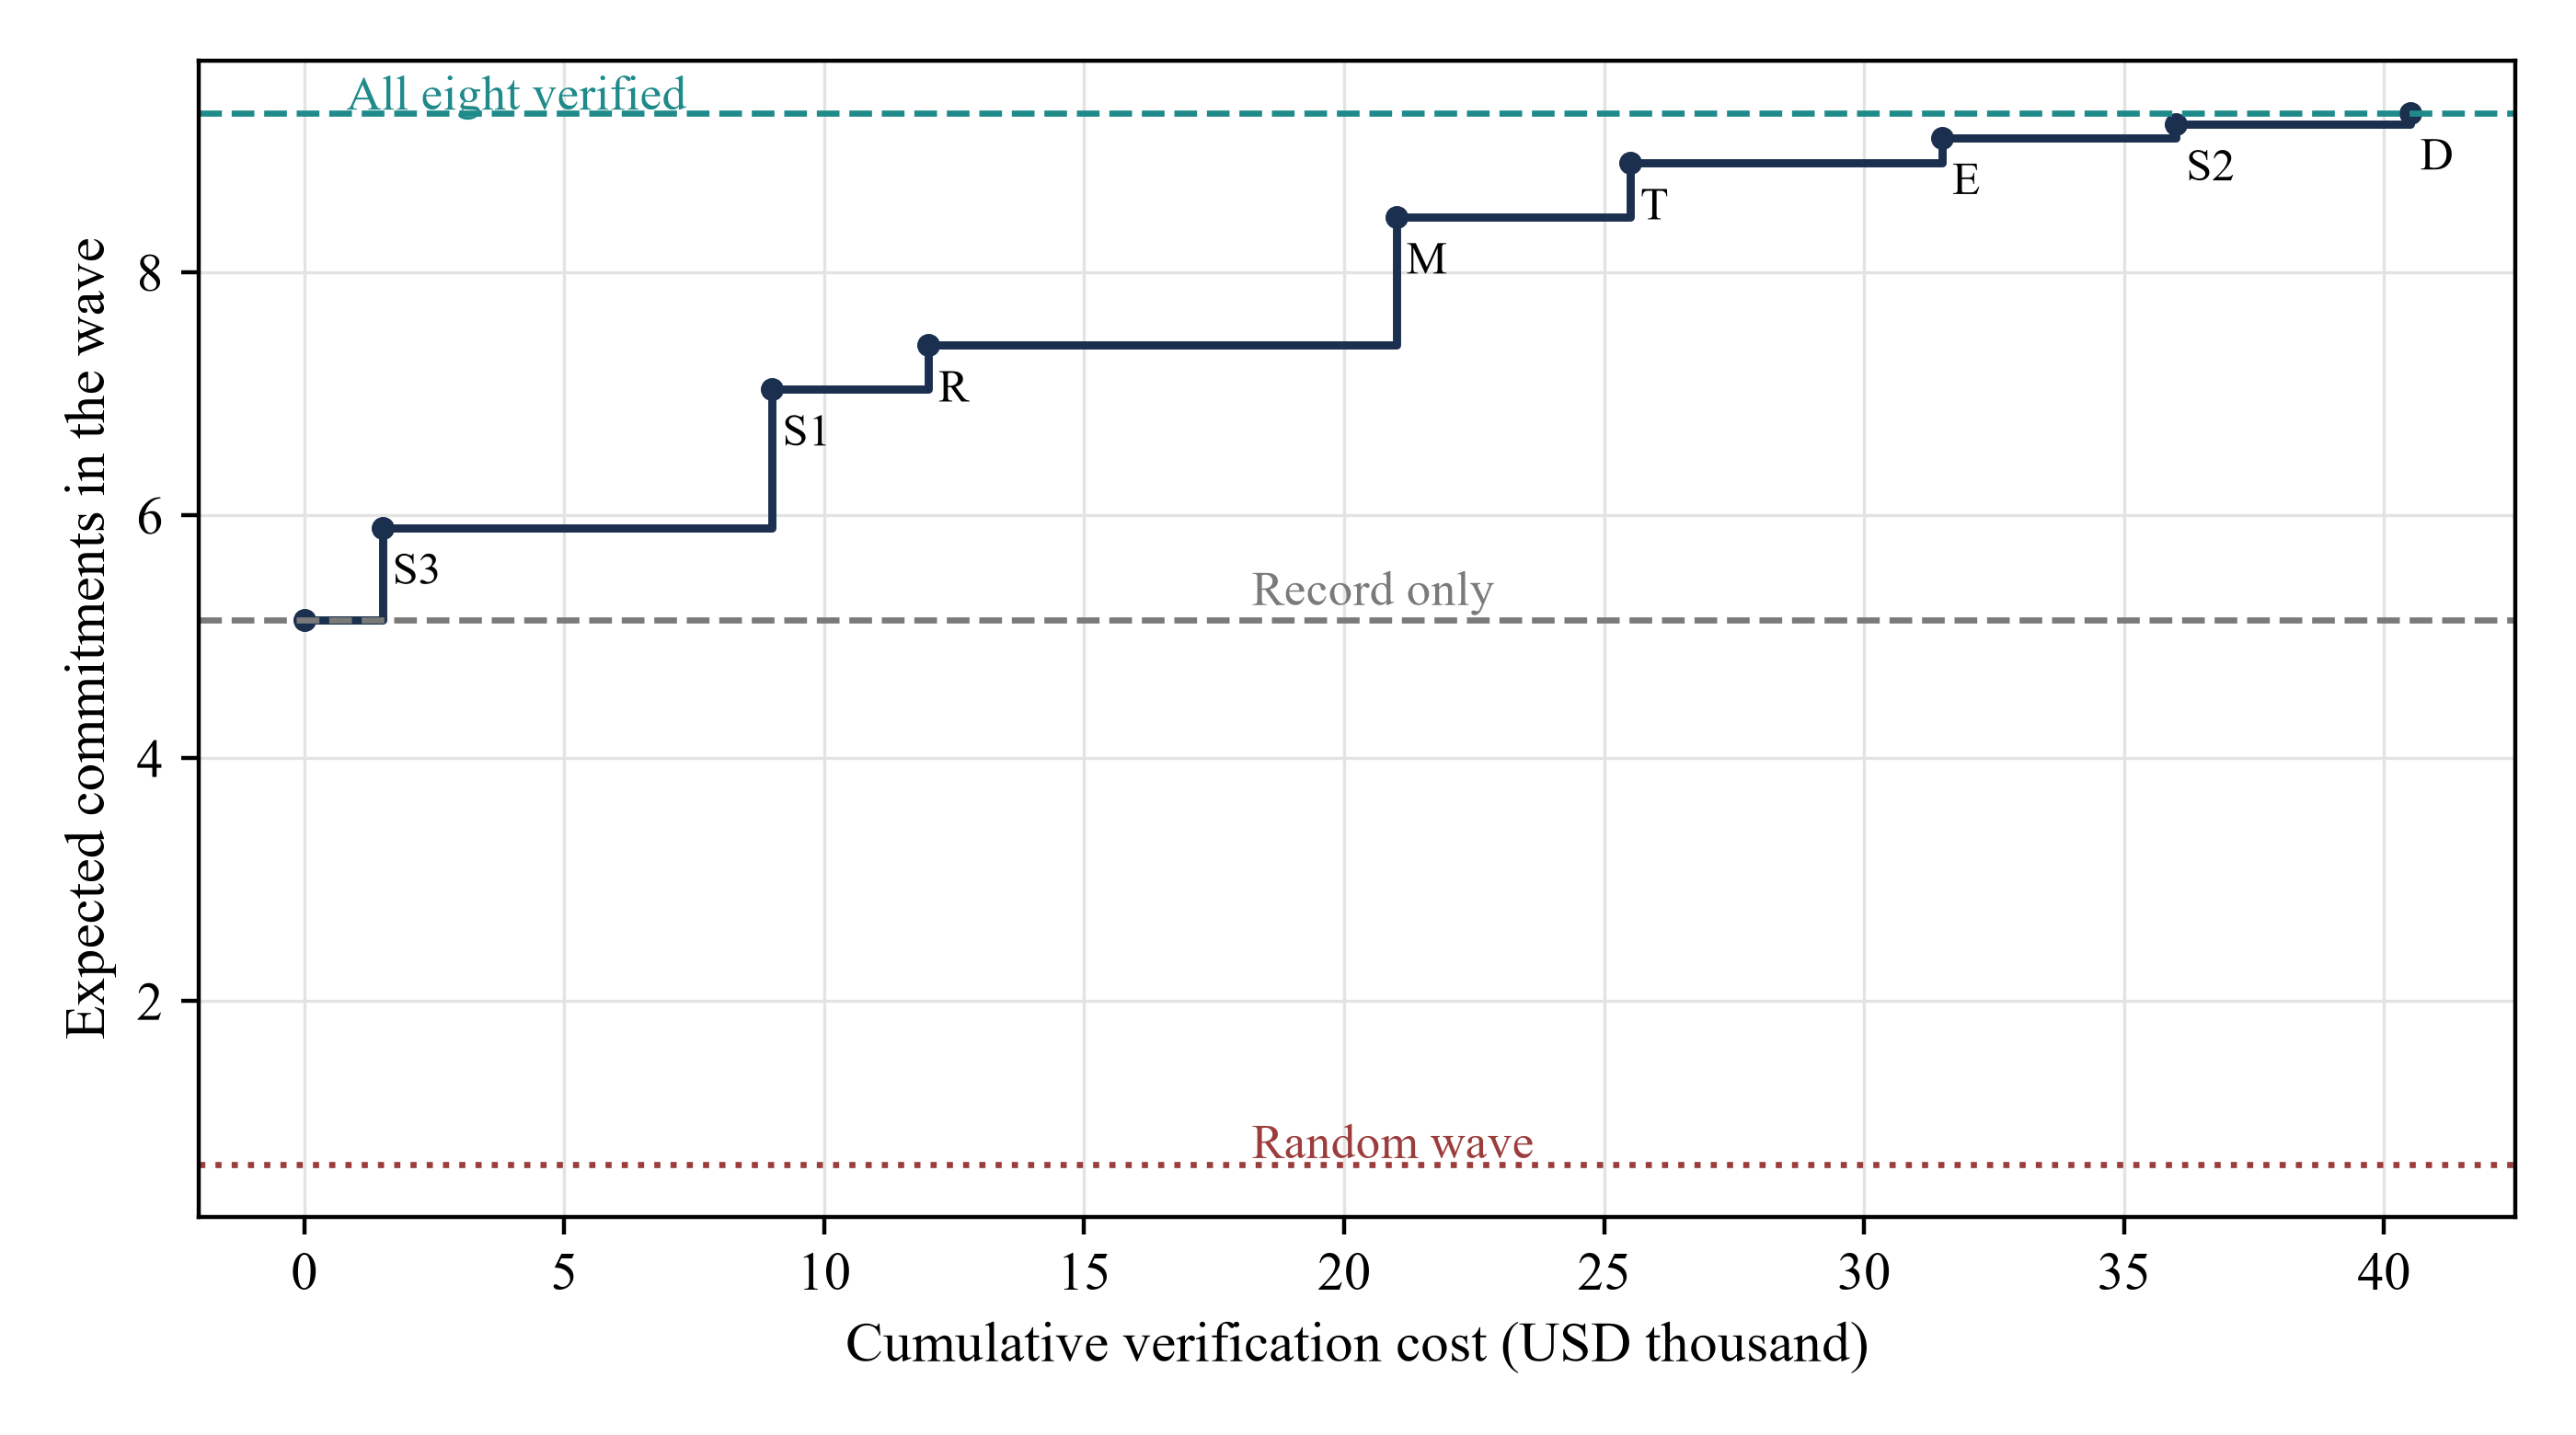
MatchPoint analysis of the constructed list. Model output under stated inputs; not an observed result. Attributes added in greedy order; dashed lines are record-only and full verification, dotted line a random wave.
The ladder shows diminishing returns without a sharp cliff. The last three attributes together add about a tenth of the gain and cost more than a third of the budget. The minimal set is a statement about these inputs. The practical lesson is that the choice of which field to verify next should be made by gain per dollar given what is already known, and a team that reports fields in a fixed template is not making that choice.
14 In the constructed case, descriptive fields earn their place in triage and add nothing to the final order
A vendor record carries fields that are easy to collect: investor type, size, headcount and public reach. In the experiment, type shifts the base rates of the gates, and size loads on the ticket gate and on recent activity. Headcount and public reach are noisy functions of size and carry no independent effect. Table 9 and Figure 4 measure each field alone, added last to the other three with only the vendor record, and added last when all eight attributes are verified.
Scroll across to see all columns.
| Descriptive field | Used alone, record only | Added last, record only | Added last, all verified (triage only) |
|---|---|---|---|
| Type | 0.390 | 0.348 | 0.275 |
| Size (log AUM) | 0.172 | 0.055 | 0.085 |
| Headcount | 0.119 | 0.000 | 0.000 |
| Public reach | 0.068 | 0.000 | 0.000 |
MatchPoint analysis of the constructed list. Model output under stated inputs; not an observed result. Gain in expected commitments in a wave of 75, 80 replications. The third column measures value through shortlist formation only.
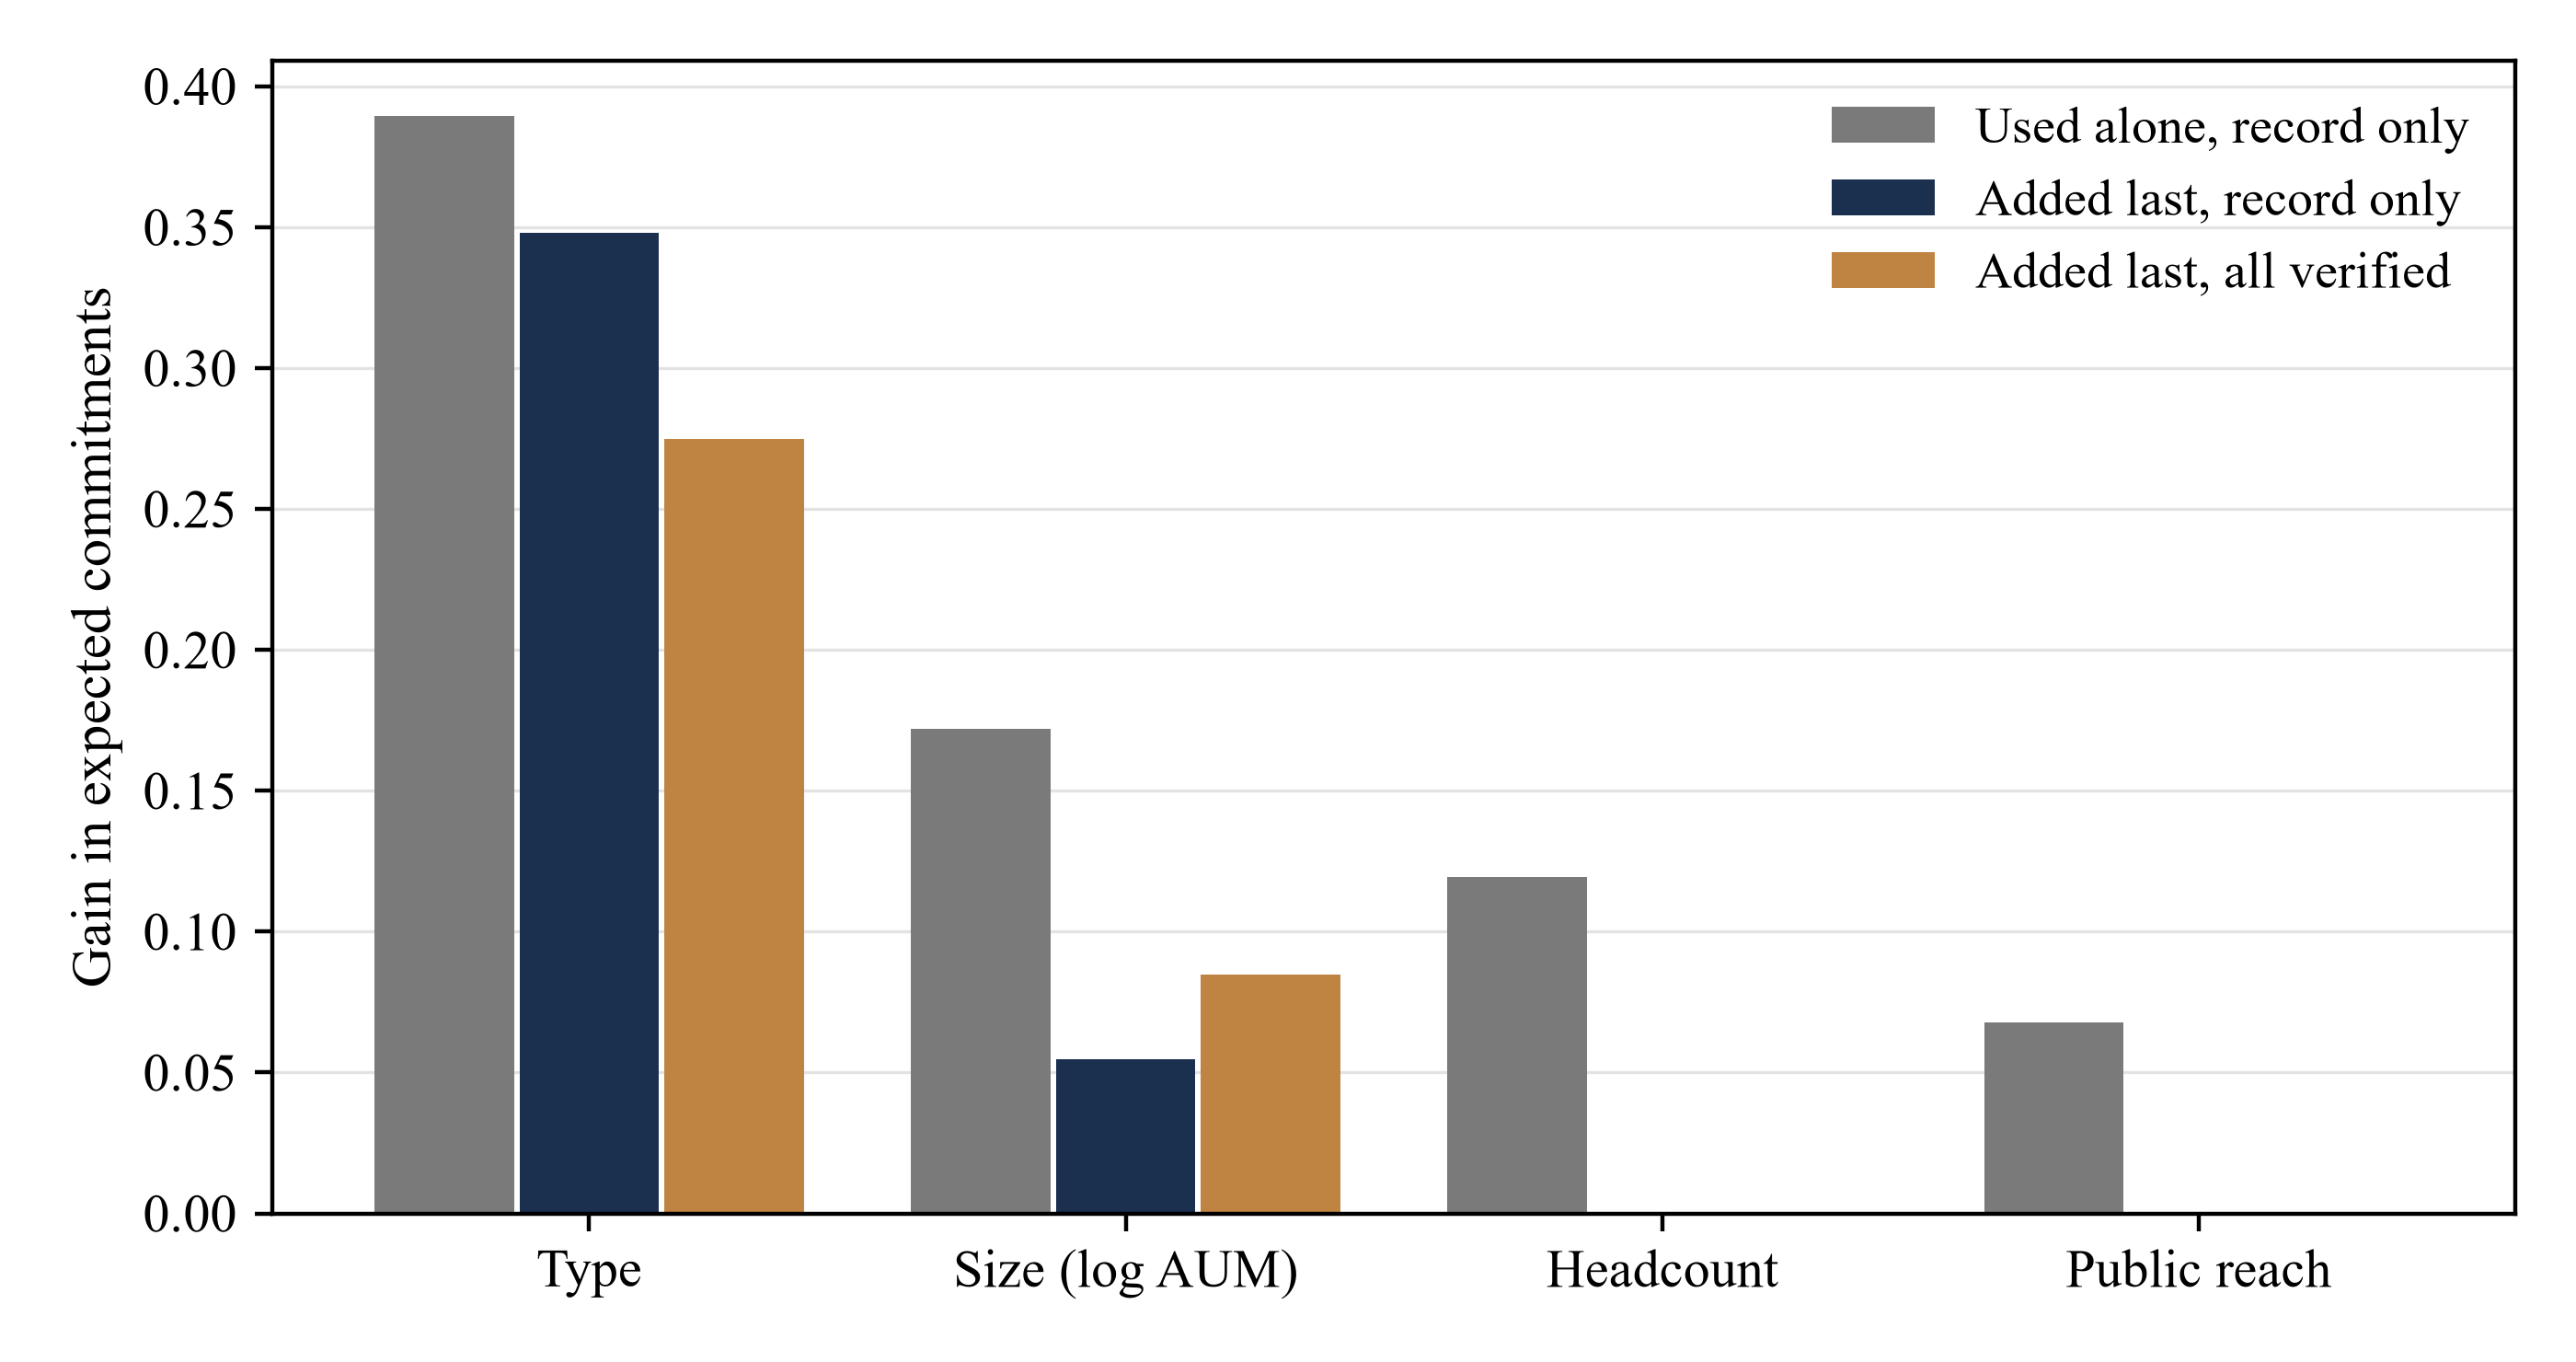
MatchPoint analysis of the constructed list. Model output under stated inputs; not an observed result. Gain in expected commitments by descriptive field and information state.
Used alone, type is worth 0.390 commitments, size 0.172, headcount 0.119 and public reach 0.068. Headcount and reach look useful alone because each is a proxy for size. Added last, both are worth 0.000 and 0.000, because size is already known. Type retains 0.348 with the record only and 0.275 when all eight attributes are verified. The second figure arises because the shortlist is formed before verification, so a better prior improves the choice of whom to verify. It is a triage value. Size contributes 0.085 through the same route.
The finding separates two decisions. Type and size help choose which prospects deserve an analyst's time. They do not help order the final wave once the gates and ordering terms are verified. A report that places headcount and reach beside the verified fields invites a reader to give them weight they have not earned in this case. Whether they earn any in real data is an empirical question that the evidence design below addresses.
15 Wave size and shortlist depth change which fields matter
The value of a field depends on how much of the list the wave consumes. Figure 5 varies the wave with the shortlist fixed at 300. At a wave of 25 approaches the three ordering terms add 1.51 commitments and the four gates add 1.42, so ordering matters about as much as elimination. At a wave of 150, the gates add 2.50 and the ordering terms 1.72. A small wave can fill itself from the top of the list, so ordering weighs as heavily as elimination. A large wave must reach into prospects that fail gates, so elimination dominates.
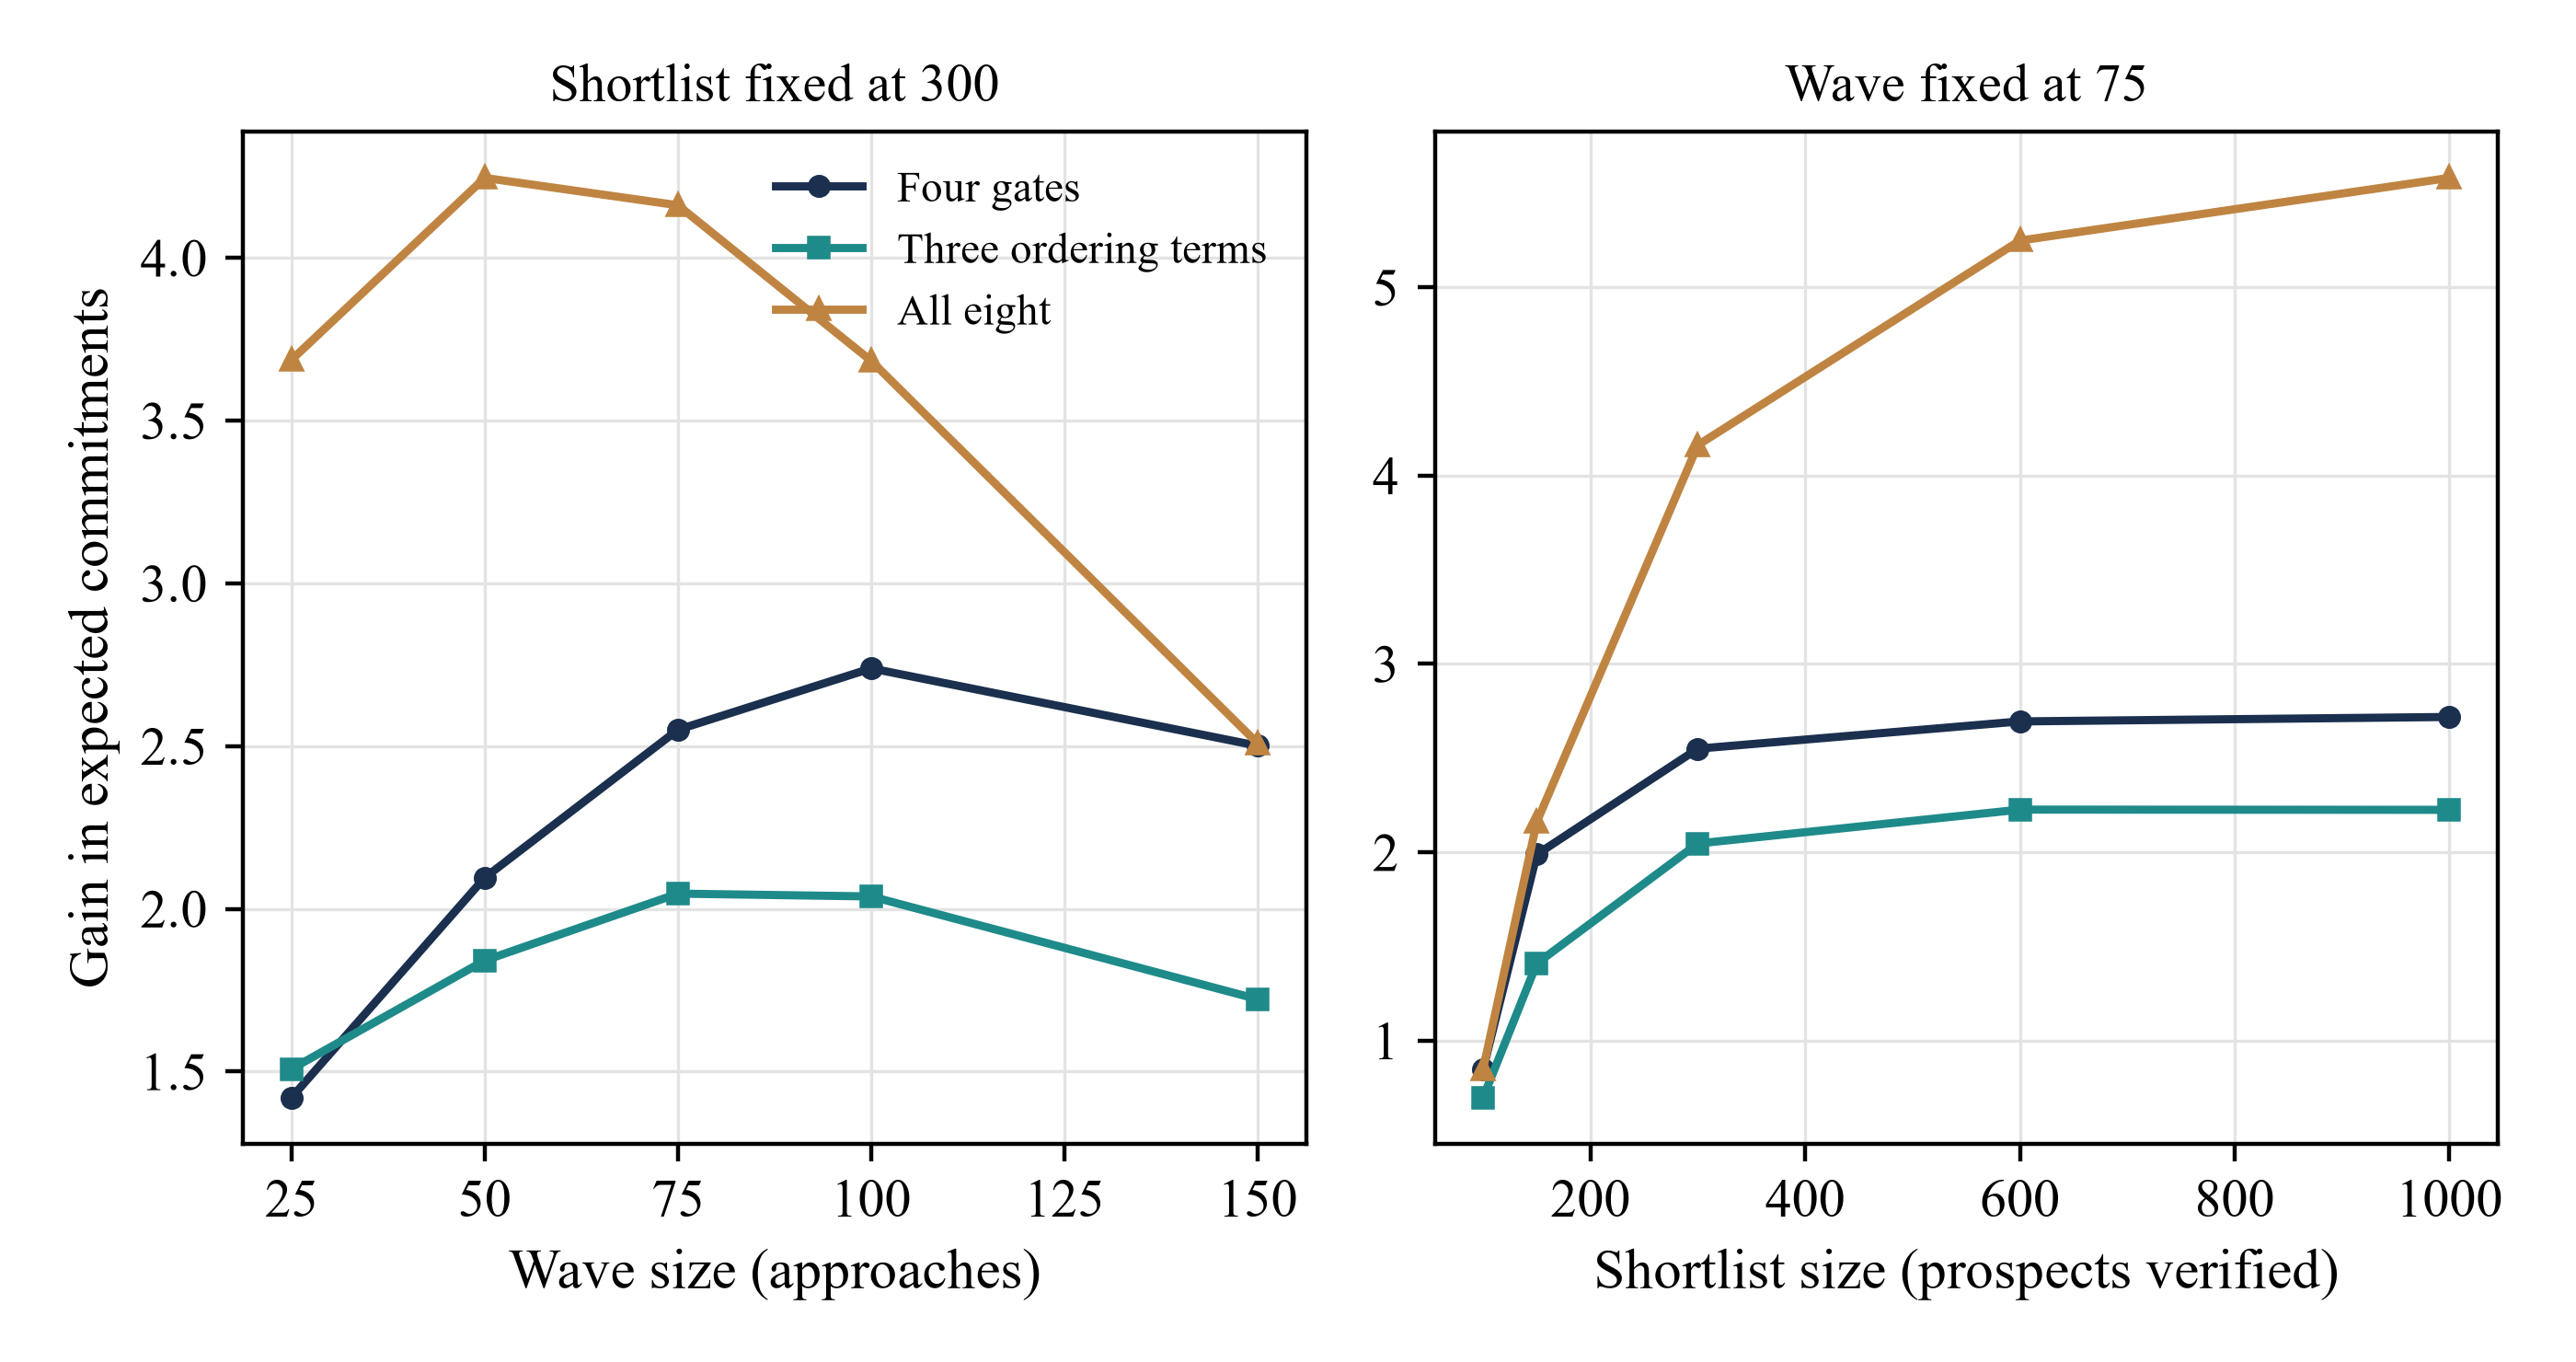
MatchPoint analysis of the constructed list. Model output under stated inputs; not an observed result. Gain over record-only for gates, ordering terms and all eight; 60 replications per point.
The right panel varies the shortlist with the wave fixed at 75. Verifying a shortlist of 100 adds 0.85 commitments, and verifying one of 1,000 adds 5.58. Gain per USD 10,000 spent is 0.63 commitments at 100, 1.07 at 150, 1.03 at 300, 0.65 at 600 and 0.41 at 1,000. Efficiency peaks at a shortlist two to four times the wave, and falls beyond it. A shortlist the size of the wave leaves nothing to choose, and a very large one buys verification of prospects that will never be reached.
The rule that follows is conditional on the inputs. Verify first the attributes that the wave size makes decisive, and size the shortlist at two to four times the wave unless the cost of verification is much lower than assumed here. A team that changes the wave size should recompute which fields to verify.
16 Stress cases suggest checks for different kinds of failure
Table 10 changes one input at a time. Stale verification redraws each gate at the approach date with probability 0.25. Verification errors flip each verified gate reading with probability 0.05 and add noise to ordering readings. The colder market raises both thresholds by 0.5. The misweighted ranker puts weight 0.20, 0.80 and 0.20 on the three ordering terms, in place of 0.70, 0.40 and 0.50. The poor and good vendor records change the accuracy of the record.
Scroll across to see all columns.
| Case | Record only | All verified | Gain | Wave unable to commit, record only | Same, all verified | True prospects wrongly eliminated | Diagnostic signature |
|---|---|---|---|---|---|---|---|
| Base inputs | 5.15 | 9.32 | 4.17 | 42% | 0.0% | 0% | Reference |
| Stale verification | 4.68 | 7.33 | 2.65 | 47% | 21.0% | 0% | Gain falls; verified-wave failures appear at approach |
| Verification errors | 5.15 | 7.49 | 2.34 | 42% | 4.7% | 18% | Gain falls; failures are invisible in the wave |
| Colder market | 2.55 | 4.35 | 1.80 | 44% | 0.0% | 0% | Gate share of gain unchanged; yield falls |
| Misweighted ranker | 3.88 | 7.30 | 3.42 | 42% | 0.0% | 0% | Gate gain nearly intact; ordering gain falls |
| Poor vendor record | 3.62 | 7.87 | 4.25 | 55% | 0.0% | 0% | Relative gain rises; gates dominate |
| Good vendor record | 8.08 | 10.49 | 2.41 | 19% | 0.0% | 0% | Gain shrinks; little left to verify |
MatchPoint analysis of the constructed list. Model output under stated inputs; not an observed result. Expected commitments in a wave of 75; 100 replications per case.
Stale verification cuts the gain from 4.17 to 2.65 and leaves 21.0 per cent of the verified wave unable to commit at approach. A team sees this as late failures among prospects it believed it had cleared. Verification errors cut the gain to 2.34. They create a hidden loss: 18 per cent of prospects that could commit are wrongly eliminated, and no one sees them. The visible sign is only 4.7 per cent late failures. Audit a sample of exclusions to look for missed eligible prospects.
The colder market lowers the gain to 1.80 and leaves the gate share of the gain at 62 per cent against 61 per cent. The split of the gain between gates and ordering terms holds while yield falls by about half. The misweighted ranker leaves the gate gain nearly intact at 2.17 but cuts the ordering gain by 45 per cent. Elimination is largely robust to wrong weights, since the gates do not use them, and reordering is not. A poor vendor record leaves the absolute gain about level at 4.25 but raises it to 118 per cent of a lower record-only yield, and a good record lowers the gain to 2.41. The value of verification rises with the weakness of the record.
Use these patterns to choose what to investigate. Late failures warrant rechecking dates and changes since verification. A large gain concentrated in gates warrants testing the vendor record against independent evidence. Weak reordering alongside sound elimination warrants checking the weights. These patterns can have several causes and cannot be diagnosed from the commitment count alone.
17 Statistical power for meetings and commitments
A real team would want to confirm that a verified ranking beats a record-only one. Table 11 gives the sample needed. In the model the record-only ranking yields a qualified meeting for 32.4 per cent of approaches and the verified ranking 63.0 per cent. Detecting that difference at 80 per cent power and a 5 per cent two-sided level needs 42 approaches per arm, and a wave of 75 per arm gives 97 per cent power. For commitments the rates are 6.9 and 12.4 per cent, and the sample needed is 443 per arm. A wave of 75 gives 21 per cent power.
Scroll across to see all columns.
| Outcome | Record-only rate (%) | Verified rate (%) | Approaches per arm for 80% power | Power at one wave per arm (%) |
|---|---|---|---|---|
| Qualified meeting | 32.4 | 63.0 | 42 | 97 |
| Signed commitment | 6.9 | 12.4 | 443 | 21 |
MatchPoint analysis of the constructed list. Model output under stated inputs; not an observed result. Two-sample test of proportions; power by simulation of 20,000 trials.
These calculations use independent approaches and assumed outcome rates. In a real campaign, shared circumstances, repeat investors and spillovers can change precision. A prospective field study should account for the unit of assignment and any clustering, then estimate its required sample with rates appropriate to the eligible population. The planning figures do not establish that verification improves outcomes.
18 Selection bias and the cost of random exploration
The confounding problem for a real dataset is selection of labels. Outcomes are observed only for prospects that an earlier ranking approached. To judge a new ranking from that history, a team sees how the prospects it would have chosen fared, but it sees outcomes only for those the old ranking also chose. Replacements, which come from lower in the old ranking, have no recorded outcome. The naive estimate averages the outcomes of the overlap and scales it to the wave.
In equation (6), W_B is the wave the new ranking would choose, A_i is one if investor i was approached in the earlier campaign, y_i is the observed meeting outcome, and π_i is the probability that i was approached. The earlier wave has π equal to one. Other shortlisted prospects are approached at random with probability ε, and then π equals ε. Equation (6b) is the inverse-probability estimator. The target is the expected meetings of the new wave, 47.09 in the model. Table 12 and Figure 6 report the errors of the two estimators.
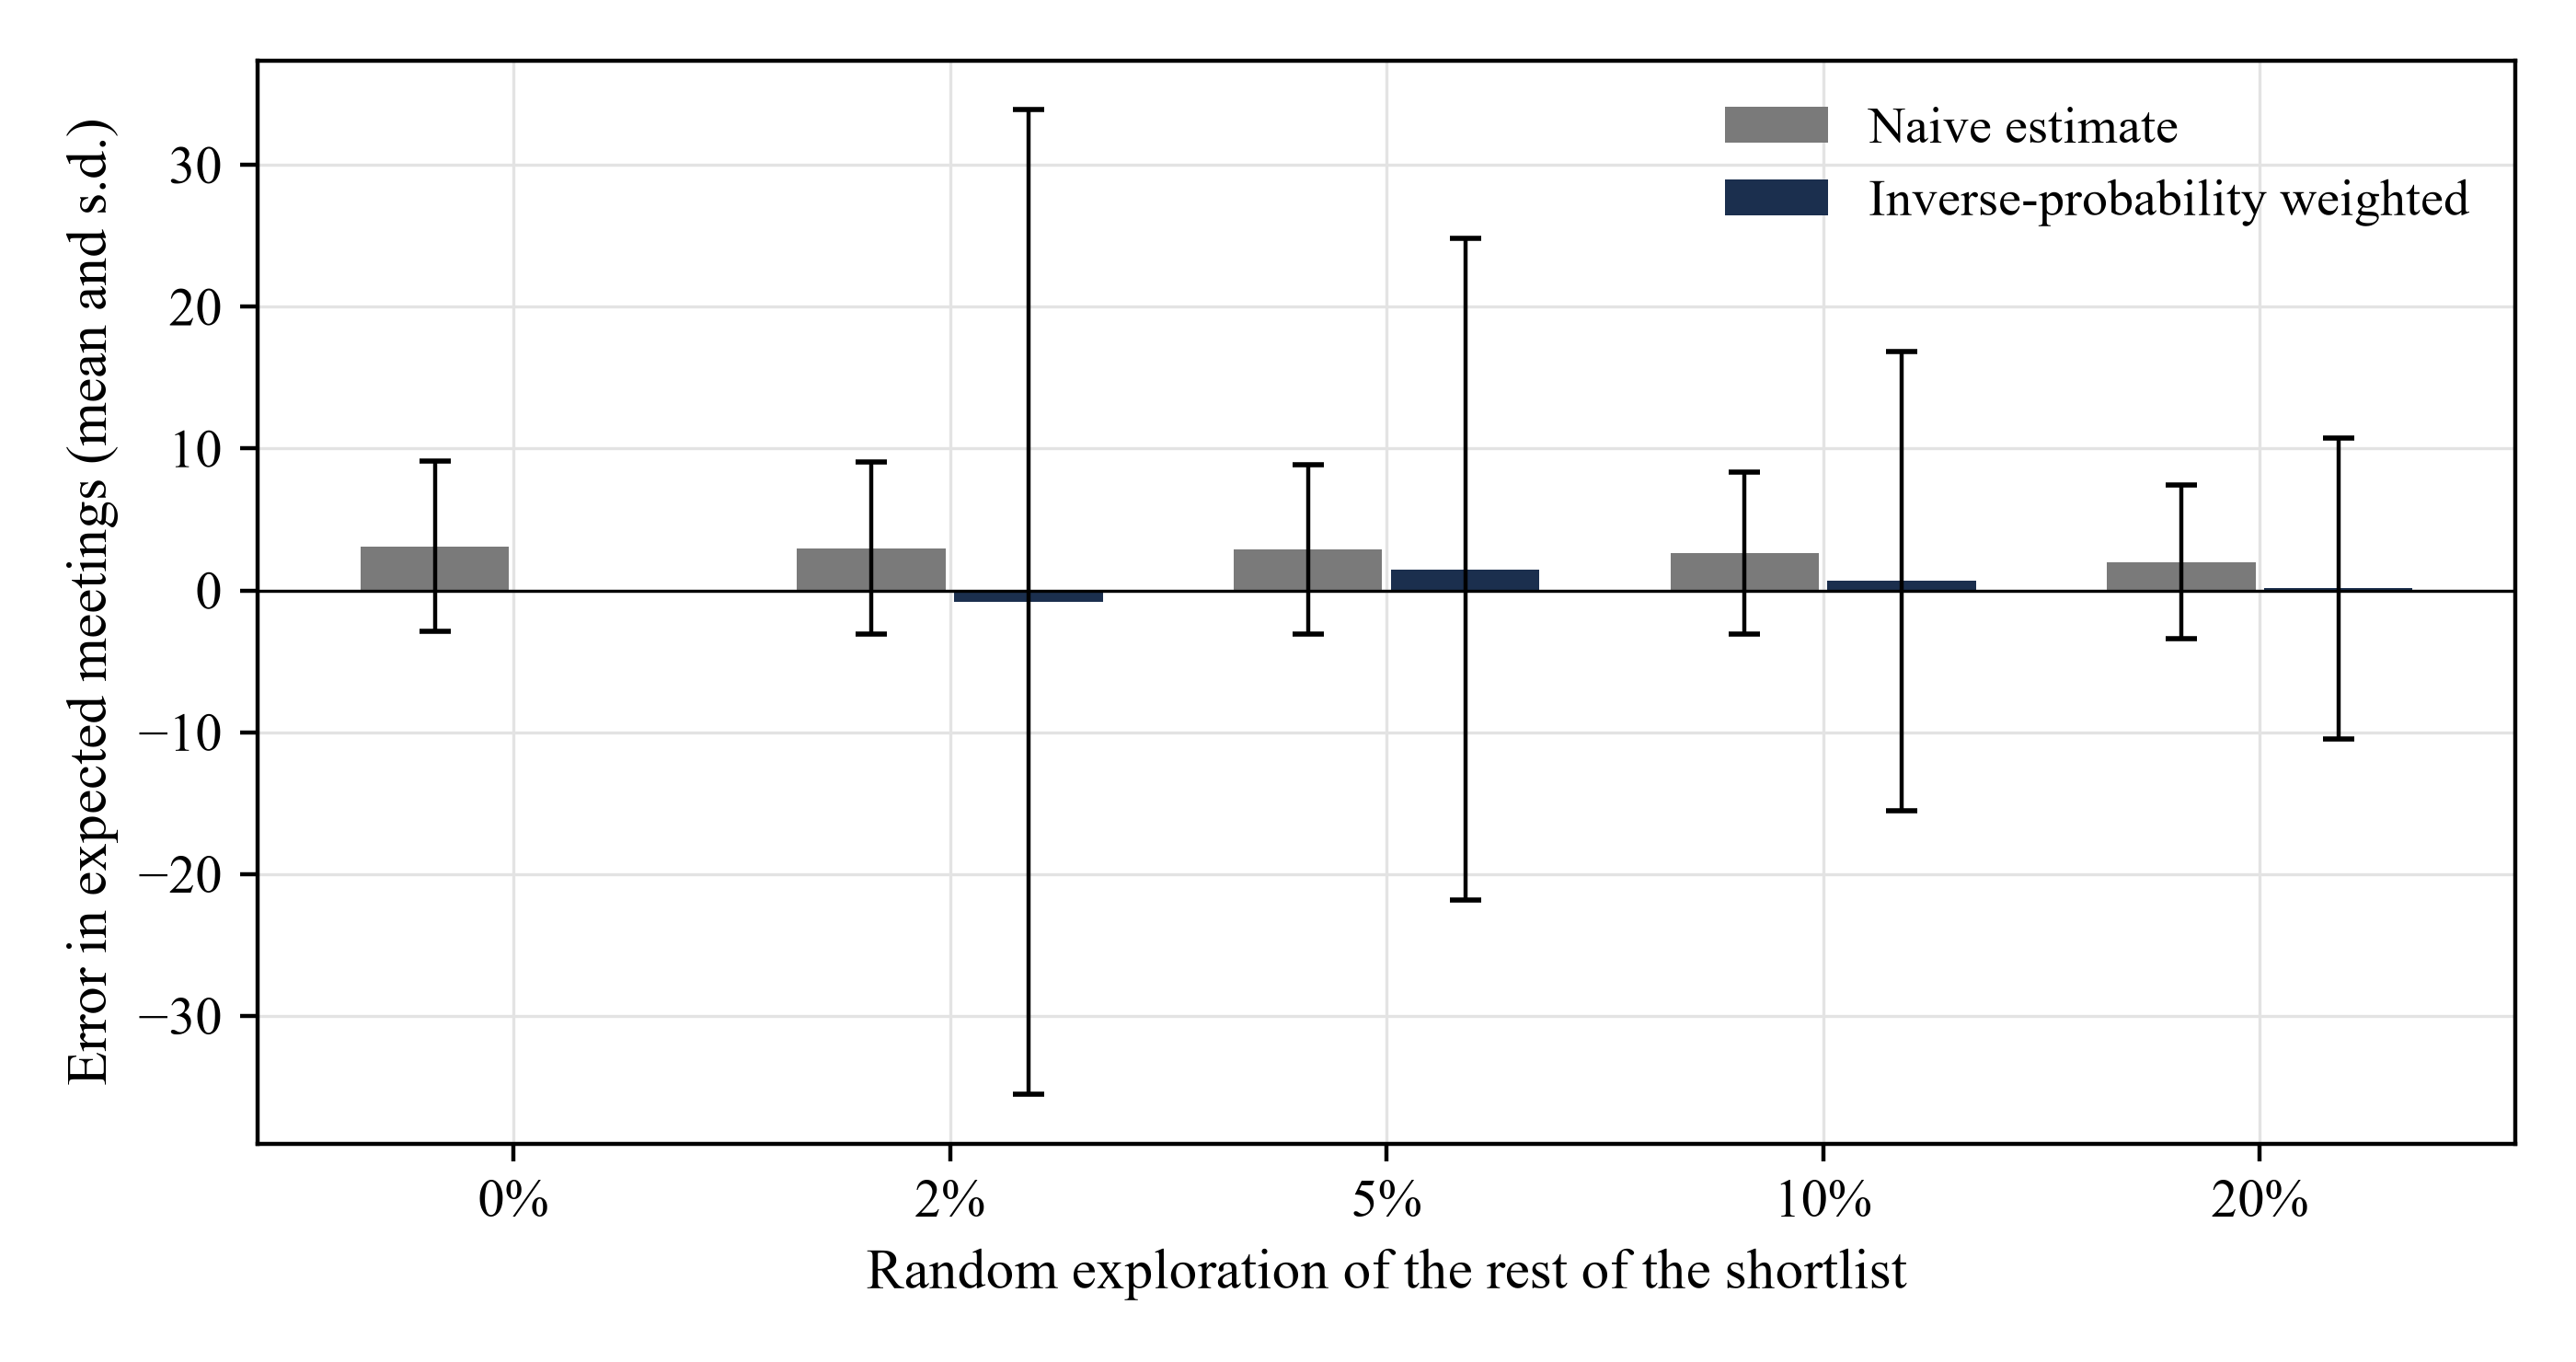
MatchPoint analysis of the constructed list. Model output under stated inputs; not an observed result. Mean error and standard deviation of estimated expected meetings, 400 replications per exploration rate.
Scroll across to see all columns.
| Random exploration of the rest of the shortlist | Extra approaches | Naive error (mean) | Naive error (s.d.) | Inverse-weighted error (mean) | Inverse-weighted error (s.d.) |
|---|---|---|---|---|---|
| 0% | 0.0 | 3.11 | 6.01 | undefined | n/a |
| 2% | 4.3 | 2.98 | 6.05 | -0.83 | 34.71 |
| 5% | 11.2 | 2.90 | 5.95 | 1.47 | 23.33 |
| 10% | 22.3 | 2.63 | 5.72 | 0.67 | 16.20 |
| 20% | 45.0 | 1.99 | 5.43 | 0.14 | 10.60 |
MatchPoint analysis of the constructed list. Model output under stated inputs; not an observed result. Error is the estimate less the true expected meetings of the new wave.
The naive estimate overstates by 3.11 meetings, 7 per cent of the target, with no exploration, and the bias falls slowly as exploration rises. The inverse-probability estimator is unbiased at 20 per cent exploration within sampling error but very noisy: its standard deviation is 10.60 meetings against 5.43 for the naive estimate. Its root mean square error at 20 per cent is 10.59 against 5.78 for the naive estimate. Without exploration the weighted estimator cannot be formed, and summing the observed outcomes unweighted gives an error of -25.58 meetings. At the scale of one campaign, the correction removes a bias smaller than the noise it adds.
In this simulated experiment, 20 per cent exploration adds 45.0 approaches, more than half the base wave of 75. Sampling covers the remaining shortlist in the constructed population. A real study must restrict possible outreach to prospect-route pairs independently cleared for the offering, recipient, sender and channel before randomisation. The simulation's error and capacity figures do not transfer to that screened frame.
19 Controls reconcile the model, and the circularity of the premise is stated
Table 13 records 44 controls. With perfect verification and stable gates, the fully verified wave matches the top true model probabilities in the shortlist and performs at least as well as each partial set in each base replication. A partial set can yield a lower expected commitment count than the record-only selection in an individual draw. The checks also cover Shapley efficiency, mean calibration and agreement between the probit formula and quadrature.
Scroll across to see all columns.
| Control | Result |
|---|---|
| Control identities asserted in the model | 44 pass |
| Full verification benchmark in the base case | Matches the best shortlist wave and exceeds or ties each partial set |
| Shapley values reconcile to the total gain | Sum equals gain to 1e-9 |
| Record-only score is calibrated | Mean prediction within 3% of mean true probability |
| Probit expectation identity | Closed form equals quadrature to 1e-9 |
| Inverse-probability estimator | Unbiased at 20% exploration within four standard errors |
| Replications | 200 main, 100 stress, 80 descriptive, 60 grid, 400 selective-label |
| Random seed | 20261014 plus replication index |
MatchPoint analysis. Controls are asserted in the model code and run on every execution; a failure stops the run.
The central circularity is stated plainly. Outcomes are generated from the same attributes the ranker uses, and the ranker knows the weights. The experiment therefore shows how the method behaves when the attributes drive commitment as assumed. It does not show that mandate, strategy fit or any other attribute does drive commitment in a real placement. The decoration result follows from construction, since headcount and reach were given no effect. A real report might find that some such field does carry information, and only data can settle that.
The experiment also omits several features of real campaigns: correlation among gates, learning across waves, investor response to the adviser's reputation, the effect of timing, and a loss function that prices regulatory exposure. The sibling questions of capacity, timing and sequence are outside this paper, and a full model would join them.
20 A real study needs timestamped, consented records, a random slice and a pre-specified analysis
A study to replace the authored inputs needs a unit, a clock and an outcome definition. The unit is the prospect in a campaign. The clock starts when the field is verified and ends when the commitment is signed or the campaign closes. The outcomes are a qualified meeting, entry into formal diligence and a signed commitment, each with a timestamp. Table 14 lists the design.
Scroll across to see all columns.
| Element | Requirement | Reason |
|---|---|---|
| Unit and record | Prospect-campaign pair with source, reader and date for every field | Separates stale from wrong fields |
| Lawful basis and minimisation | Stated purpose for each personal field; retention limit | Data protection principles [12, 15] |
| Randomised slice | Pre-screen lawful prospect-route pairs; randomise within the cleared frame and log inclusion probabilities | Supports inference within the screened population |
| Verification audit | Random sample of eliminated prospects re-verified independently | Measures hidden false eliminations |
| Outcome stages | Meeting, diligence entry, commitment, each timestamped | Commitments are rare |
| Pooling | Use a design-specific sample size with campaign clustering and observed eligible-frame rates | Power for the rarest outcome |
| Analysis plan | Fixed before data: attribute values by Shapley and by last-in, with intervals | Avoids selection of results |
Proposed design. It describes data to obtain; it reports no result.
Before fieldwork, document the outreach permissions, applicable data-protection and marketing requirements, lawful basis and study permissions. Randomisation cannot confer permission to contact someone. Specify the eligible target wave in advance and log a positive, known inclusion probability for every prospect-route pair in that wave. Prespecify the exploration budget and account for campaign clustering. Audits of excluded prospects can use documentary review without contacting them.
The analysis would estimate the same quantities as the model, each with an interval: gain by attribute, gain per dollar, and the effect of the random slice on the estimate. It would test the model's premises directly, in particular whether any descriptive field carries independent weight and whether gate failures are as costly as assumed.
21 Report the fields to the client or committee as a verified table with its cost and its audit
A client or an investment committee should see the report as a decision, not as an inventory. We propose that it state the wave size, the shortlist verified and the fields verified, with the source and date of each. It should state how many prospects each gate eliminated, how many failed late, and how many were reordered. It should show the cost in analyst hours against the expected commitments gained, with the break-even value of one commitment, as in Table 7.
The report should also show what was not verified and why. A field left as a vendor reading carries the accuracy assumed for it, and the reader should be told. The audit result for eliminated prospects belongs on the same page, because a gate that eliminates too many, as in the verification-error case, will look efficient while costing commitments. The reader should be able to ask of every number whether it is observed, verified or assumed.
Language needs care. A model result such as the gain in this paper is not a forecast of a raise. The report should present the expected number of commitments as a ranking tool under stated assumptions, and present the realised meetings and commitments only as they occur. Neither the model nor the report promises an outcome, and nothing here is advice on a particular offering.
22 Use data and AI to keep fields current, but keep gate decisions with a named person
Test automated tools on repetitive tasks such as matching mandates to strategies, extracting ticket ranges and flagging policy changes. Measure review time and errors that survive human checking before deciding where to use them. In the experiment the verification costs are inputs, and a lower cost for a field raises its place in the ladder. This paper reports no measured accuracy for any automated reader.
The model suggests where automation needs control. Stale and erroneous verification are the two failures that hide, and an automated reader can produce either at scale. A reader that misreads a mandate eliminates prospects that could have committed, and the elimination is invisible. We therefore propose that automated readings enter the report as proposals with a source link, that the eliminating decision for any prospect rest with a named person, and that a random sample of automated eliminations be checked by a human each cycle.
Evaluation of an automated reader should use the loss that the model exposes, not a generic accuracy score. A false elimination costs the expected commitments of the prospect, and a false pass costs an approach, and possibly a regulatory exposure for the eligibility gate. Any such evaluation should be run on held-out prospects and repeated when the source documents change, since a reader tuned to one year of policy language may fail on the next.
23 A decision rule for a live raise: verify gates on the shortlist, order by gain per dollar, audit the eliminations
The experiment supports a rule of work that a raiser can test against its own records. First, hold the wave to what senior time allows, and set the shortlist at two to four times the wave. Second, verify the gates on the shortlist before any ordering field, and record the source and date. Third, add ordering fields in the order of gain per dollar until the next field's expected gain falls below its cost divided by the commitment value the raiser assigns. Fourth, audit a random sample of eliminated prospects.
Three conditions would change the rule. If the vendor record is accurate, as in the good-record case, the gain from verification shrinks and the shortlist can be thinner. If the wave is small relative to the shortlist, ordering terms matter about as much as gates and should be verified alongside them. If the market is cold, yield and gain fall together and the split between gates and ordering terms holds, so the rule applies but each verification must clear a higher break-even value.
The rule is a hypothesis for a real study and not a finding of one. It follows from the constructed case, and the constructed case follows from the authored inputs. A team should apply it as a way of ordering its own work and should record the outcomes that would show it wrong: late failures among verified prospects, eliminated prospects that turn out to have been willing, and meetings that do not progress.
24 Limitations and the next decision: replace the authored weights with a logged slice
The limits are largely those of any constructed experiment. The weights, gate rates and costs are authored. The ranker knows the model. The gates are independent, the ordering terms are normal and the outcome is a single probit. No investor learns from earlier approaches, and no approach has a reputational cost. The results describe the logic of the report under those conditions and offer no estimate for the population of real investors. The ranking of attributes in particular is a function of the weights, and different weights would reorder it.
Several of the sources are narrower than the question. The field experiment concerns start-up information and angel investors, the databases study concerns venture capital data, the value-of-information papers concern health technology and the CalPERS policy illustrates the published limits of one investor, which cannot be generalised to other investors. Each supports a category of reasoning. None supplies a value for any input. The regulatory texts are as read on the dates stated and were not tested against any offering.
Start with a documentary audit of elimination decisions and the costs of verifying each field. For a prospective study, clear the eligible contact frame independently, then choose an exploration rate that the team can support and that gives adequate precision for the chosen outcome. Re-estimate both gains and costs from the eligible study population before changing the template.
References
- Bernstein, S., Korteweg, A. and Laws, K. Is it Just the Idea that Matters? A Randomized Field Experiment on Early Stage Investments. Working paper draft, March 2014, read in full. Published as Attracting Early-Stage Investors: Evidence from a Randomized Field Experiment, Journal of Finance 72(2), 2017, doi 10.1111/jofi.12470, of which only the abstract was read. https://www.haas.berkeley.edu/wp-content/uploads/BernsteinKorteweg_032314.pdf
- Gompers, P., Gornall, W., Kaplan, S. and Strebulaev, I. How Do Venture Capitalists Make Decisions? NBER Working Paper 22587, September 2016. https://www.nber.org/system/files/working_papers/w22587/w22587.pdf
- Guyon, I. and Elisseeff, A. An Introduction to Variable and Feature Selection. Journal of Machine Learning Research 3, 2003, pp. 1157-1182. https://www.jmlr.org/papers/volume3/guyon03a/guyon03a.pdf
- Heath, A. and Baio, G. Calculating the Expected Value of Sample Information using Efficient Nested Monte Carlo: A Tutorial. arXiv:1709.02319. Health-economic setting. https://arxiv.org/pdf/1709.02319
- Bindels, J. et al. Use of Value of Information in Healthcare Decision Making: Exploring Multiple Perspectives. PharmacoEconomics, 2015. Findings concern the Netherlands. https://repub.eur.nl/pub/79197/2015-12-07-033.pdf
- Kaplan, S. and Lerner, J. Venture Capital Data: Opportunities and Challenges. NBER Working Paper 22500, August 2016. https://www.nber.org/system/files/working_papers/w22500/w22500.pdf
- Lerner, J., Schoar, A. and Wong, W. Smart Institutions, Foolish Choices? The Limited Partner Performance Puzzle. NBER Working Paper 11136, February 2005. Abstract and introduction only. https://www.nber.org/system/files/working_papers/w11136/w11136.pdf
- United States Securities and Exchange Commission. 17 CFR 230.506, Exemption for limited offers and sales without regard to dollar amount of offering, paragraph (c). eCFR current text, read 14 October 2026. https://www.ecfr.gov/current/title-17/chapter-II/part-230/section-230.506
- United States Securities and Exchange Commission. 17 CFR 230.501, Definitions and terms used in Regulation D, paragraph (a). eCFR current text, read 14 October 2026. https://www.ecfr.gov/current/title-17/chapter-II/part-230/section-230.501
- Dubai Financial Services Authority. DFSA Rulebook, Conduct of Business Module (COB), version 51 (COB/VER51/07-26), rules 2.3.2 to 2.3.4 and guidance. Consolidated version, current when read on 14 October 2026. https://dfsaen.thomsonreuters.com/sites/default/files/net_file_store/DFSA1547_12383_VER510726.pdf
- California Public Employees’ Retirement System. Public Employees’ Retirement Fund Investment Policy, effective 1 July 2026, Appendix 4, Private Equity: Partner Relationship Exposure. https://www.calpers.ca.gov/documents/202606-invest-agenda-item05a-10-a/download
- United Kingdom. Regulation (EU) 2016/679 as it forms part of United Kingdom law, Article 5(1)(c) and (d). legislation.gov.uk. https://www.legislation.gov.uk/eur/2016/679/article/5
- Institutional Limited Partners Association. ILPA Due Diligence Questionnaire 2.0, updated November 2021. Voluntary industry tool. https://ilpa.org/wp-content/uploads/2021/11/ILPA-DDQ-2.0.pdf
- California Public Employees’ Retirement System. Investment Committee Meeting Summary, 15 June 2026, approval of Agenda Item 5a, Total Fund Policy Review. https://www.calpers.ca.gov/documents/202606-full-agenda-item7a-invest-committee-summary/download?inline=
- Dubai International Financial Centre. Data Protection Law, DIFC Law No. 5 of 2020, consolidated version of July 2025, Article 9(1). https://edge.sitecorecloud.io/dubaiintern0078-difcexperie96c5-production-3253/media/project/difcexperiences/difc/difcwebsite/documents/laws--regulations/data-protection-law.pdf
About the Author
Chennakeshav (CK) is a corporate finance and investment banking executive with 25+ years of global experience in deal origination, structuring and execution across M&A, growth capital and corporate strategy. He has led value-creation mandates for founders, corporates and funds — bridging the boardroom view to hands-on execution and close.
His career spans Morgan Stanley, HSBC, Lloyds Banking Group, EWEC, ADQ portfolio companies and Emirates Growth Fund, across TMT, real estate, fintech, deeptech, cleantech, infrastructure and energy. He has partnered with C-suite leaders, private equity and venture funds, sovereign wealth funds and family offices to finance complex fund raises and scale-up ventures, and has led M&A due diligence, post-merger integration and business-transformation initiatives to create value.
At Matchpoint Partners he is Managing Partner, leading the firm's corporate finance, M&A and capital-raising practice. He holds an MBA from London Business School, an engineering degree from VTU and a Master of Laws (LLM, in progress) from UCL London.
An active start-up mentor, CK mentors at Techstars, DIFC FinTech Hive, Startup Grind, Founder Institute and IN5, serves as Entrepreneur Mentor in Residence (EMiR) at London Business School, and judges the Entrepreneurship World Cup.
https://www.linkedin.com/in/ckadya/
https://www.matchpoint-partners.com/team/ck-adya.html
Disclaimer
This paper is part of a continuing series on the structure of private and alternative markets. The views expressed are the author's own. The paper is for information only, describes market structure in general terms, and does not constitute investment, legal, tax or regulatory advice or a recommendation in respect of any security, vehicle or counterparty.
