

1 The decision: release the whole list at once, or order the approach
A raise draws on investors in several jurisdictions and several kinds of mandate. The sponsor or manager has one senior team, one set of documents and one reputation. The decision is whether to approach every name together, or to approach them in ordered waves by jurisdiction and mandate type, with each wave informed by the one before. Founders, chief financial officers and sponsors raising private capital face this choice, as do fund managers raising from limited partners across the Gulf Cooperation Council and beyond. This paper tests the choice on a constructed list of 240 investors and a raise target of USD 200 million.
No dataset of timestamped outreach cohorts is held by the author, so no observed conversion rate is reported. The framework is built from the marketing regimes that govern when and how an investor may be approached [1, 2, 3, 4, 5, 6, 7], from fund-closing conventions and practitioner timetables [8, 9], and from research on how investors learn from each other [10, 11, 12, 13]. The experiment then runs seven outreach designs on identical random draws and reports what follows when the stated mechanisms are true. It states plainly where the result is a property of the assumptions.
The contribution is a decision framework, a reproducible experiment and a specification of the evidence a real study would need. The experiment shows when ordered waves beat simultaneous release in the constructed case, by how much, compared with random waves and full-information ranking, and under which stress each advantage disappears. The paper does not estimate a real conversion rate, a recommended number of weeks between waves or the effect on any live mandate.
The Gulf lens matters because a list that spans the Gulf and the wider world is exposed to several rulebooks and several decision clocks at once. A sovereign or institutional allocator in one jurisdiction, a family office in another and a fund of funds in a third differ in the route by which they may be approached, in how long they take to decide and in how far they are likely to hear of each other's responses. The paper treats those differences as inputs, and asks what ordering follows from them.
2 Define the outcome first: signed commitments at dated checkpoints
A sequencing rule can only be judged against a dated outcome. We count a first meeting as qualified when it opens a diligence file. We count diligence as progressed when the investor gives a soft commitment, and a commitment as signed when documentation follows, which the model assumes happens for 92% of soft commitments after a four-week lag. The primary measure is signed commitments as a share of the raise target at week 52 from launch. Weeks 26 and 78 are reported alongside, because the benefit of ordering is a matter of timing as well as total.
The checkpoints follow the structure of a fund close. A first close is taken as signed commitments of USD 30 million, 15% of the target, and the experiment reports the share of replications reaching it by weeks 26 and 52 and the median week in which it occurs. The 78-week horizon is a 26-week run to first close followed by a 52-week closing period, which matches the 12-month example that an industry standard gives for the period after an initial close [8]. A high-fit refusal, defined as a refusal at first meeting by an investor whose true fit is at least 0.6, is counted as a burned relationship.
Counting signed demand, not capped closings, keeps the comparison simple. A real fund has a hard cap, and an issuer has a maximum raise. Results near or above the target should be read as demand exceeding the target. The measures say nothing about price, terms, the quality of the investors who commit or the cost of capital, all of which a live decision would also weigh.
3 Gulf perimeters decide who may be approached and by which route
The Dubai Financial Services Authority defines a financial promotion as a communication that invites or induces a person to enter into a financial services agreement or deal in a financial product. GEN 3.4.1 exempts a promotion directed at, and capable of acceptance exclusively by, a person who appears on reasonable grounds to be a deemed professional client of a type specified in the conduct rules. A separate exemption covers a promotion to a recipient in the Dubai International Financial Centre resulting from that recipient’s unsolicited request to receive the promotion. A promotion intended only for professional clients must not go to anyone who appears not to be one, and must say that only such a person should act on it. The guidance adds that promoting regularly or for a prolonged period while physically in the centre may be treated as carrying on a financial service [1].
Section 18 of Abu Dhabi Global Market’s Financial Services and Markets Regulations restricts a person from communicating an invitation or inducement to engage in investment activity in the course of business. Among the routes listed are communications by an Authorised Person or Exempt Person; communications by a person licensed and supervised by a financial services regulator in the United Arab Emirates; content approved for section 18 by an Authorised Person or Exempt Person; and an applicable Schedule 2 exemption. A communication originating outside the market falls within the restriction only if it can have an effect there. Schedule 2 distinguishes solicited and unsolicited real-time communications from non-real-time communications such as letters and email [2].
Saudi Arabia’s Capital Market Authority rules, as amended in January 2026, generally require a licensed arranger and notification at least ten days before a securities private placement. A shorter notification period is available for specified debt offers if notice is given before the offer begins and the domestic offeror or special-purpose entity meets the conditions in Article 10(a)(2). Articles 8 and 9 address offers to institutional and qualified clients and limited offers. A limited offer may include up to 100 other offerees paying up to SAR 200,000 each, or the equivalent. The same class of securities may be offered by limited offer only once in twelve months [3]. The separate fund rules are outside this review.
In the onshore United Arab Emirates, the Capital Market Authority replaced the Securities and Commodities Authority from 1 January 2026. Article 6 of the regulator’s rules for promotion states that foreign fund units may be promoted by private offering to Professional Investors or Counterparties. The product, recipient classification and promoter’s authority still need to be checked for each approach. The cited provisions do not establish the six-week lead time used in the simulation [4].
4 UK, EU and US routes turn on professional status and on how first contact is made
Article 19 of the United Kingdom’s Financial Promotion Order provides two applicable routes: the communication is made to recipients whom the sender reasonably believes are investment professionals, or it may reasonably be regarded as directed only at investment professionals. The prescribed indications and other factors support the second test, but none is invariably required. The article sets no lead time. Record the basis for the limb relied on before sending the communication [5].
Article 30a permits an authorised EU alternative investment fund manager to pre-market to potential professional investors subject to conditions, including that the information cannot enable an investment commitment or amount to subscription documents. The manager must inform its home authority by informal letter within two weeks of starting. For a professional investor who subscribes within 18 months of the start, the subscription is treated as resulting from marketing and subject to the applicable notification procedures if the fund was referred to in the pre-marketing information or established as a result of it [6]. National private placement rules are outside this review.
In the United States, Rule 506(b) is subject to Rule 502(c)'s prohibition on general solicitation. Its purchaser limit is 35 countable purchasers in any 90-calendar-day period, subject to the issuer's reasonable belief and the counting exclusions in Rule 501(e), including accredited investors. Non-accredited purchasers must satisfy the sophistication condition in Rule 506(b), which also permits the issuer to rely on reasonable belief immediately before the sale. Rule 506(c) permits general solicitation if all purchasers are accredited and the issuer takes reasonable steps to verify that status [7]. Plan the method of first contact and the verification workflow separately. The cited Rule 506(c) provisions do not prescribe a first-meeting deadline.
Table 1 compares the seven routes with the lead times used in the simulation. All lead times are scenario inputs stated in whole weeks. The two-week Saudi input represents the general ten-day pre-offer notification rule for the securities route discussed here. It does not model the shorter-notice debt exception, establish a fund marketing timetable, or confer permission to approach an investor.
Scroll across to see all columns.
| Route | What the text establishes | What it does not establish | Lead time used (weeks) |
|---|---|---|---|
| DIFC | Promotion to deemed professional clients exempt if directed only at them; statement required [1] | Time to confirm status; fund-specific offer rules | 1 |
| ADGM | Promotion restriction with listed exemptions; reach tied to effect in the market [2] | Which exemption suits a given approach; time to prepare | 1 |
| UAE onshore | Private promotion of foreign fund units to Professional Investors or Counterparties [4] | Time to confirm route, status and promoter authorisation | 6 |
| Saudi Arabia | Licensed arranger; normally ten days’ pre-offer notice; shorter notice for specified debt offers [3] | Fund-unit rules; time to appoint the arranger | 2 |
| United Kingdom | Reasonable belief about recipients or communication reasonably directed only at investment professionals [5] | Time to verify status; fund-promotion limits | 2 |
| European Union | EU AIFMs: two-week letter; 18-month marketing treatment for subscriptions to the relevant AIF [6] | National private placement rules | 2 |
| United States | 506(b) no general solicitation; 506(c) verification of accredited status [7] | Time to verify; state law | 3 |
Primary rule texts as cited [1–7]. The final column contains scenario inputs. It does not state statutory lead times.
5 Fund-closing rules and investor timetables set the dates by which a wave must pay
The Institutional Limited Partners Association principles of 2019 state that the fundraising period should end within a reasonable time after the initial close, for example 12 months. They add that interest should be charged on investors who commit between the initial and final close and credited to the investors in the initial close, and not treated as an asset of the fund [8]. The principles are voluntary. They show that an early commitment can be compensated, and that the period during which a late wave can still join is bounded by contract.
Practitioner descriptions of the closing timeline are consistent with that structure. A law-firm presentation of August 2014 states that marketing can take from six months to over a year, that negotiating terms typically takes about three to six months, and that additional closings may occur over around a year [9]. It is a dated deck and not a survey. It gives a range, not a distribution, and says nothing about differences by jurisdiction or mandate.
The experiment therefore assumes median decision times of 24 weeks for institutional investors, 8 weeks for family offices and 15 weeks for funds of funds and corporates, counted from the first qualified meeting. These are authored inputs informed by, and not drawn from, the practitioner range. This study did not locate a published decision timetable from an investor in the Gulf or elsewhere. The consequence is that every timing result in the paper is conditional on an assumed timetable, and the sensitivity of results to the timetable is a first item for any real study.
The experiment assumes that a raise which has not reached a first close within the period investors expect carries a signal of its own. An industry standard also provides that a later joiner should bear an interest charge [8]. The experiment does not model the charge. It models the weaker idea that appetite falls as a process ages, through the freshness term, and it tests how much the result depends on that term. The point for a real raise is that closing conventions and contract terms, not only investor behaviour, give timing a price.
6 Order carries information, but the evidence is narrow and partly contrary
Theory gives sequencing a reason to matter. In the standard model of information cascades an individual who observes the actions of those ahead may rationally follow them regardless of private information. A review by the originators of the literature reports that cascades are fragile to small shocks, that they tend to form quickly even when agents are ordered by inverse precision, and that placing the better-informed agent first can start a cascade at once that rests on a single signal and so reduces accuracy. It also notes that when observing predecessors is costly, early agents can become sacrificial lambs for later ones [10].
The same review describes a seller offering units in sequence at a fixed price, in the manner of an initial public offering. Demand in that setting is fragile: a few early negative signals can cause buying to collapse, and the review cites evidence that offerings tend to be heavily over or under subscribed [10]. These results are for binary signals and identical buyers. They establish that order can change outcomes and that outcomes can be path-dependent. They do not establish the size of the effect for heterogeneous limited partners with long internal processes.
Empirical work is thin and points in more than one direction. A study of equity crowdfunding finds that the size of the most recent pledge and the time since it predict the next pledge, most strongly for less-informed investors [11]. A study of failed house auctions finds that a property that fails to sell later sells at a 2.6% discount, larger after repeated failure and fading over time, which the authors attribute to stigma [12]. Neither concerns institutional investors.
The closest study to this paper's question is a randomised field experiment in which nearly 17,000 emails were sent to about 4,500 early-stage investors. The average investor responded strongly to information about the founding team but not to information about traction or existing lead investors [13]. It randomised what investors saw, not when they were approached, and its investors were early-stage backers. For the average investor, its result gives no support for assuming that lead-investor information moves investors, which is why one stress case in this paper removes the anchor effect.
7 Sequence by jurisdiction and mandate cell, and gate each wave on evidence
The proposed rule assigns each jurisdiction and mandate cell to a wave. With five jurisdictions and three mandate types there are fifteen cells. Each cell receives a readiness index equal to the mean recorded fit of its investors, multiplied by the typical ticket for its mandate type and divided by the sum of its regulatory lead time and its typical decision time. Cells are ranked by the index, and whole cells enter waves holding about 30%, 35% and 35% of the list. A cell is never split across waves, so that a team can explain every wave in one sentence.
The gate for the next wave is a review of the refusal log and the feedback gathered, not a calendar date. The experiment uses a fixed gap of 6 weeks only because a model needs a rule. Table 2 lists the criteria that the readiness index and the gate draw on. Ranking individual investors is a separate question, and the experiment uses an investor-level ranking as a comparator to show how the cell rule performed against one ranking that uses inputs unavailable to a deal team.
Two further features are deliberate. It averages recorded fit over a cell, so that noise in any one investor's record matters less than a systematic error in the team's view of a whole cell, which the stress case on wrong cell beliefs tests. A longer regulatory lead lowers the score when the other inputs are held constant. A long-lead cell can still rank earlier if its other inputs outweigh the delay. The first approach occurs at the later of the wave start and the regulatory lead time.
Scroll across to see all columns.
| Criterion | Measure | Direction | Evidence a team must hold |
|---|---|---|---|
| 1. Mandate fit | Mean recorded fit of the cell | Higher goes earlier | Published mandate and past commitments |
| 2. Ticket capacity | Typical commitment by mandate type | Larger goes earlier | Stated ticket range |
| 3. Decision time | Typical weeks from first meeting to decision | Shorter goes earlier | Prior process length with the investor |
| 4. Regulatory lead | Weeks before the route is open | Shorter goes earlier | Route and recipient status record |
| 5. Peer visibility | Share of cell refusals seen by other cells | High visibility goes later | Known networks and co-investment ties |
| 6. Anchor potential | Ability to supply an early lead commitment | Higher goes earlier | Prior lead commitments |
| 7. Staleness exposure | Cost of waiting for the cell | Higher goes earlier | Window and deadline evidence |
Proposed matrix; no weight is supplied by any source. The experiment uses criteria 1 to 4 in the readiness index and criteria 5 to 7 in the gate review and the stress cases.
8 Record every approach as a timestamped, consented event
A sequencing claim can be tested only if each approach is a dated event with known status. We propose one record per investor and approach, holding the route, the recipient's status and the basis for it, the wave, the planned and actual approach dates, the first-meeting date, the diligence-open and soft-commitment dates, the signing date, any refusal with its reason, and the senior hours spent. The record is also the evidence that the approach met the perimeter in Table 1.
Consent and data protection shape what can be stored and analysed. The United Arab Emirates federal personal data protection law, in force from 2 January 2022, prohibits processing personal data without the consent of its owner, subject to listed exceptions, and the DIFC data protection law is listed separately on the official portal [15]. For the United Kingdom, the regulator's guidance distinguishes individuals, who need specific consent unless the soft opt-in applies, from corporate bodies, who may be emailed, and requires that the sender not conceal its identity [16]. These sources are portal and guidance summaries and not the texts of the laws.
The practical rule is to record institutional contacts in their business capacity, to keep personal data to what the approach needs, and to obtain advice on the lawful basis before analysing the log. Table 3 sets out the record. A study that cannot show consent for the data it uses should not be reported.
Scroll across to see all columns.
| Field | Content | Purpose |
|---|---|---|
| Investor and cell | Jurisdiction, mandate type, tier | Defines the cell and the wave |
| Route and status | Route used, recipient status, basis | Shows the perimeter was met |
| Wave and dates | Assigned wave, planned and actual approach date | Measures delay and drift |
| Meeting | Date, qualified or not, senior hours | Measures load and the first outcome |
| Diligence | Open date, requests, soft commitment date | Measures progression |
| Signing | Date, amount, conditions | Measures the final outcome |
| Refusal | Date, stage, stated reason, peers aware | Feeds contagion and learning |
| Consent | Basis and date for each personal data field | Allows the log to be analysed |
Proposed record. Entries describe information to obtain; they are not findings. Legal basis for each field must be confirmed locally. [15, 16]
9 A constructed investor list with stated generating inputs
The list holds 240 investors in five jurisdictions and three mandate types, drawn afresh in each of 1,000 replications from a fixed seed. The simulation draws latent fit from a beta distribution, applies a jurisdiction shift and clips the result to the interval from zero to one. Mean latent fit is 0.42. The recorded readiness score adds noise with standard deviation 0.12 to latent fit, then clips the score to the same interval. Its correlation with latent fit in the main simulation is 0.86. Tickets are lognormal with medians of USD 12.0, 2.5 and 6.0 million by mandate type, giving a mean of USD 6.9 million and a list total of about USD 1,657 million against a target of USD 200 million.
Table 4 gives the composition and Table 5 the full input register. Every value is an authored model input. None is a market observation. The inputs were set so that simultaneous release reaches roughly half the target by week 78, which leaves room for both gains and losses, and the conclusions are tested across ranges in later sections. The register is also the list of assumptions a real study should replace first.
Replications share their draws. For each replication the same investors, tickets, decision times, response delays and uniform draws for each stage are used under every design, so a difference between designs comes from the design and not from a different list. The unit of uncertainty is the replication, which stands for one possible list of the same composition. The ranges in later tables are therefore ranges across such lists, and not confidence intervals for a real campaign.
Scroll across to see all columns.
| Jurisdiction of the investor | Regulatory lead (weeks) | Share of list | Mean fit | Investors: institutional / family office / fund of funds |
|---|---|---|---|---|
| DIFC and ADGM | 1 | 25% | 0.46 | 17 / 27 / 16 |
| UAE onshore | 6 | 15% | 0.44 | 10 / 16 / 10 |
| Saudi Arabia | 2 | 20% | 0.45 | 13 / 22 / 13 |
| UK and EU | 2 | 25% | 0.39 | 17 / 27 / 16 |
| United States | 3 | 15% | 0.33 | 10 / 16 / 10 |
MatchPoint analysis of the constructed case. Model output under stated inputs; not an observed result.
Scroll across to see all columns.
| Input | Value | Status |
|---|---|---|
| List, target, horizon | 240 investors; USD 200 million; 78 weeks | Authored |
| Senior capacity | 14 units a week; a diligence file uses 0.3 unit | Authored |
| First-stage probability | (0.10 + 0.80 x fit) times quality, freshness, cooling | Authored |
| Second-stage probability | (0.12 + 0.75 x fit) times modifiers; cap 0.95 | Authored |
| Distributions | Fit beta(2.0, 3.2) plus jurisdiction shift; log-sd 0.5 on tickets, 0.3 on decision times | Authored |
| Pitch quality | From 0.80 to 1.00 with scale 40 meetings, frozen at approach | Authored |
| Staleness and cooling | 0.45 loss over the horizon after week 12; 0.03 a week of queue wait | Authored |
| Refusal contagion | 0.05 per recent refusal seen; weekly retention 0.92; 60% type, 40% jurisdiction | Authored |
| Anchor effect | Uplift 0.30 on diligence and 0.15 on first meetings once USD 24 million is soft | Authored |
| Waves | Three waves, shares 30%, 35%, 35%; gap 6 weeks | Authored |
| Random seed and replications | 1381; 1,000 main, 400 stress, 250 grid | Fixed |
Entirely authored inputs; none is an observation. Units: weeks, USD million, probabilities as stated.
10 Senior time makes simultaneous release a queue
The first equations set each investor's earliest approach week and the capacity of the senior team. In Equation 1a, a_i is the approach week of investor i, w(i) the wave, g the gap in weeks and L the regulatory lead time of the investor's jurisdiction. In Equation 1b, e_i is the week from which the investor can be met, and omega_i is a response delay of one week plus a Poisson number with mean 1.5. An investor is met on the first week in which a meeting slot is free, in order of e_i, with ties broken at random.
Meeting slots and diligence share the same senior time. In Equation 2a, c_t is the number of first meetings held in week t, K the weekly capacity in units, delta the load of a diligence file, n_t the number of open files and c_min the minimum of one slot. In Equation 2b, s_t is the share of a normal week of diligence progress achieved, where m_t is the number of meetings held. Each open file has a remaining clock that falls by s_t each week and reaches a decision when it is exhausted.
Under simultaneous release every investor is ready within a few weeks, so the queue sets the meeting date. The mean wait from readiness to meeting is 12.4 weeks under simultaneous release and 11.5 weeks under the cell rule. Simultaneous release is therefore an unordered queue, not a simultaneous meeting, and investors left waiting cool at 0.03 a week. This is a construct of the model. A team with more capacity, or fewer names, would have a shorter queue, as the stress cases show.
11 Quality, freshness and fit set the first and second stage probabilities
In Equation 3a, P1 is the probability that a first meeting is qualified, f_i the true fit, Q_i the pitch quality frozen when investor i was approached, F_t the freshness of the process at the meeting week, W_i the weeks spent waiting, lambda the cooling rate, A_t an indicator that the anchor has been reached and kappa_1 the uplift once it has. In Equation 3b, P2 is the probability that a diligence file ends in a soft commitment, where gamma is the contagion parameter, R_it the refusals visible to investor i at the decision week, defined in the next section, and kappa the anchor uplift. Both are capped at 0.95.
Equation 4a gives the pitch quality, which rises with M(a_i), the number of first meetings held before the approach week, from Q_0 to Q_max at scale k. A pitch sent at launch is at its weakest, and a later wave sends a better one. In Equation 4b, F_t is freshness, phi the loss of appetite over the horizon H, and t_0 the week from which the process is treated as stale, set at week 12. The staleness term stands in for the loss of credibility of a process that has been in the market for a long time, the stigma that an auction study reports for failed sales of a different asset [12]. It is a stylised stand-in and is not calibrated to investors.
A later wave gains pitch quality and loses freshness, so the two effects run against each other. The first-stage probability averages 25.2% of meetings under simultaneous release and 28.5% under the cell rule, and the second stage averages 23.1% and 25.5%. Fit enters both stages, so a wave rich in fit converts better, which is the ordinary meaning of readiness.
12 Visible refusals and an early anchor link investors' decisions
Refusals are visible to peers in the same mandate type and the same jurisdiction. In Equation 5a, R is the stock of refusals for a segment, decaying with weekly retention rho and adding the refusals r_t of the week. In Equation 5b, R_it is the exposure of investor i, a weighted sum of the stock of its mandate type and of its jurisdiction, with weights of 0.6 and 0.4. Each recent refusal seen lowers the second-stage probability by the factor e to the minus gamma, as Equation 3b shows.
The anchor effect works through a single indicator. A_t equals one once cumulative soft commitments reach USD 24 million, 12% of the target. After that moment, first meetings are uplifted by 0.15 and diligence decisions by 0.30. The anchor is reached by week 26 in 40% of replications under simultaneous release, 62% under the cell rule and 54% when institutions go first. The median anchor week is 28, 25 and 26 respectively.
These two mechanisms are authored. The cascade literature supports the category of effect [10], and one study finds that investors respond to prior demand in crowdfunding [11], but another finds that lead-investor information did not move early-stage investors on average [13]. No source supplies the size of either effect for institutional limited partners. The stress cases vary both, and a case with neither shows how much of the result rests on them.
The weekly retention of 0.92 gives a half-life of about eight weeks for a refusal. In the first 26 weeks the model records 144 refusals on average under simultaneous release and 104 under the cell rule, so the stock that later decisions see is larger when refusals are bunched. The anchor and contagion effects are two sides of one observation, that investors read what others have done; separate parameters let each be switched off.
13 Two comparators put the headline results in context
Seven designs run on identical random draws, so that differences are paired. Simultaneous release approaches every name at the earliest permitted week. Three rules fix waves by a single attribute: by jurisdiction, by mandate type with family offices and similar investors first, and by mandate type with institutions first. The cell rule applies the readiness index of Section 7. One comparator assigns investors to waves at random. The other ranks investors by simulated true fit multiplied by actual ticket size, divided by the sum of regulatory lead time and investor decision time.
The full-information ranking uses latent inputs from the simulation. It has no access to the draws that determine individual outcomes and does not search for an optimal assignment. Comparing random waves with simultaneous release shows what staging alone changes under the model assumptions. Comparing a ranked wave rule with random waves shows the incremental difference from that rule, with the same wave spacing. Table 6 gives the composition of each design. The gap between waves is 6 weeks in every wave design, so wave two begins in week 6 and wave three in week 12, subject to regulatory lead times.
Neither comparator bounds the results. At week 52, random waves sign 44.8% of the target, compared with 25.0% under the fast-first mandate rule. Recorded fit has a correlation of 0.86 with true fit in the base case, so the full-information ranking should be read as a model comparison rather than as an outcome a team could expect to achieve.
Scroll across to see all columns.
| Design | Share of list in wave 1 / 2 / 3 | Mean approach week of wave 1 / 2 / 3 |
|---|---|---|
| Simultaneous | 100% / 0% / 0% | 2.5 / 0.0 / 0.0 |
| By jurisdiction | 45% / 40% / 15% | 1.4 / 6.0 / 12.0 |
| By mandate, fast first | 45% / 27% / 28% | 2.5 / 6.0 / 12.0 |
| By mandate, institutions first | 28% / 27% / 45% | 2.5 / 6.0 / 12.0 |
| By cell, observed readiness | 30% / 35% / 35% | 2.1 / 6.0 / 12.0 |
| Random waves | 30% / 35% / 35% | 2.5 / 6.0 / 12.0 |
| Full-information ranking | 30% / 35% / 35% | 2.2 / 6.0 / 12.0 |
MatchPoint analysis of the constructed case. Model output under stated inputs; not an observed result.
14 Ordering by cell makes the largest difference at week 52
Under simultaneous release, signed commitments average 7.2% of the target at week 26, 36.1% at week 52 and 51.3% at week 78. The cell rule gives 8.1%, 55.8% and 65.7%. At week 52 the paired gain is +19.7 points of the target, with a 90% range across replications of -1.9 to +46.2 points, and the cell rule is ahead in 93% of replications. By week 26 the gain is +0.9 points and by week 78 it narrows to +14.4. Table 7 and Figure 1 give the full comparison.
Ordering moves the first close earlier, not by much. The share of replications reaching a first close by week 26 is 10% for simultaneous release and 15% for the cell rule, and by week 52 it is 91% and 99%. The median first-close week is 36 and 31. The full-information comparator reaches a first close by week 26 in 49% of replications and signs 16.8% of the target by that week, which shows how much early signing depends on knowing which investors are ready.
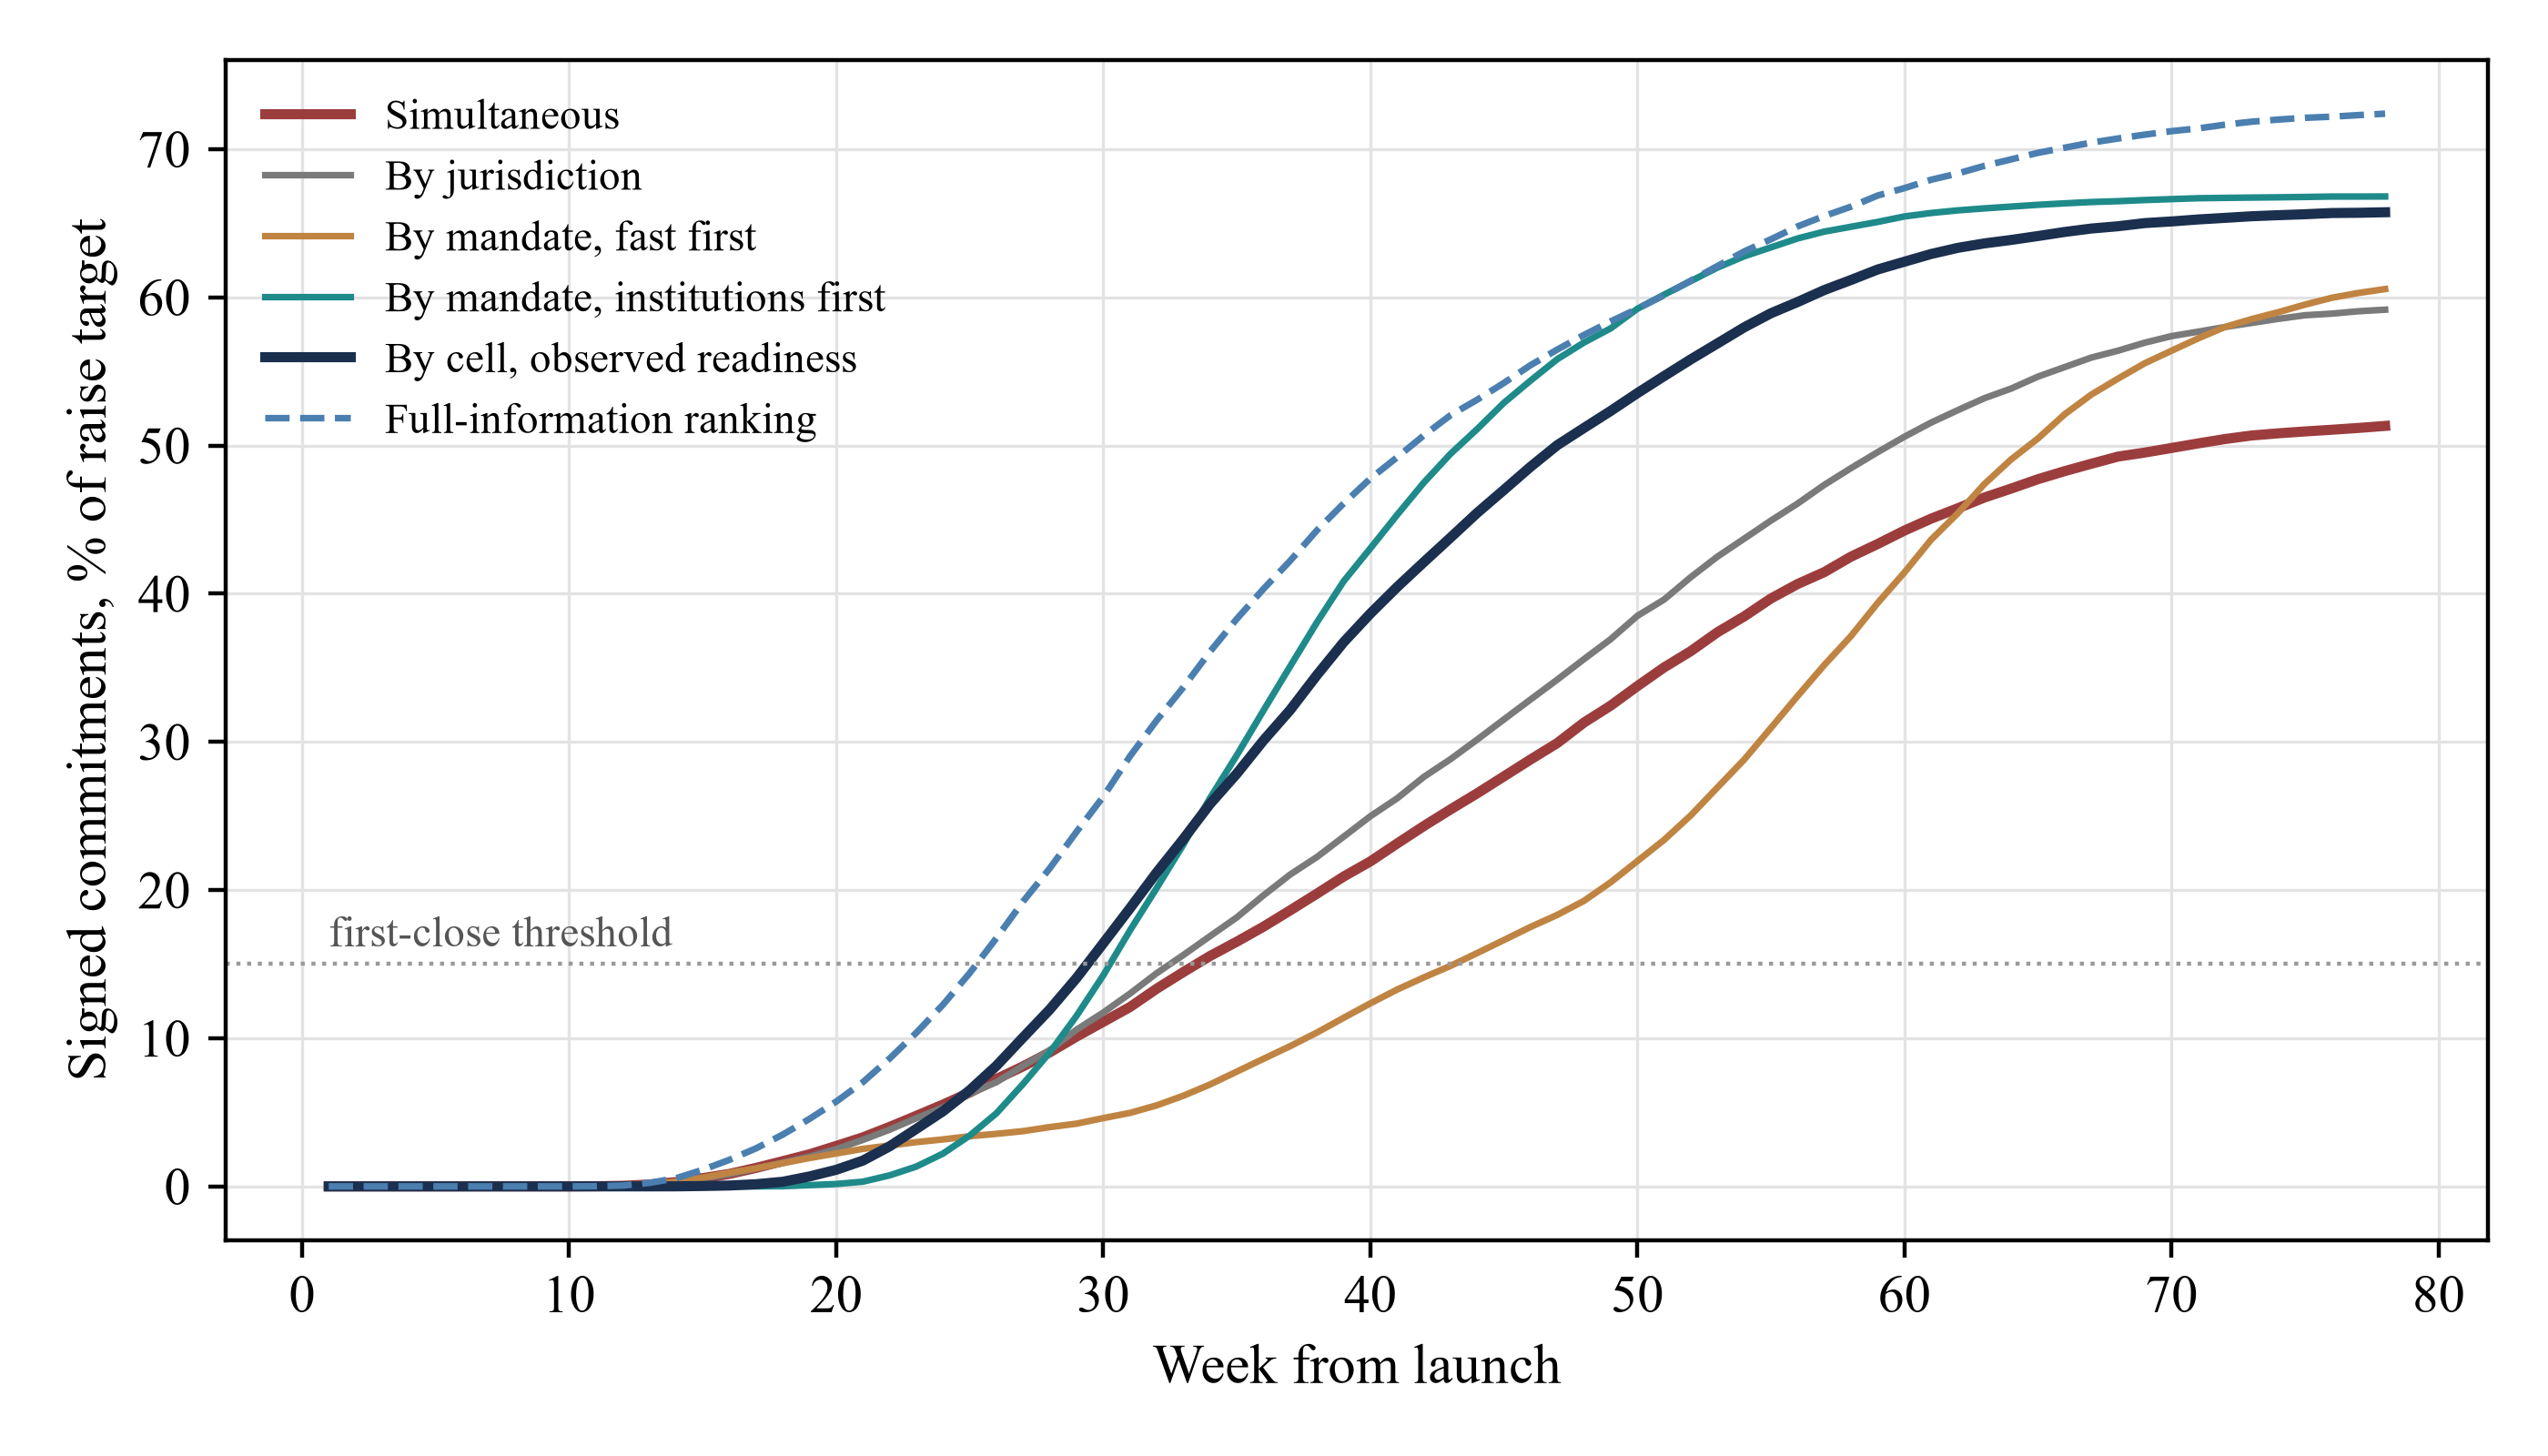
MatchPoint analysis of the constructed case. Model output under stated inputs; not an observed result. Mean over replications.
Figure 2 follows the funnel. Of the list, 60.5 investors open a diligence file under simultaneous release and 68.3 under the cell rule, and 12.8 and 16.0 sign. The qualified rate is 25.2% of meetings against 28.5%, and signing is 5.3% of those reached against 6.7%. High-fit refusals are 28.5 against 25.9. At week 52, the cell rule delivers 79% of the full-information comparator’s gain over simultaneous release. Random waves deliver 35% of that gain.
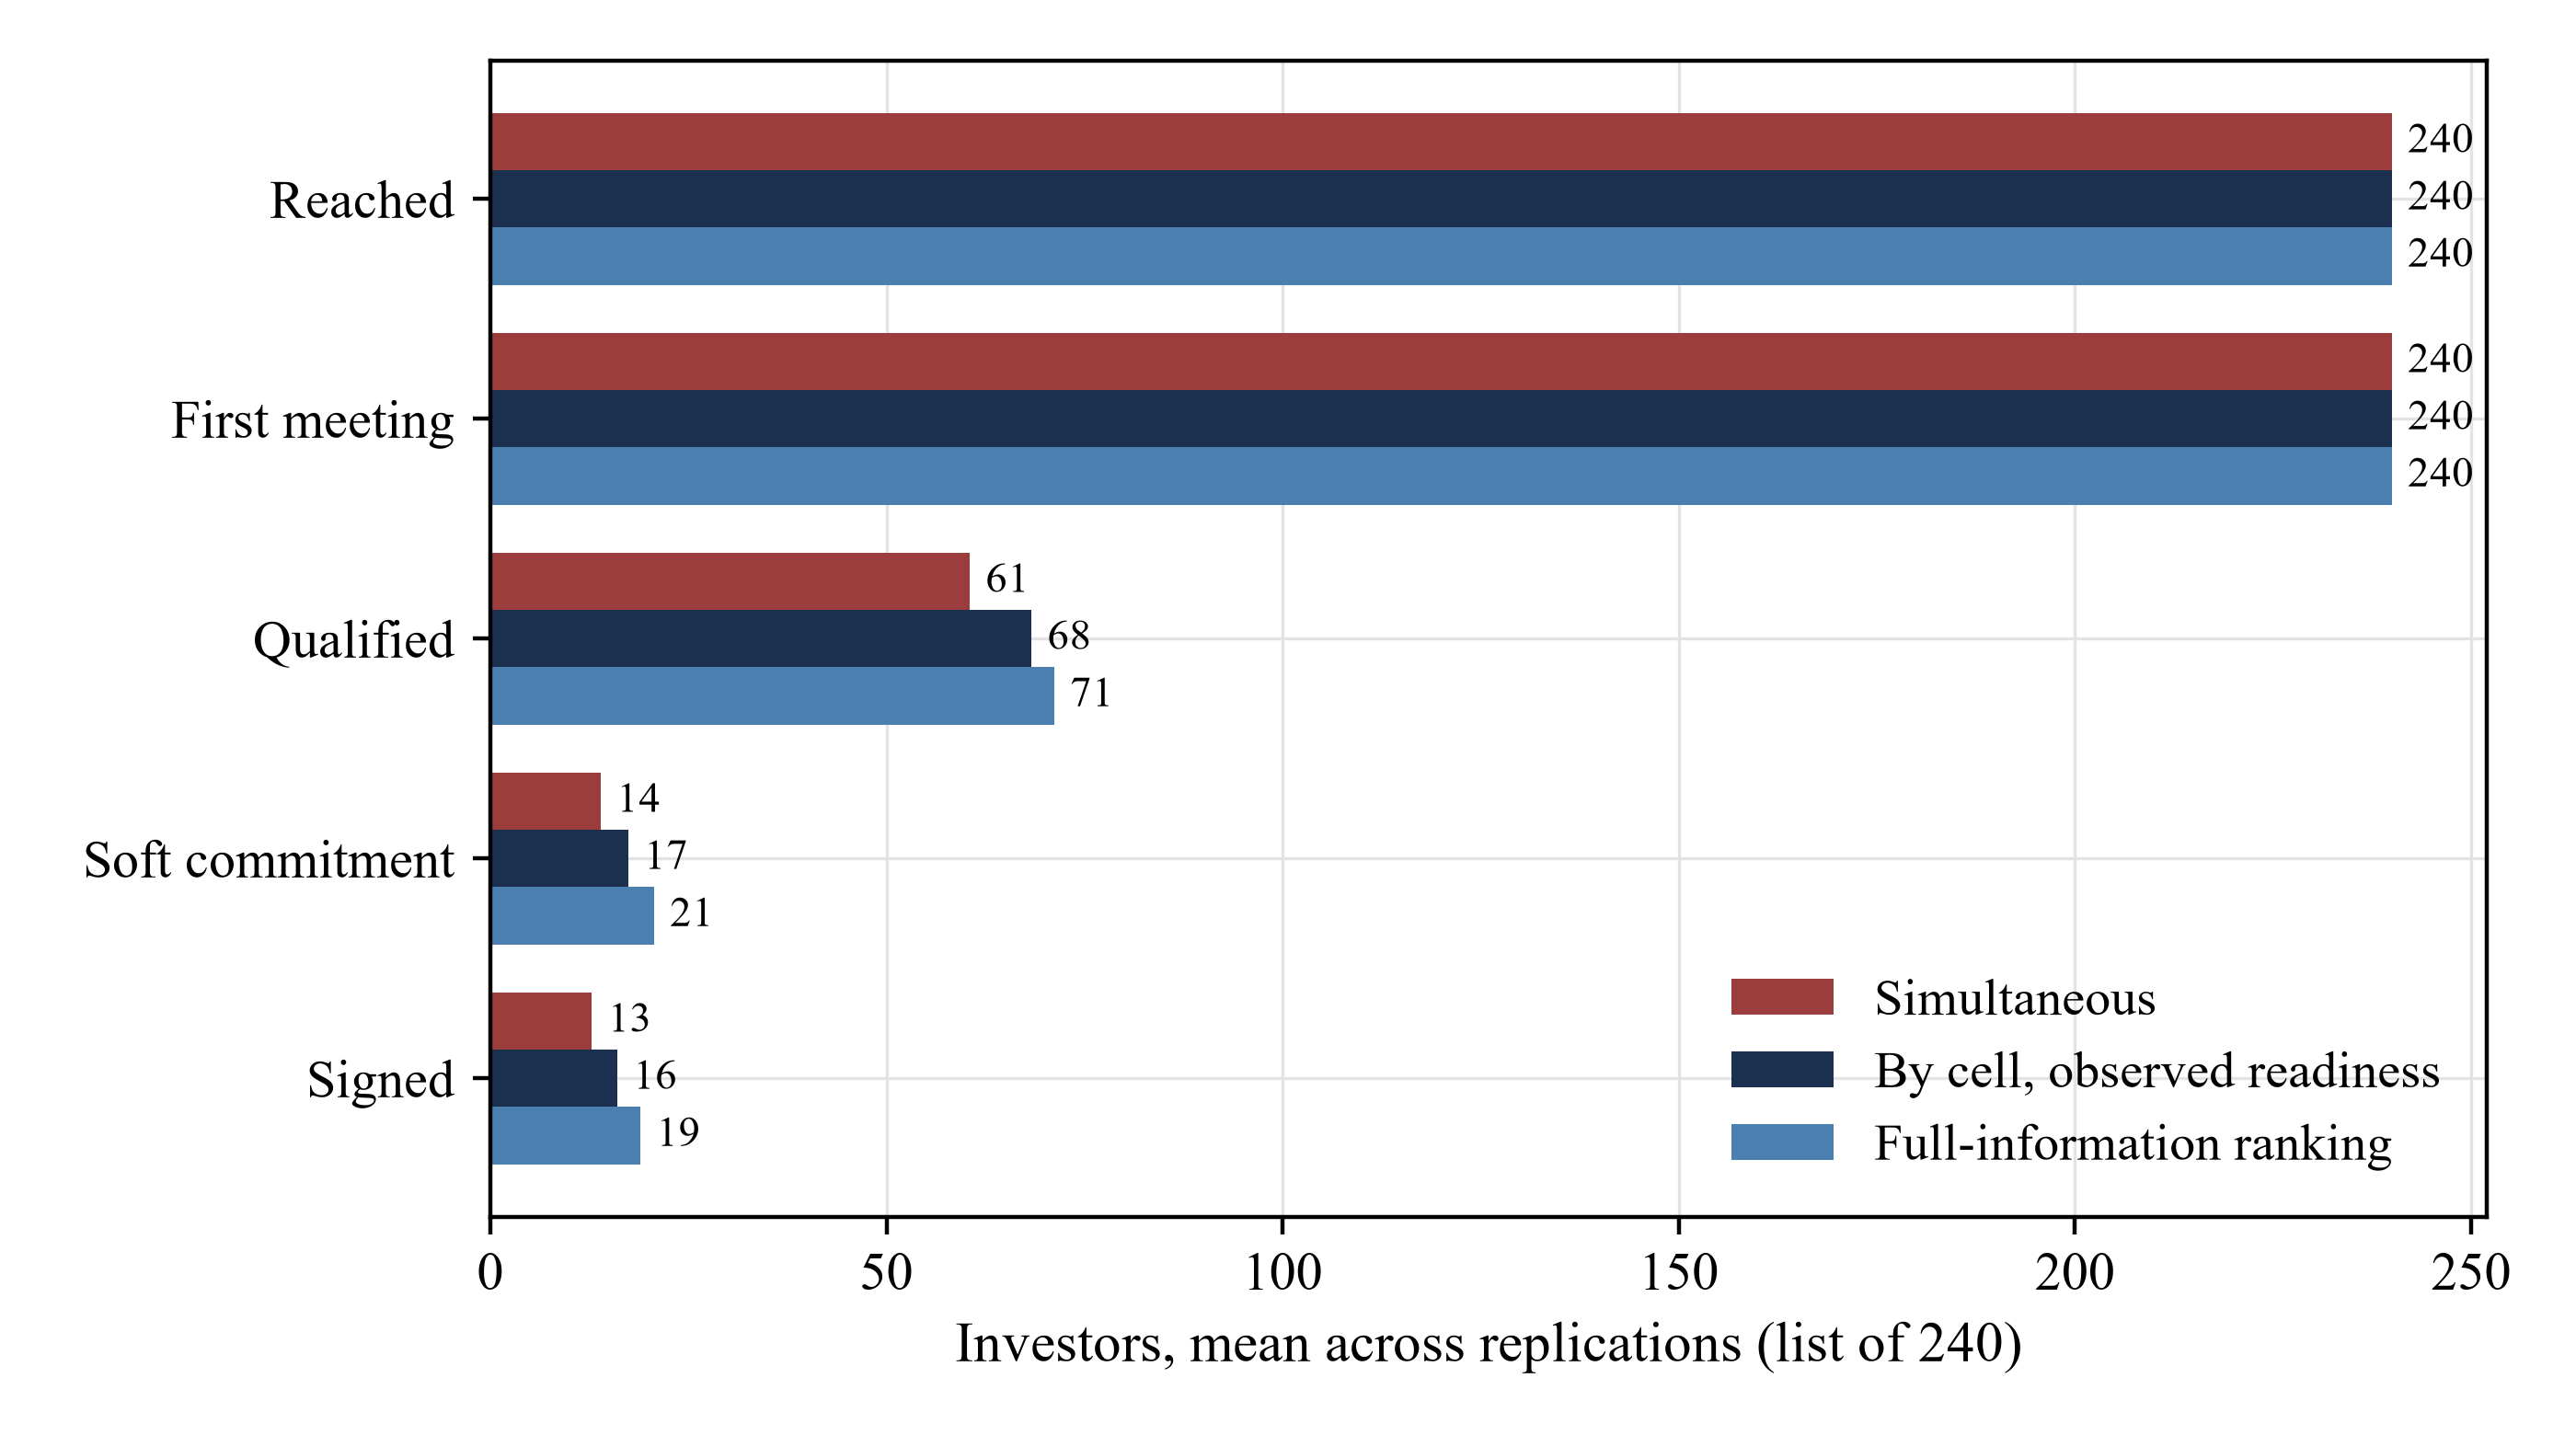
MatchPoint analysis of the constructed case. Model output under stated inputs; not an observed result. Mean number of investors over replications.
Scroll across to see all columns.
| Design | Signed by week 26 | Signed by week 52 | Signed by week 78 | First close by week 26 | First close by week 52 | High-fit refusals | Change in week 52 vs simultaneous | Replications better |
|---|---|---|---|---|---|---|---|---|
| Simultaneous | 7.2 | 36.1 | 51.3 | 10% | 91% | 28.5 | reference | reference |
| By jurisdiction | 7.0 | 41.1 | 59.2 | 10% | 95% | 26.3 | +5.0 (-13.6 to +26.7) | 64% |
| By mandate, fast first | 3.5 | 25.0 | 60.6 | 0% | 77% | 25.5 | -11.1 (-38.0 to +12.0) | 22% |
| By mandate, institutions first | 4.9 | 61.1 | 66.8 | 8% | 100% | 26.5 | +25.0 (+1.7 to +55.0) | 96% |
| By cell, observed readiness | 8.1 | 55.8 | 65.7 | 15% | 99% | 25.9 | +19.7 (-1.9 to +46.2) | 93% |
| Random waves | 7.9 | 44.8 | 68.9 | 11% | 97% | 25.5 | +8.7 (-16.0 to +33.1) | 72% |
| Full-information ranking | 16.8 | 61.1 | 72.4 | 49% | 99% | 23.9 | +25.0 (+1.2 to +54.3) | 96% |
MatchPoint analysis of the constructed case. Model output under stated inputs; not an observed result. Signed commitments are percent of the raise target. Change is paired against simultaneous release; the range is the 5th to 95th percentile of paired differences.
The paired range is wide. The cell rule is ahead in 93% of replications, which means it is behind or level in the rest. The 90% range of the paired gain runs from -1.9 to +46.2 points, which spans zero. The full-information comparator's 90% range runs from +1.2 to +54.3 points and is positive throughout that interval. This is chance in the constructed list and the outcome draws. It is the reason that one campaign cannot prove or refute the effect.
The implication is direct. In the constructed case, ordering by cell raises what is signed by week 52 by +19.7 points of the target, and the cell rule is ahead in 93% of replications. At week 26, the modelled gain is +0.9 points of the target. By week 78, random waves sign 68.9% and the cell rule signs 65.7%. The cell rule's advantage over simultaneous release persists at that horizon, and its advantage over random waves does not.
15 Mandate order and jurisdiction order are not interchangeable
Single-attribute rules behave very differently. Ordering by jurisdiction gives +5.0 points at week 52, with the rule ahead in 64% of replications. Placing family offices and similar investors first gives -11.1 points, behind simultaneous release in most replications, and -3.7 points at week 26. Placing institutions first gives +25.0 points and reaches 61.1% of the target at week 52, against 61.1% for the full-information comparator, but is -2.3 points at week 26.
The reason is the combination of ticket size and decision time. Institutional investors hold the large tickets and decide slowly, with a median of 24 weeks. Releasing them last leaves too little time for them to decide inside the first 52 weeks, and the fast but small commitments that arrive first reach the anchor threshold in the median replication only in week 36, against week 26 when institutions go first. Releasing them first starts the longest clock first. In this case the institutions-first rule beats the cell rule at week 52 by +5.3 points, while the cell rule is ahead at week 26 and in first closes by that week. The value of the index is that it reaches a similar order without knowing in advance which mandate type should lead.
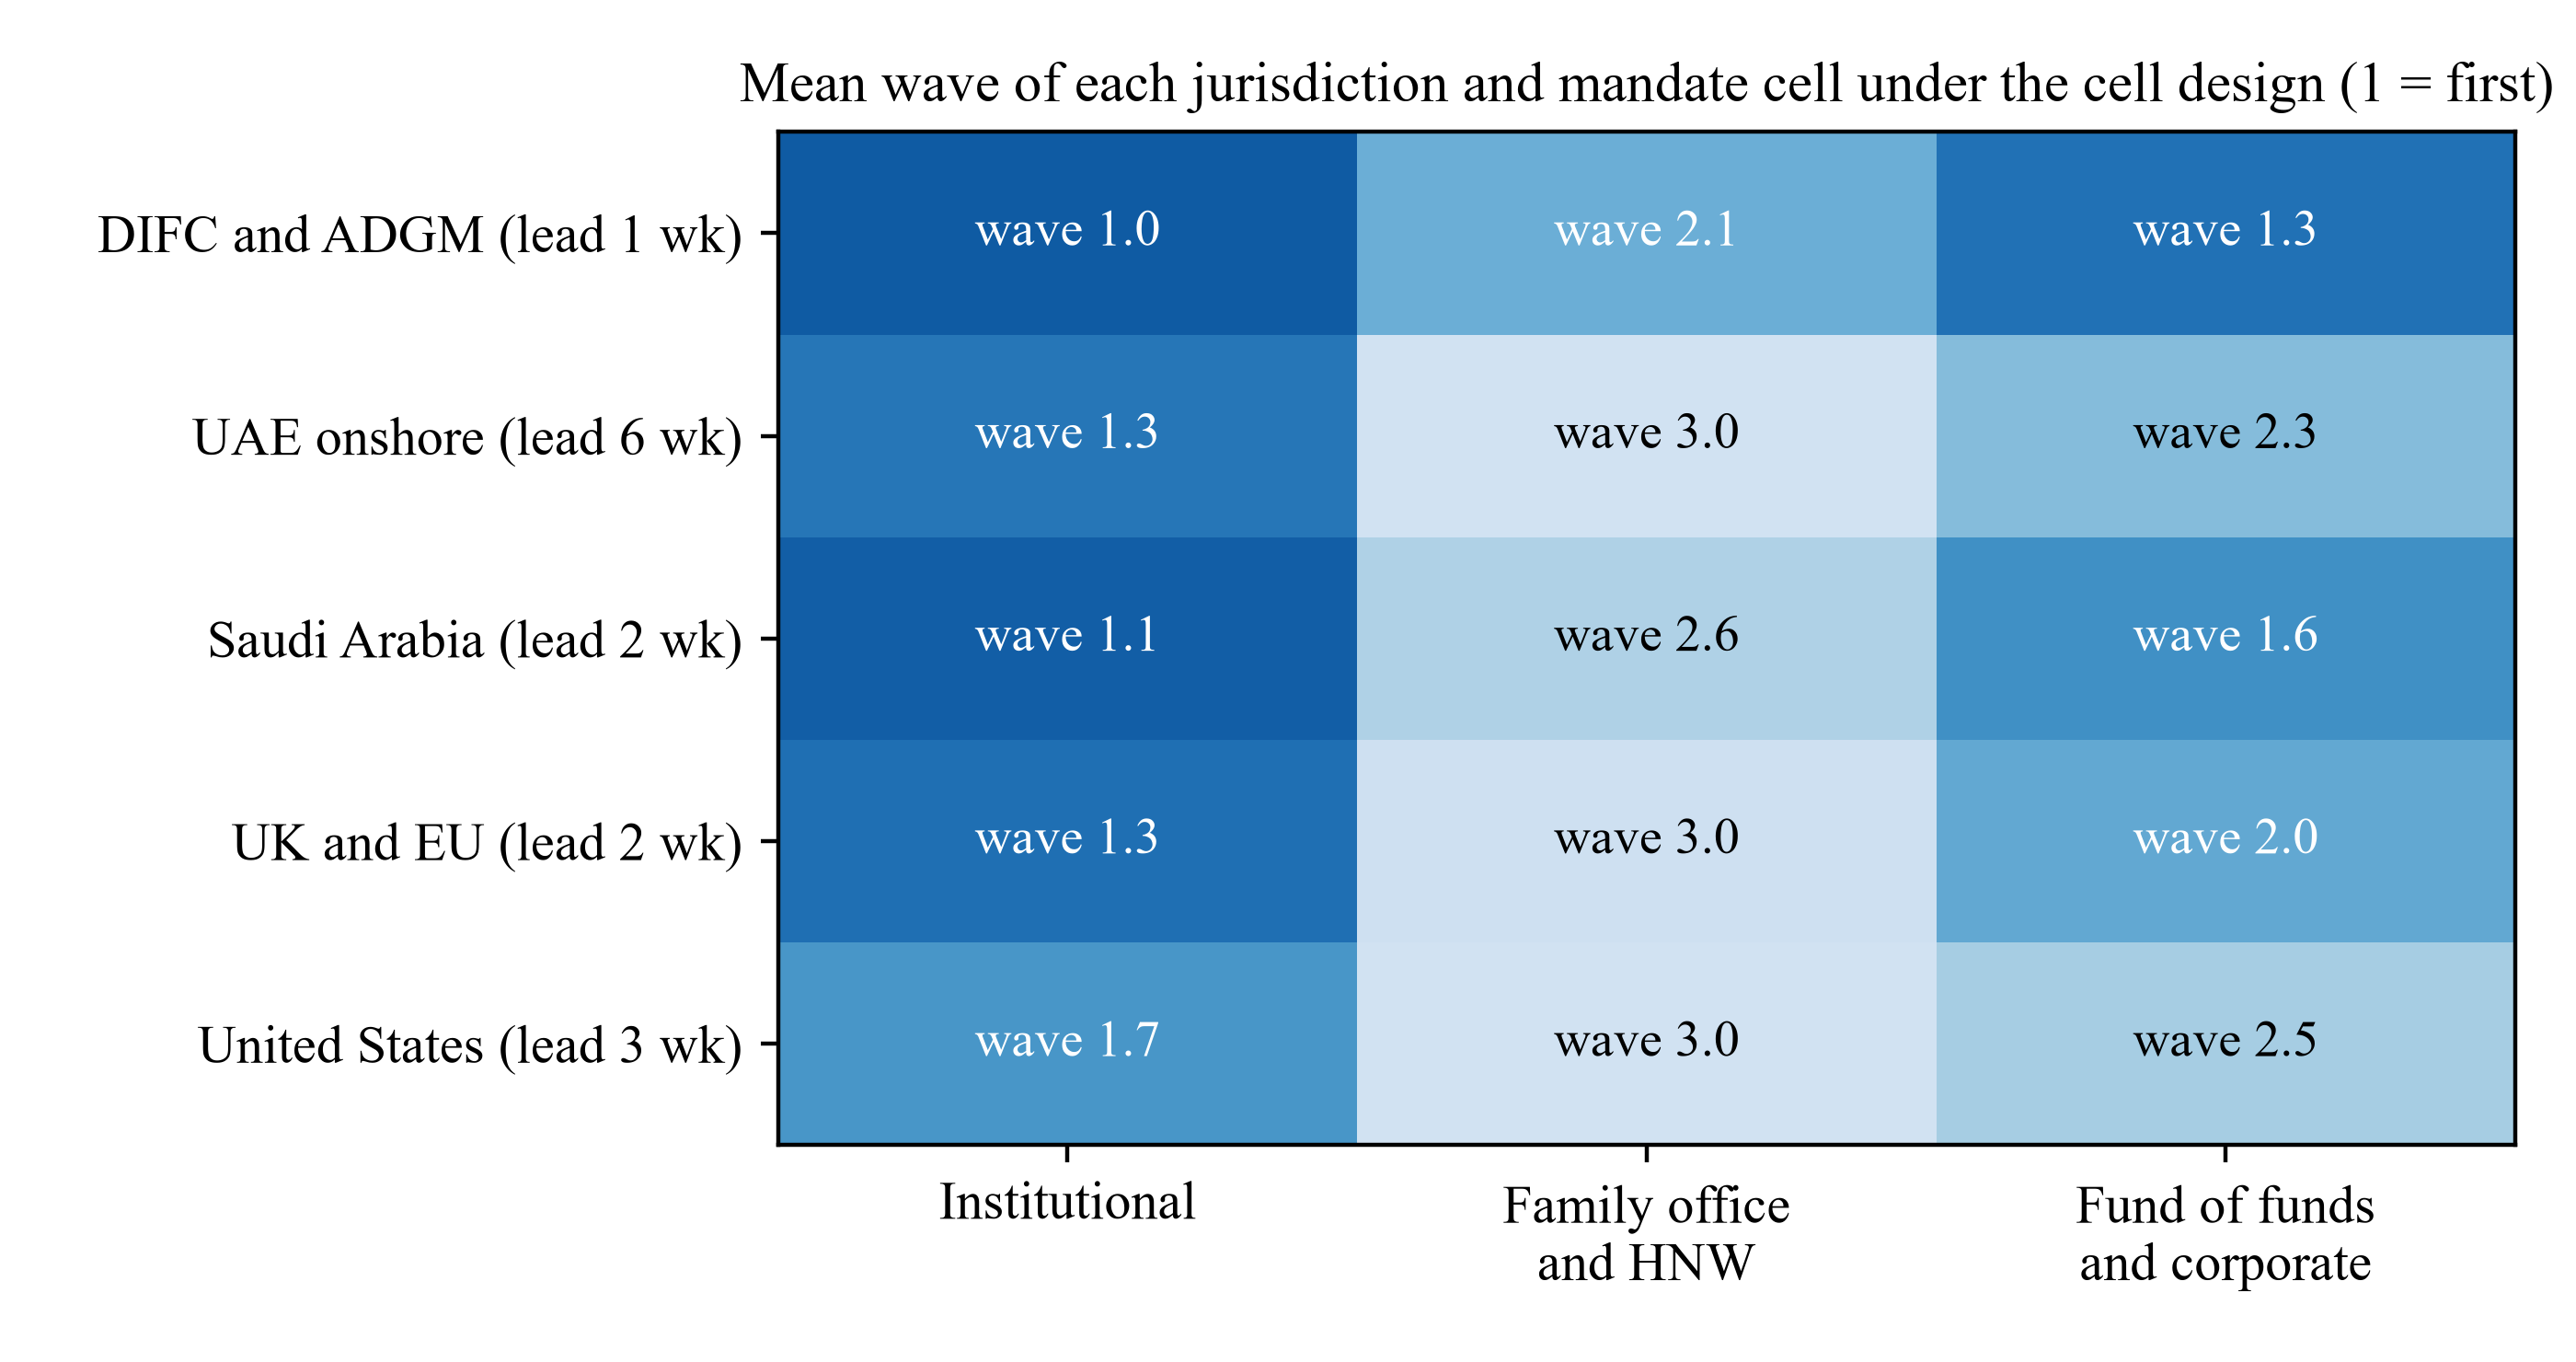
MatchPoint analysis of the constructed case. Model output under stated inputs; not an observed result. Wave 1 is released first. Mean over replications.
Figure 3 shows the average wave of each cell. The four cells that go earliest on average are DIFC and ADGM institutional; Saudi Arabia institutional; UK and EU institutional; DIFC and ADGM fund of funds. The four that go latest are Saudi Arabia family office; UK and EU family office; United States family office; UAE onshore family office. The map is an output of the constructed inputs and not a recommendation about any jurisdiction. Its use is to show that a cell rule produces an explicit and reviewable plan, which an unordered release or a single-attribute rule does not.
The cell rule beats ordering by jurisdiction alone, by +19.7 points against +5.0, because every jurisdiction contains investors with very different clocks and tickets. A jurisdiction wave holds institutions that need months and family offices that need weeks. Its median anchor week is 27, against 28 for simultaneous release and 25 for the cell rule, so it does little to bring the anchor forward. A cell wave keeps like with like, so that a wave can be judged on one clock and one kind of ticket.
16 The gap between waves trades learning against delay, and the calendar is the wrong gate
Figure 4 varies the gap between waves under the cell rule. A gap of zero collapses the design to simultaneous release, and the model checks that the two coincide. At two weeks the gain at week 52 is +3.1 points, at six weeks +19.3 and at twelve weeks +26.2. The gain reaches +26.7 points at a gap of 20 weeks, and falls to +20.8 points at 32 weeks, when the third wave begins in week 64.
By week 78, the largest gain is +36.8 points at a gap of 26 weeks, and the gain at six weeks is +13.2 points. By week 26 no gap moves the result by more than 0.8 points: +0.8 at six weeks and +0.6 at 32. In the model, longer gaps help through three channels that the inputs build in: they spread refusals, let the pitch improve and let the anchor form before later cells decide. They would cost more than the model shows if a window closed early on later waves, which the stress cases in the next section examine.
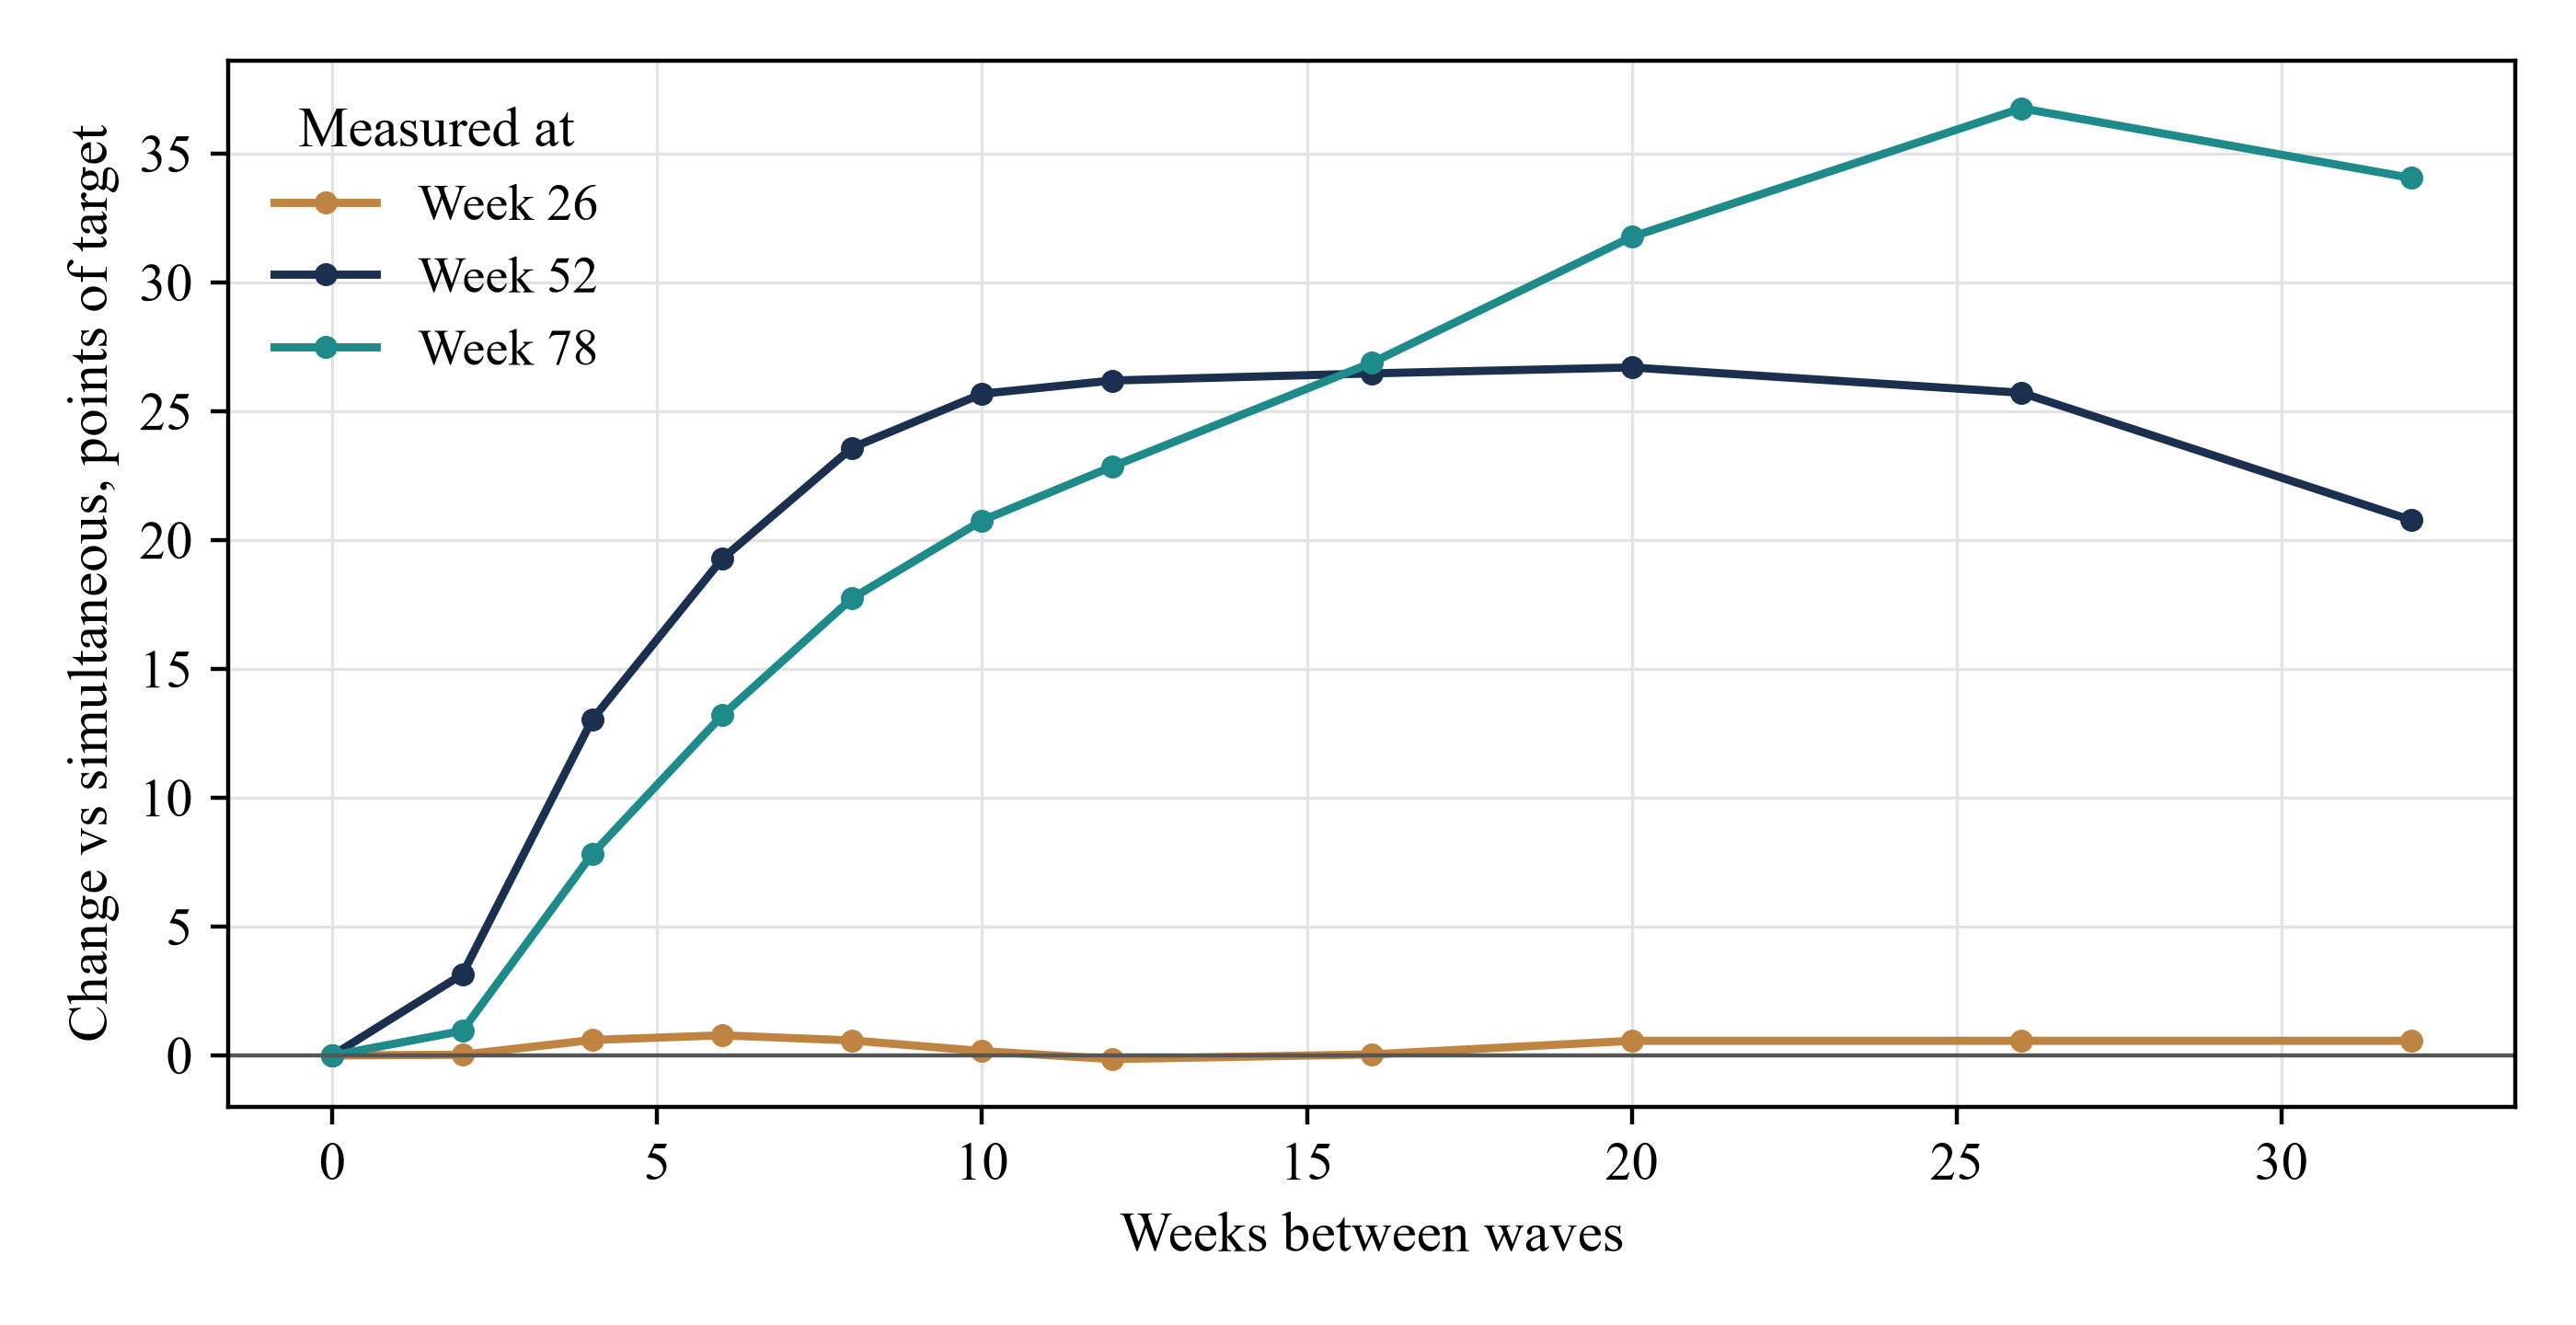
MatchPoint analysis of the constructed case. Model output under stated inputs; not an observed result. Cell rule against simultaneous release, points of the raise target, measured at weeks 26, 52 and 78.
The finding does not support a recommended number of weeks. The model supplies no calibrated decay of refusals, cost of waiting or window. It does show that the answer has an interior shape, with a poor result at a short gap and a falling benefit at a very long gap, and that the calendar is a crude proxy for what the next wave needs, which is the refusal log read and the pitch revised. The gate should be that review.
17 Each stress case fails differently, and a team can see which one it is in
Table 8 reruns simultaneous release, the cell rule and random waves under the base case and nine stresses on a fresh draw. The base case gives 35.5% for simultaneous release and 55.4% for the cell rule at week 52. Tight senior time lengthens the queue wait to 29.0 weeks, the cell gain falls to +10.7 points and the gain at week 26 is -0.9. Ample senior time cuts the wait to 2.8 weeks and the gain to +8.7, because the queue no longer rations the senior team.
Strong refusal contagion delays the anchor from week 29 to week 56 and drags every design down to 9.8% and 17.5%. Removing learning and the anchor leaves a gain of +10.8 points, from ordering and refusal spacing alone. Long regulatory leads cut the gain to +5.6 points, a pattern consistent with cells in slow routes being unable to move early whatever the rule. Wrong beliefs about the cells leave the cell rule at 48.6% against 44.2% for random waves.
The market-window case tests whether a closing window favours simultaneous release. Appetite falls for every approach and decision after week 40, and simultaneous release reaches 29.4% at week 52 against 48.7% for the cell rule, a change of +19.4 points. It does not reverse the result, because the queue under simultaneous release also pushes decisions past week 40. A window that closed earlier, or that fell only on later waves, would separate the designs, and the deadline belongs in the input register. No case moves the week 26 result by more than 2.1 points.
Early staleness, with the loss of appetite doubled and starting at week 6, leaves the result nearly unchanged: it gives 52.2% for the cell rule against 33.4% for simultaneous release, a gain of +18.8 points. Weak contagion lifts both designs, to 61.2% and 87.6%, and the gain to +26.3 points. Each case shows that the size of the advantage moves with the authored inputs. The sign at week 52 did not change in any case.
Scroll across to see all columns.
| Case | Simultaneous, week 52 | By cell, week 52 | Random waves, week 52 | Cell change at week 26 | Cell change at week 52 | Cell change at week 78 | Queue wait (weeks) | Anchor week | Diagnostic signature |
|---|---|---|---|---|---|---|---|---|---|
| Base | 35.5 | 55.4 | 44.2 | +1.0 | +19.9 | +15.0 | 12.4 | 29 | Register inputs |
| Tight senior time | 22.8 | 33.5 | 25.2 | -0.9 | +10.7 | +13.5 | 29.0 | 33 | Long queue; all fall |
| Ample senior time | 58.6 | 67.3 | 72.4 | +2.1 | +8.7 | +7.3 | 2.8 | 25 | Short queue; small gain |
| Strong refusal contagion | 9.8 | 17.5 | 13.3 | +1.0 | +7.7 | +4.4 | 12.3 | 56 | Late anchor; all fall |
| Weak contagion | 61.2 | 87.6 | 71.4 | -0.4 | +26.3 | +20.4 | 12.4 | 23 | All rise; larger gain |
| No learning, no anchor | 29.7 | 40.5 | 31.2 | +0.4 | +10.8 | +6.5 | 12.3 | 29 | Gain roughly halves |
| Early staleness | 33.4 | 52.2 | 40.6 | +0.8 | +18.8 | +14.4 | 12.1 | 29 | Little change |
| Long regulatory leads | 39.4 | 45.0 | 37.6 | -0.0 | +5.6 | +1.5 | 10.2 | 29 | Slow routes; small gain |
| Wrong cell beliefs | 35.5 | 48.6 | 44.2 | +0.8 | +13.1 | +15.9 | 12.4 | 29 | Cell nears random |
| Market window closes at week 40 | 29.4 | 48.7 | 37.5 | +1.0 | +19.4 | +17.0 | 12.4 | 29 | All fall; gain holds |
MatchPoint analysis of the constructed case. Model output under stated inputs; not an observed result. Percent of the raise target unless stated; change is the cell rule minus simultaneous release, in points.
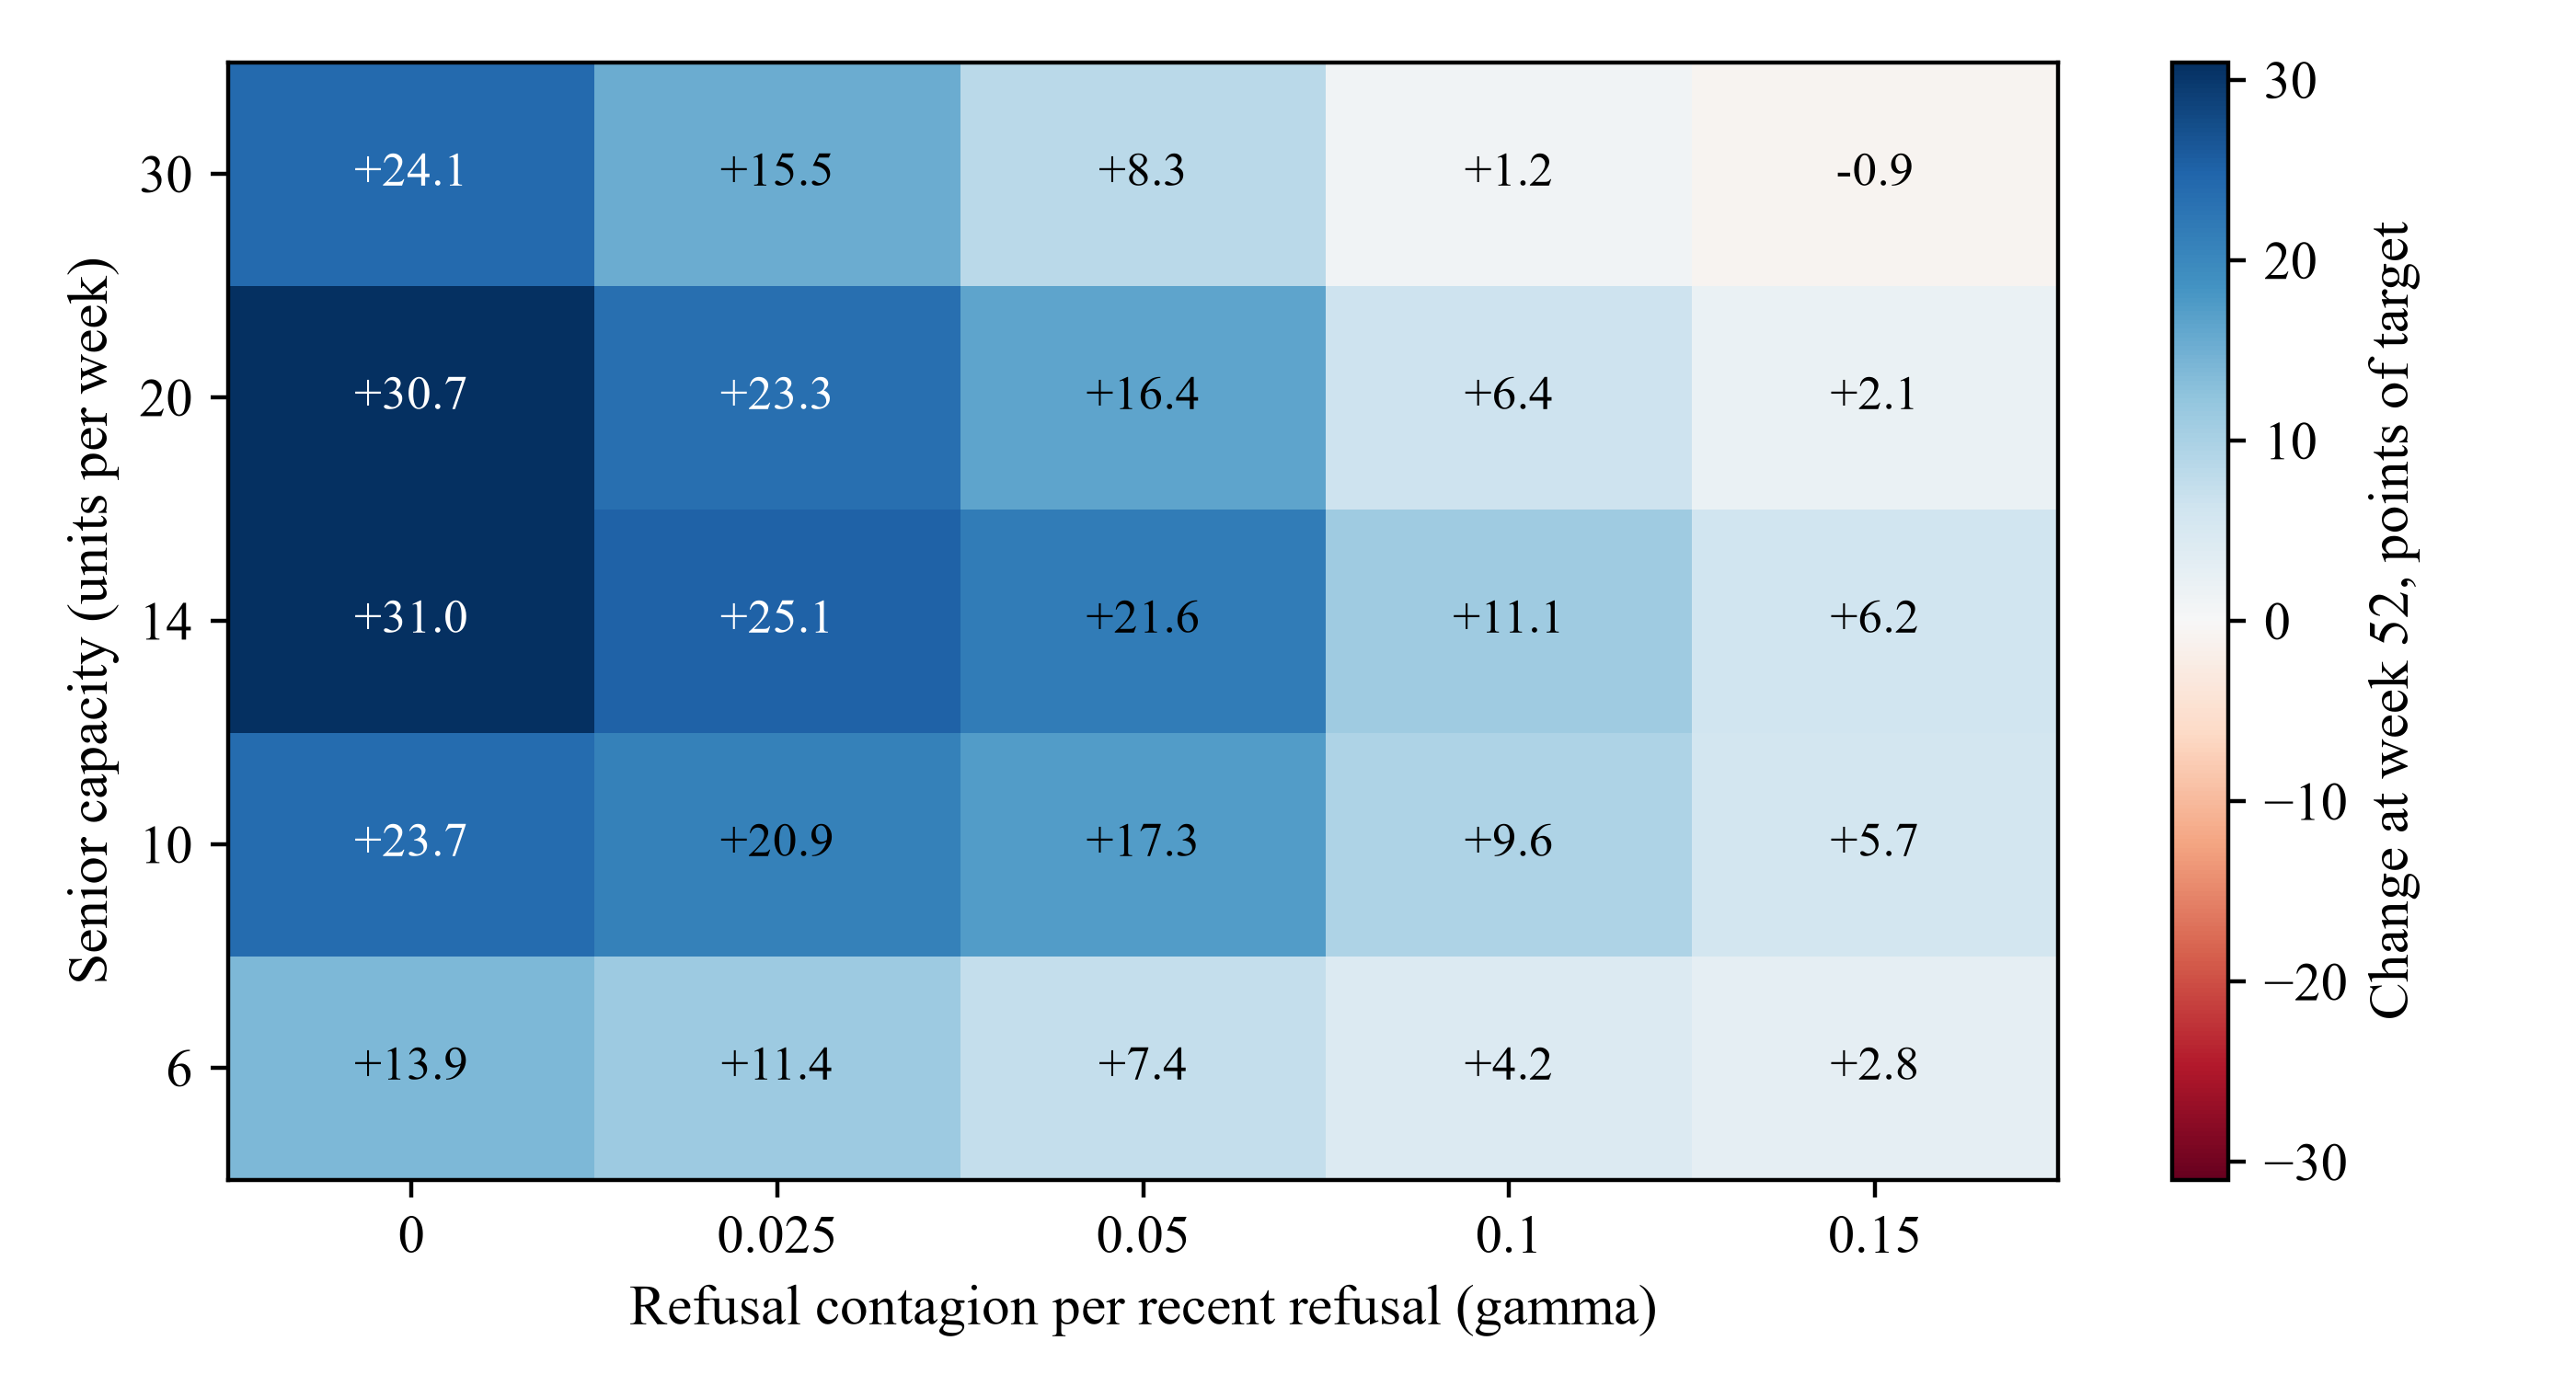
MatchPoint analysis of the constructed case. Model output under stated inputs; not an observed result. Change at week 52 over simultaneous release, points of the raise target. Each cell uses the same 250 simulated campaigns. This shared sample differs from the sample used in Table 7.
Figure 5 maps the gain at week 52 across five capacities and five contagion levels. It is positive in 24 of 25 combinations and ranges from -0.9 to +31.0 points. The gain falls as contagion rises at every capacity, to -0.9 with ample capacity and +2.8 with limited capacity at the strongest contagion; the base cell gives +21.6. In this model contagion therefore narrows the advantage of ordering rather than creating it, while it moves the level of signings for every design a great deal. The map is a statement about the constructed mechanisms, and a real list could sit outside it.
18 Judgement-based assignment changes the early-versus-late comparison
A team that orders its own waves will put the investors it believes best first. The experiment reproduces this with an assignment based on a judgement index that combines the recorded score with half of what the team privately knows, which correlates 0.93 with true fit. Comparing the signing rate of wave one with wave three gives 15.0% against 2.2%, a raw difference of +12.9 points. When waves are assigned by lot, the same comparison gives 7.7% against 7.4%, a difference of +0.3 points.
In Equation 6b, Y_i is whether investor i signs, E_i is one for wave one and zero for wave three, s_i is the recorded score and m_i and j_i are mandate and jurisdiction indicators. In Table 9, bias means the difference from the unadjusted early-versus-late comparison under random assignment. It falls from +12.6 to +5.4 points after adjustment, a reduction of 57%. The model gives judgement-based assignment information absent from the recorded score. Changing assignment also changes who shares the queue and encounters campaign feedback. The residual gap cannot be attributed solely to unrecorded information or interpreted as bias against a campaign-wide causal effect.
Scroll across to see all columns.
| Assignment of waves | Signed rate, wave 1 | Signed rate, wave 3 | Raw difference (points) | Adjusted difference (points) | Bias against randomised benchmark (points) |
|---|---|---|---|---|---|
| Randomised slice (waves assigned by lot) | 7.7% | 7.4% | +0.3 | +0.3 | benchmark |
| Team judgement, no adjustment | 15.0% | 2.2% | +12.9 | n/a | +12.6 |
| Team judgement, adjusted for recorded score, mandate and jurisdiction | 15.0% | 2.2% | n/a | +5.7 | +5.4 |
MatchPoint analysis of the constructed case. Model output under stated inputs; not an observed result. Difference in the share of investors signed by week 78 between wave one and wave three, in points; pooled over replications.
A second finding matters more. The randomised comparison of timing for individual investors shows a difference of +0.3 points. Detecting that at 80% power would need about 121,231 investors per arm. Yet the cell rule changes the campaign total by +14.4 points at week 78, the same horizon. The effect of ordering runs through the interaction of investors with each other, through the queue, the anchor and the stock of refusals, and an investor-level comparison cannot see it. The unit of evidence is the campaign.
19 A single sponsor cannot prove the effect: campaigns, not investors, are the sample
Table 10 resamples the simulated campaigns. Drawing a number of independent campaigns from each design, it reports the range of the estimated difference at week 52 and the power of a two-sided test at 5%. The standard deviation of the week-52 outcome across campaigns is 16.7 points for simultaneous release and 20.9 for the cell rule, around a true difference of +19.7 points. With three campaigns per arm the 90% range is -5.5 to +45.2 points, and the power is 13%.
The power reaches 60% at ten campaigns per arm and 89% at twenty. The standard formula applied to these variances gives about 14 campaigns per arm for 80% power. A firm’s own small set of raises can support descriptive analysis. Estimating a campaign-wide effect calls for a pooled study of distinct campaigns assigned to parallel arms.
Two further points follow. Power rises quickly once campaigns are numerous, which is why a pooled dataset is valuable, but a pooled dataset mixes sectors, jurisdictions and periods, and the variance across real campaigns is probably larger than the constructed one. A correct sign is also not the same as an effect worth acting on: at five campaigns per arm the estimated sign is right in 95% of draws, yet the power is 30% and the range runs from +0.2 to +39.3 points.
Scroll across to see all columns.
| Campaigns per arm | 90% range of estimated difference at week 52 (points) | Correct sign | Power at 5%, correct sign | Significant and wrong sign |
|---|---|---|---|---|
| 3 | -5.5 to +45.2 | 90% | 13% | 0.0% |
| 5 | +0.2 to +39.3 | 95% | 30% | 0.0% |
| 10 | +5.8 to +33.6 | 99% | 60% | 0.0% |
| 20 | +10.0 to +29.5 | 100% | 89% | 0.0% |
| 40 | +12.6 to +26.5 | 100% | 100% | 0.0% |
| 80 | +14.7 to +24.7 | 100% | 100% | 0.0% |
MatchPoint analysis of the constructed case. Model output under stated inputs; not an observed result. Resampling of simulated week-52 outcomes, 4,000 draws per row; t critical values from standard tables.
20 Reproduction, controls and what the checks do not show
The program runs from a fixed seed and writes every number in this paper. It asserts 100 control identities in the run that produced the tables. They cover probabilities that sum to one, the assignment of every investor to exactly one wave, equality of the population across designs, the collapse of the cell design at zero gap to simultaneous release, the monotone funnel from reach to signing, reconciliation of signed amounts to the sum of tickets, approach weeks not before regulatory lead times or wave starts, and the consistency of the first-close week with its threshold.
The assertions count internal consistency and not realism. The model is deterministic given the seed, so a rerun on the same version of the libraries reproduces every table. Changing the seed changes individual numbers by sampling variation, which is why the paper reports ranges across replications and not single draws.
Table 11 lists the principal controls. They show that the bookkeeping is internally consistent. They do not show that the mechanisms resemble real investor behaviour. A separate re-implementation of the simultaneous and cell designs, written from the equations in this paper on its own random stream, reproduced the week 52 gain to within half a point. The figures have not been checked against an external dataset. A reader who wants to challenge a conclusion should change the input register and rerun, which takes a few minutes.
Scroll across to see all columns.
| Control | Expected result |
|---|---|
| Shares of jurisdictions, mandates and waves | Each sums to one |
| One wave per investor in every design | Labels in the allowed set; array shape matches the list |
| Population identical across designs | Fingerprint unchanged after all runs |
| Zero gap collapses the cell design | Signed path equal to simultaneous release |
| Funnel is monotone | Signed, soft, qualified, met, reached, list size in order |
| Signed amounts reconcile | Sum of tickets of signed investors equals the signed path |
| Approach timing | No approach before regulatory lead or wave start |
| Total assertions in the run | 100, all passed |
Controls asserted in the model run; the count is of individual assertions. Basis: MatchPoint analysis of the constructed case.
21 The evidence design a real study requires
Define the allocation unit, outcomes and analysis before the first approach. Assign fresh, eligible campaigns by lot at inception to simultaneous release or ordered waves. Balance by sponsor and calendar period where practical and analyse campaigns by assigned arm. Switching a campaign after first contact would carry forward its queue, refusals and anchor commitments. A phased rollout across repeat sponsors would need a separate cluster design with fresh campaigns and prespecified calendar-time and spillover controls [14].
For the separate investor-level question, assign a subset of eligible investors to outreach waves by lot in a prespecified substudy. Keep the substudy outside the primary trial or predefine how its assignment interacts with the campaign-level comparison. Record timestamps, applicable legal basis and study permissions [15, 16]; apply the relevant promotion rules to each approach. Use the outcomes and follow-up weeks in Section 2. Register the comparison and adjustment set before enrolment.
The number of campaigns determines what can be claimed. On the variances of Section 19, about 14 campaigns per arm give 80% power for a difference of +19.7 points, and fewer give a range too wide to act on. Table 12 sets out the design. A smaller study can still report descriptive funnels, but should not call them tests.
A smaller sponsor is not without options. It can run the record for every raise, report descriptive funnels by cell, commit in advance to the wave plan and the gate review, and keep a small random slice. It can then share anonymised, consented records with others in a pooled study. What it should not do is claim, from its own few campaigns, an effect of ordering. The pre-filed plan also protects against stopping when a result looks favourable, which would overstate the effect.
Scroll across to see all columns.
| Element | Specification | Reason |
|---|---|---|
| Unit | Campaign for sequencing; investor within campaign for response | Effect runs through interaction |
| Assignment | Assign fresh campaigns at inception to parallel arms; separate investor wave substudy | Breaks judgement-based assignment |
| Timestamps | Every approach, meeting, diligence step, refusal and signing | Supports comparison at common follow-up times |
| Consent | Lawful basis recorded; personal data minimised [15, 16] | Permits analysis |
| Outcomes | Qualified meeting, soft commitment, signing, first close, at weeks 26, 52, 78 | Matches Section 2 |
| Sample | About 14 campaigns per arm for the constructed variance | Power |
| Analysis | Analyse by assigned arm; account for allocation strata and prespecified covariates | Preserves the campaign-level comparison |
| Reporting | All campaigns, including stopped and failed ones | Avoids survivor bias |
Proposed design; entries describe what to obtain and decide, not findings. [14, 15, 16]
22 Report the sequence to the client or committee as a plan, a log and a benchmark
A client or investment committee should see the wave plan first: which cells go in which wave, why, and what regulatory route each uses. Table 13 lists the pack. The plan should show the readiness index for each cell and the evidence behind it, and should say who has authority to release the next wave and on what review.
The progress report should show signed and soft commitments at the weeks 26, 52 and 78 checkpoints against the target and the first-close threshold, by cell, together with the refusal log and the senior hours used. It should show the benchmark: what simultaneous release would have been expected to give under the stated inputs. That figure comes from a model and not from observation, and must be labelled so. It should never be presented as a proof that the sequence worked.
The committee should also see what is not known. The paper's figures say nothing about price, terms or investor quality, and no observed data support their size. A report that states the constructed gain of +19.7 points as an expected result would overreach. A report that states the mechanism, the evidence held and the conditions under which the plan should be abandoned would not.
Scroll across to see all columns.
| Item | Content | Question answered |
|---|---|---|
| Wave plan | Cells, wave, route, release authority | Why this order |
| Readiness index | Inputs and evidence by cell | Is the ranking defensible |
| Checkpoint results | Signed and soft by week, by cell | Where is the raise against target |
| Refusal log | Date, stage, reason, peers aware | What the next wave must change |
| Senior time | Hours, queue wait | Is capacity binding |
| Model benchmark | Constructed expectation, labelled | What a different plan might have done |
| Abandon conditions | Window, anchor, contagion triggers | When to release the rest |
Proposed pack. Entries describe information to show; they are not findings.
23 A usable decision rule for a live raise, and a limit on automation
The rule has five steps. First, establish the window: if the market window or the mandate deadline falls inside about 26 weeks, ordering gave little in the model at that horizon, so release the cells that can decide fast and keep the rest as a second release. Second, count the senior capacity: if the expected queue wait under simultaneous release exceeds a few weeks, an unordered release will ration the team at random, and ordering is worth its cost. Third, build the fifteen-cell plan with the readiness index, and put the cell that can supply an anchor early.
Fourth, do not place the fastest and smallest investors first, since the model shows that doing so delays the anchor and leaves the long clocks to the end. Fifth, release each later wave when the refusal log has been read and the pitch revised, and not at a fixed date. If contagion is visible, with several refusals from one segment inside a few weeks, hold that segment. These are conditional statements derived from a constructed model and apply only to the extent that its mechanisms hold.
Data tools and automated systems can maintain the record, flag stale entries and draft the log. They should not decide the wave or the release. Any model or score used should be tested on the question it is meant to answer, with a held-out set of campaigns, and its output logged with the date and version.
24 Limitations and the next decision
The experiment is a construct whose mechanisms favour ordering by design: queueing, pitch learning and an anchor. Contagion, as modelled, narrows the gain but sets the level of signings for every design, and no source sizes it. Outcomes are generated from the same mechanisms the rule exploits, so the experiment shows how ordering behaves when its premises hold, not that they hold. Each parameter is authored and no source supplies a value. The long-lead case shows that the gain can shrink to a few points, and the rule that places family offices first reverses it. The model has no mechanism, such as a competing fund or investor fatigue with a long process, that would make delay costly beyond the staleness term, and such mechanisms could reverse the result.
Investors are independent apart from the stated contagion. The model excludes repeat approaches, competing funds, changes in terms, price effects and a hard cap. It uses a simple noise term for recorded readiness. The regulatory review covers selected offering and promotion provisions. Separate Saudi fund rules and EU national regimes are outside its scope. Confirm the applicable route and current rules with qualified advisers before relying on them.
Use the record in Table 3 on the next campaign. Advisers or platforms with the required permissions could pool distinct eligible campaigns for the parallel-arm study in Section 21. Until such evidence exists, use the simulation to identify conditions worth testing and review the refusal log before releasing another wave.
References
- Dubai Financial Services Authority. DFSA Rulebook, General Module, chapter 3 (financial promotions), rules 3.2.1 (guidance), 3.4.1 and 3.5.1, version VER72/07-26, accessed 14 October 2026; and A Guide to the DIFC Financial Promotions Prohibition, June 2018. Binding rules and current guidance; the guide is dated. https://dfsaen.thomsonreuters.com/entiresection/15119
- Abu Dhabi Global Market. Financial Services and Markets Regulations 2015, section 18 and Schedule 2, consolidated version in force from 21 May 2026, ADGM Rulebook, accessed 14 October 2026. Binding regulations. https://en.adgm.thomsonreuters.com/rulebook/18-restrictions-financial-promotion
- Capital Market Authority, Kingdom of Saudi Arabia. Rules on the Offer of Securities and Continuing Obligations, amended by Resolution 3-6-2026 dated 19 January 2026, Articles 8 to 10. CMA English translation; the official text is Arabic. Separate fund rules are outside this review. https://cma.gov.sa/en/RulesRegulations/Regulations/Documents/RULES_ON_THE_OFFER_OF_SECURITIES_AND_CONTINUING_OBLIGATIONS_en2026.pdf
- Capital Market Authority, United Arab Emirates. Federal Decree-Law No. 32 of 2025 Regarding the Capital Market Authority; and Financial Activities Rulebook, Article 6 on obligations specific to promotion. https://legislation.uaecma.gov.ae/en/entiresection/1 https://legislation.uaecma.gov.ae/en/entiresection/2571
- United Kingdom. Financial Services and Markets Act 2000 (Financial Promotion) Order 2005, SI 2005/1529, article 19. Binding statutory instrument as published on legislation.gov.uk. https://www.legislation.gov.uk/uksi/2005/1529/article/19
- European Parliament and Council. Directive 2011/61/EU on Alternative Investment Fund Managers, consolidated text of 16 April 2026, Article 30a(1) and (2). National private placement rules are outside this review. https://eur-lex.europa.eu/legal-content/EN/TXT/PDF/?uri=CELEX%3A02011L0061-20260416
- United States. 17 CFR 230.506 (Regulation D, Rule 506), 17 CFR 230.501(e) (purchaser counting) and 17 CFR 230.502(c) (limitation on manner of offering). Electronic Code of Federal Regulations. https://www.ecfr.gov/current/title-17/chapter-II/part-230/section-230.506 https://www.ecfr.gov/current/title-17/chapter-II/part-230/section-230.501 https://www.ecfr.gov/current/title-17/chapter-II/part-230/section-230.502
- Institutional Limited Partners Association. ILPA Principles 3.0: Fostering Transparency, Governance and Alignment of Interests for General and Limited Partners. 2019. Voluntary industry standard; not binding. https://ilpa.org/wp-content/uploads/2019/06/ILPA-Principles-3.0_2019.pdf
- Duane Morris LLP. Private Equity Fund Timeline. Presentation by J. Wheater, August 2014. Dated practitioner material, not a survey. https://www.duanemorris.com/site/static/private_equity_fund_timeline.pdf
- Bikhchandani, S., Hirshleifer, D., Tamuz, O. and Welch, I. Information Cascades and Social Learning. 25 May 2021. Review of the theory; working paper version. https://arxiv.org/abs/2105.11044
- Astebro, T., Lovo, S., Fernandez Sierra, M. and Vulkan, N. Herding in Equity Crowdfunding. HEC Paris Research Paper 1245, 7 December 2017, revised June 2018. Working paper; abstract-level reading. https://econpapers.repec.org/paper/ebgheccah/1245.htm
- Cortes, K., Singh, M., Solomon, D. H. and Strahan, P. The Stench of Failure: How Perception Affects House Prices. NBER Working Paper 30760, December 2022. Working paper on housing; abstract-level reading. https://www.nber.org/papers/w30760
- Bernstein, S., Korteweg, A. and Laws, K. Attracting Early Stage Investors: Evidence from a Randomized Field Experiment. Stanford Graduate School of Business Research Paper 3006, 2014. Working paper; abstract-level reading. https://ideas.repec.org/p/ecl/stabus/3006.html
- Taljaard, M., Lilford, R., Girling, A. and Hemming, K. The stepped wedge cluster randomised trial: an opportunity to increase the quality of evaluations of service delivery and public policy interventions. Trials 16(Suppl 2):P4, 2015. Conference abstract. https://pmc.ncbi.nlm.nih.gov/articles/PMC4659269/
- United Arab Emirates Government portal. Data protection laws: Federal Decree-Law No. 45 of 2021 on the protection of personal data, in force 2 January 2022. Official portal summary, accessed 14 October 2026; not the Decree-Law text. https://u.ae/en/about-the-uae/digital-uae/data/data-protection-laws
- Information Commissioner's Office. Electronic mail marketing, guide to PECR. Regulator guidance, accessed 14 October 2026. https://ico.org.uk/for-organisations/direct-marketing-and-privacy-and-electronic-communications/guide-to-pecr/electronic-and-telephone-marketing/electronic-mail-marketing/
About the Author
Chennakeshav (CK) is a corporate finance and investment banking executive with 25+ years of global experience in deal origination, structuring and execution across M&A, growth capital and corporate strategy. He has led value-creation mandates for founders, corporates and funds — bridging the boardroom view to hands-on execution and close.
His career spans Morgan Stanley, HSBC, Lloyds Banking Group, EWEC, ADQ portfolio companies and Emirates Growth Fund, across TMT, real estate, fintech, deeptech, cleantech, infrastructure and energy. He has partnered with C-suite leaders, private equity and venture funds, sovereign wealth funds and family offices to finance complex fund raises and scale-up ventures, and has led M&A due diligence, post-merger integration and business-transformation initiatives to create value.
At Matchpoint Partners he is Managing Partner, leading the firm's corporate finance, M&A and capital-raising practice. He holds an MBA from London Business School, an engineering degree from VTU and a Master of Laws (LLM, in progress) from UCL London.
An active start-up mentor, CK mentors at Techstars, DIFC FinTech Hive, Startup Grind, Founder Institute and IN5, serves as Entrepreneur Mentor in Residence (EMiR) at London Business School, and judges the Entrepreneurship World Cup.
https://www.linkedin.com/in/ckadya/
https://www.matchpoint-partners.com/team/ck-adya.html
Disclaimer
This paper is part of a continuing series on the structure of private and alternative markets. The views expressed are the author's own. The paper is for information only, describes market structure in general terms, and does not constitute investment, legal, tax or regulatory advice or a recommendation in respect of any security, vehicle or counterparty.
