

1 The decision to sequence outreach by mandate fit
A capital raise consumes a resource that cannot be bought back: the attention of the people who can explain the business or the fund. A founder, chief financial officer or sponsor raising private capital, and a manager raising from limited partners, must decide which investors hear from them first, which are held for a later wave and which are not approached at all. This paper addresses that sequencing decision. It asks whether a mandate-fit scorecard, built from strategy, geography, ticket size and decision-cycle inputs, predicts a qualified first meeting well enough to govern the order of approach.
The question is narrower than it first appears. A scorecard can rank investors correctly and still mislead a planning forecast. It can forecast well in one market and overstate in another. It can also look excellent on a history of approaches that were themselves chosen by judgement. We therefore separate three properties: whether the score ranks investors, whether its probabilities are right, and whether the evidence behind it would survive a different method of choosing whom to approach. Each property supports a different part of the decision and fails in a different way.
The available evidence supports this separation. Institutional investors and their standard setters publish mandate criteria, so fit can be read from documents. [1, 2, 3] Research on investor behaviour documents staged funnels, network-led sourcing and home bias. [4, 5, 6] Regulators define who may lawfully receive an offer. [7, 8, 9, 10, 11] The statistical literature states how a score should be judged. [12, 13, 16] None of these sources tests a practitioner scorecard against outreach outcomes, and our review found no such published test; that is a statement about our review and not about the whole literature.
Our principal contribution is a reproducible experiment that shows what a validation would have to measure and how large it would have to be. We hold no observed cohort of consented, timestamped approaches, and we say so plainly. The experiment's population, outcomes and rates are constructed. The experiment establishes how a stated scorecard behaves under stated assumptions. It does not estimate the response rate of any investor, the conversion of any raise or the value of any adviser.
2 Define the qualified first meeting before defining the score
A score predicts an outcome, so the outcome must be fixed first. We propose that a qualified first meeting be recorded only when four conditions hold: the meeting took place, the investor was represented by a person with authority to advance an opportunity, the investor received the mandate summary beforehand, and the investor confirmed that the opportunity fell within a mandate it could act on. A courtesy call, a meeting taken as a favour and a meeting with an analyst gathering market colour are logged, but they are not counted as qualified.
The definition matters because a loose outcome flatters a weak score. If any conversation counts, a ranking by relationship warmth will appear to work, since acquaintances take calls. The later stages need the same discipline. Diligence progression is recorded when the investor requests data-room access or issues a diligence list. A commitment is recorded only when an executed document creates a binding investment obligation. Nonbinding term sheets and indications of interest are logged separately. Each event carries a date.
Table 1 sets out the record that we propose for each investor on the long list. It separates what the investor has published from what the team believes, and it carries a review date for every input. The separation is deliberate. Section 15 shows that unrecorded judgement is the main route by which a historical cohort misleads. The record is a proposal for a transaction file; it is not a finding about any investor.
| Record | Required information | Decision supported |
|---|---|---|
| Stated strategy | Asset class, stage, instrument and exclusions, with the source document and its date | Whether the opportunity is inside, adjacent to or outside the mandate |
| Stated geography | Permitted, focus and excluded regions, and any concentration limit | Whether the investor may hold the exposure |
| Ticket capacity | Minimum and maximum commitment, share-of-vehicle limits and co-investment appetite | Whether the cheque can be written at the proposed size |
| Decision-cycle state | Deployment period, pacing, committee calendar and last known allocation status | Whether the investor can act now |
| Legal perimeter | Investor category in each relevant jurisdiction and the permitted route of approach | Whether and how the investor may be approached |
| Relationship | Existing contact, introducer and consent to be contacted | The channel and the person who makes the approach |
| Outreach event | Date, sender, material sent and the rule that selected the investor | Whether the outcome can be used as evidence |
| Outcome | Dated meeting, diligence and commitment events against the definitions above | What the score is tested against |
Proposed transaction record. Entries describe information to obtain; they are not findings about a particular investor. [1, 2, 3]
3 Read the mandate from the investor's own published record
Mandate fit is observable because institutions write their mandates down. The Santiago Principles, published in October 2008 by the International Working Group of Sovereign Wealth Funds, state that a fund's investment policy should be clear and consistent with its defined objectives, risk tolerance and investment strategy. They add that the policy should address the use of external managers and the process by which they are selected, and that a description of the policy should be publicly disclosed. [2] The principles are voluntary. They establish an expectation of disclosure; they do not establish that a given fund's current appetite matches its published policy.
Public pension policies show the form that such criteria take. A private equity programme policy placed before the CalPERS Investment Committee in November 2019 sets strategy targets and ranges: buyouts at 65% within 55% to 75%, growth at 15% within 5% to 20%, credit-related and opportunistic strategies at 10% each within 0% to 15%, and venture capital at 1% within 0% to 7%. It limits a commitment to 25% of any one fund, caps exposure to one general partner as a share of the programme, and requires staff to report monthly on proposals received, their stage in the pipeline and their disposition. [3] The document is a dated committee paper showing proposed revisions. It supports the existence and shape of published limits; it is not evidence of present limits.
The diligence standard used by limited partners points to the same inputs. The Institutional Limited Partners Association questionnaire, updated in November 2021, covers twenty topics. Its investment strategy section asks a manager for anticipated transaction sizes including minimum and maximum, investment pace, holding periods, geographic focus, sector focus and stage, and for any concentration limits across geography or sector. [1] ILPA states that the questionnaire is not a required document. It shows which attributes investors ask about first. It does not rank those attributes or measure how often a mismatch ends a conversation.
These sources justify the scorecard's inputs as categories. None supplies a weight. The points attached to each input in Section 7 are a design choice, and the experiment asks what happens when it is wrong.
4 Treat geography as a mandate input and as a legal perimeter
Geography enters the decision twice. It is a preference, because investors concentrate where they have knowledge and relationships, and it is a permission, because an offer may only be made to certain persons in certain ways. Hochberg and Rauh find that institutional investors of all types overweight private equity funds in their home state, and that for public pension funds the overweighting amounts to 9.7% of the private equity portfolio on average, with in-state investments earning less than out-of-state ones. [5] The study covers United States limited partners and one asset class. It supports treating proximity as a predictor of interest. It does not show that proximity predicts a good outcome for either side.
The regulatory examples below describe the cited versions of the rules. Before any approach, counsel should confirm the law in force, the firm's permissions and the recipient's classification. The cited United States adviser marketing rule defines covered advertisements and restricts untrue statements, unsubstantiated material claims and benefits presented without fair and balanced treatment of risks. Application to a particular communication depends on its content, recipients and applicable exclusions. [7] Rule 506(c) allows an issuer to solicit generally, provided every purchaser is an accredited investor, the issuer takes reasonable steps to verify that status and the other Regulation D conditions are met. [8] In the United Kingdom, a firm must not communicate a promotion for a non-mass market investment that is likely to be received by a retail client, subject to exemptions that depend on the recipient's certified category. [9] Units in unregulated collective investment schemes fall outside that rule and are governed by section 238 of the Financial Services and Markets Act 2000 instead. [9]
The Gulf rules are equally specific. Guidance in the Dubai Financial Services Authority rulebook records that a foreign fund may be offered from the Dubai International Financial Centre only where one of three conditions is met, one of which is a private placement to persons who qualify as Professional Clients with an initial subscription of at least USD 50,000. [10] The Saudi Investment Funds Regulations require a foreign fund to be offered through a licensed distributor by private placement, defined by institutional and qualified clients with a cap on the amount any retail offeree may pay, after notice to the Authority at least fifteen days before the offer. [11] We did not review the rules of the Abu Dhabi Global Market regulator and make no statement about them.
Table 2 converts these rules into scorecard records. The legal perimeter is a gate and never a score. An investor outside the permitted category is removed from the list, or routed through a permitted channel, before any ranking takes place. A high fit score must never be used to justify an approach that the perimeter excludes. The table is a research summary and not legal advice.
| Jurisdiction and source | What the source establishes | Record for the long list |
|---|---|---|
| United States: adviser marketing rule, 17 CFR 275.206(4)-1 | Certain adviser communications to prospective private-fund investors fall within the advertisement definition; covered claims must be substantiated and balanced, and the rule includes gross/net performance conditions and exclusions | Approved material version sent to each investor; substantiation file |
| United States: Rule 506(c) | General solicitation is permitted where all purchasers are accredited and reasonable verification steps are taken | Offering route chosen; verification evidence for each purchaser |
| United Kingdom: FCA COBS 4.12B | Promotions of non-mass market investments must not reach retail clients unless an exemption applies; reasonable steps to establish the recipient's category; unregulated scheme units fall under section 238 | Client category and, where relevant, certificate date |
| DIFC: DFSA Collective Investment Rules, chapter 15 | Foreign fund offers require a designated fund, a suitability recommendation or a private placement to Professional Clients with at least USD 50,000 initial subscription | Route relied on; Professional Client classification |
| Saudi Arabia: CMA Investment Funds Regulations, Part 6 | Foreign funds are offered through a licensed distributor by private placement, defined by institutional and qualified clients with a cap per retail offeree, with fifteen days' prior notice | Distributor appointed; notification date; investor category |
Summary of the cited sources for research purposes; not legal advice. Each row states what the source establishes, not a complete account of the regime. [7, 8, 9, 10, 11]
5 Separate decision-cycle state from structural mandate fit
Strategy, geography and ticket size change slowly. They describe what an investor is permitted and inclined to do. Decision-cycle state changes quickly. It describes whether the investor can act in the period that matters: whether its vehicle is still investing, whether the annual allocation is open, and when its committee next sits. We treat the first three as structural fit and the fourth as timing. An investor with perfect structural fit and a closed allocation is a good name for the next raise and a poor use of time in this one.
The research on venture investors gives a sense of the time involved, with limits. In a survey of 885 institutional venture capitalists at 681 firms, Gompers, Gornall, Kaplan and Strebulaev report that the average deal takes 83 days to close and involves 118 hours of diligence and ten reference calls. [4] These are self-reported figures for venture firms assessing companies. They do not describe limited partners assessing funds, credit investors or Gulf institutions. They establish that the interval from first contact to commitment is long enough for an investor's cycle state to change while a process is running.
Timing also has the worst data. A published policy is dated and stable; a deployment status is inferred from announcements, conversations and the calendar. We therefore expect the decision-cycle record to be out of date more often than any other input, and the experiment assigns it the highest staleness rate. That is an assumption, stated in Table 4, and Section 16 varies it. The input with the most predictive weight may also be the least reliable.
6 What research on investor selection establishes, and what it does not
Three findings from the literature shape the experiment. The first is that investor processes are staged and steeply selective. Gompers and co-authors report that a venture firm considers roughly 100 opportunities for each deal it closes. About one in four leads to a meeting with management, a third of those reach a partners' meeting, about half of those proceed to diligence, and about a third of diligence cases receive a term sheet. [4] The funnel is the investor's own. It supports modelling the outcome as a sequence of conditional stages, which Section 13 does.
The second finding is that access is relational. The same survey reports that over 30% of deals come through professional networks, about 20% are referred by other investors and only about 10% arrive inbound from company management. It also reports that fit with the fund is named as an important selection factor by roughly half of respondents and as the most important by 14%, well behind the management team. [4] Mandate fit is therefore one input among several, and an existing relationship is a separate predictor. In the constructed generating model, the relationship carries additional outcome information. Its incremental out-of-sample predictive value in a real campaign must be evaluated rather than assumed.
The third finding is methodological. Bernstein, Korteweg and Laws ran a randomised field experiment on an online platform, sending nearly 17,000 emails to about 4,500 active early-stage investors and varying which information each email disclosed. The average investor responded strongly to information about the founding team and not to traction or to existing lead investors. [6] The setting is early-stage equity on one platform. Its importance here is the design: because disclosure was randomised, the response can be attributed to the information. A scorecard study needs the same property.
None of these studies measures whether a mandate-fit score predicts a first meeting in a private placement to institutions, and none covers the Gulf. We use them to choose the structure of the experiment and not to set any rate.
7 Specify the scorecard so that it can be shown to be wrong
A scorecard earns its place by being simple enough to audit. We propose four inputs, each scored at three levels, with points that sum to 100. Strategy and decision cycle carry 30 points each; geography and ticket carry 20 each. An input scores nothing when the record shows the opportunity is outside the mandate or the cycle is closed, half its points when it is adjacent or uncertain, and full points when the fit is documented. Table 3 gives the matrix. The legal perimeter of Section 4 is applied before scoring and carries no points.
In equation (1a), S is the score of investor i, w is the points weight of input k, and the recorded level of that input, written with a tilde, takes the value 0, 0.5 or 1. Equation (1b) is the generating model used in the experiment: M equals one when a qualified first meeting occurs; x is the true level of each input; r equals one where a relationship exists; u is an appetite that is never recorded; and the Greek letters are the stated coefficients. The score uses recorded inputs and fixed points. The outcome depends on true inputs and on two things the score does not see.
| Input | Points | Scores nothing | Scores half | Scores in full | Evidence to hold |
|---|---|---|---|---|---|
| Strategy | 30 | Asset class, stage or instrument excluded | Permitted but outside stated focus | Inside stated focus | Policy, mandate or fund documents, dated |
| Geography | 20 | Region excluded | Region permitted, not a focus | Focus region or home market | Policy limits; prior investments |
| Ticket | 20 | Cheque outside stated range | At the edge of the range or of a vehicle-share limit | Inside the range | Commitment range; share-of-fund limit |
| Decision cycle | 30 | Vehicle fully committed or allocation closed | Mid-cycle or status uncertain | Actively deploying with an open allocation | Dated status note and its source |
| Legal perimeter | Gate | Not approached, or routed through a permitted channel | Not applicable | Eligible on a documented basis | Category and route, per Table 2 |
Proposed scorecard. Points are a design choice, not an estimate from data. The perimeter is a gate applied before scoring. [1, 2, 3]
Three choices make the scorecard testable. Its inputs are categorical, so two analysts reading the same documents should reach the same score. Its weights are fixed before outcomes are known. And it leaves the relationship out, so that the value of fit can be separated from the value of access.
8 Judge the score on discrimination, calibration and lift
A score has to do two jobs, and they are measured differently. Discrimination is the ability to rank: investors who take a meeting should score higher than those who do not. The standard measure is the area under the receiver operating characteristic curve. Fawcett shows that this area equals the probability that a randomly chosen positive case is ranked above a randomly chosen negative case, that random ordering gives 0.5, and that the Gini coefficient is twice the area minus one. [12] AUC is insensitive to changing class proportions while preserving the score distributions within each outcome class. Comparisons across raises still require attention to case mix and the outcome mechanism.
In equation (2a), a denotes an investor who took a qualified meeting and b one who did not; ties receive half credit, which matters for a scorecard with few distinct values. In equation (2b), the lift of decile d is its meeting rate, meetings m over investors n in that decile, divided by the rate for the whole list. Lift answers the practical question of how much better the first tranche is than the average. Fawcett notes that lift, unlike the ROC curve, moves with the base rate, so a lift from one raise should not be carried to another without its base rate. [12]
Calibration is the second job: a predicted 20% should come true about one time in five. Van Calster and co-authors describe calibration as the weak point of predictive models and distinguish levels of it. Mean calibration compares the average prediction with the observed rate. Weak calibration is summarised by an intercept with a target of zero and a slope with a target of one; a slope below one means predictions are too extreme. They list overfitting, differences between settings, drift over time and measurement error as causes, and note that a poorly calibrated model can be less useful than a competitor with a lower AUC. [13]
In equation (3a), the fitted probability for investor i, written with a hat, is regressed against the outcome on the log-odds scale; alpha is the calibration intercept, estimated with the slope held at one, and lambda is the calibration slope. Equation (3b) is the Brier score B, the mean squared gap between prediction and outcome over n investors; lower is better, and it is comparable only between scores tested on the same outcomes. Supervisory guidance on model risk for banks, issued in April 2026, describes the comparison of model outputs with real outcomes as outcomes analysis and observes that it helps evaluate the quality of expert judgement where a design relies on it. [16] That guidance addresses banking organisations and is not a rule for advisers; we borrow its vocabulary, not its authority.
9 A constructed population with stated generating assumptions
The experiment is constructed in full. We generate 12,000 investors with a fixed random seed of 1376. Each investor receives a true level for strategy, geography, ticket and decision cycle, drawn independently with the shares in Table 4. One investor in five has an existing relationship with the team. Each has an unrecorded appetite, drawn from a standard normal distribution, which stands for everything that moves an investor and never reaches a database. Each also has a prominence value that has no effect on any outcome.
Outcomes follow equation (1b). The log-odds of a qualified first meeting rise by 2.2 for full strategy fit, 2.0 for an open decision cycle, 1.2 for ticket fit and 1.0 for geography, with 0.9 for a relationship and 0.7 for each unit of appetite. Diligence and commitment are generated by further stated equations, conditional on the previous stage. Under these inputs 12.5% of the population would take a qualified meeting if approached. That rate is an input consequence, not a market estimate. The team does not see the true levels. It sees records, and each record is out of date with a stated probability: 5% for strategy and geography, 15% for ticket and 20% for decision cycle.
The population is split at random into a development half and a validation half of 6,000 investors each. The scorecard's points are fixed in advance and use neither half. The development half is used only to fit the map from score to probability. All reported discrimination, lift and calibration figures come from the validation half, in which every investor is approached. That last condition is the important one. It is the constructed equivalent of a fully randomised campaign, and it is what a real team almost never has. Section 15 removes it.
| Input | Assumption | Status |
|---|---|---|
| Population | 12,000 investors; seed 1376; halves of 6,000 | Constructed |
| Strategy fit (out / adjacent / core) | 40% / 35% / 25% | Assumed |
| Geography fit (out / permitted / focus) | 30% / 35% / 35% | Assumed |
| Ticket fit (outside / edge / inside range) | 30% / 40% / 30% | Assumed |
| Decision cycle (closed / mid-cycle / open) | 30% / 40% / 30% | Assumed |
| Existing relationship | 20% of investors | Assumed |
| Meeting log-odds | -5.95 + 2.2 strategy + 1.0 geography + 1.2 ticket + 2.0 cycle + 0.9 relationship + 0.7 appetite | Generating model |
| Diligence log-odds, given a meeting | -2.3 + 1.2 strategy + 0.8 ticket + 0.6 cycle + 0.5 appetite | Generating model |
| Commitment log-odds, given diligence | -2.3 + 1.0 ticket + 1.0 cycle + 0.4 geography + 0.5 appetite | Generating model |
| Unrecorded appetite; prominence | Standard normal each; prominence has no effect on outcomes | Assumed |
| Scorecard points | 30 strategy / 20 geography / 20 ticket / 30 cycle | Design choice |
| Records out of date, base | 5% strategy / 5% geography / 15% ticket / 20% cycle | Assumed |
| Records out of date, stress | 15% / 10% / 30% / 50% | Stress input |
| Wrong-weight scorecard | 15 strategy / 45 geography / 40 ticket / 0 cycle | Stress input |
| Colder market | Every meeting log-odds lower by 0.7; fresh outcome draw | Stress input |
| First wave | 100 approaches per 1,000 names | Design choice |
| Cohort resampling | 2,000 random cohorts at each size, without replacement | Method |
Entirely constructed. Levels are scored 0, 0.5 and 1. No input is an observed market rate.
10 Discrimination: the score ranks investors better than the alternatives
On the validation half the base scorecard reaches an AUC of 0.744, equivalent to a Gini coefficient of 0.488. Drawn at random, an investor who took a qualified meeting outscores one who did not about three times in four. Two benchmarks place that figure. Ranking by prominence, the habit of starting with the largest and best-known names, gives 0.524, which is close to chance because prominence was given no effect on outcomes. Ranking by relationship alone gives 0.550: relationships matter in the generating model, but only a fifth of investors have one, so the rule cannot order the rest.
The ceiling is as informative as the result. Ranking investors by the generating probability itself, which no team could know, gives 0.833. The gap between 0.744 and that ceiling has three sources. Records are imperfect: the same weights applied to perfect records reach 0.782. The scorecard omits the relationship. And the appetite term is unobservable by construction. A score built on documents cannot close the last gap, and a team should not expect it to.
Weights matter less than might be expected. A logistic regression fitted to the development half, using the four recorded inputs and the relationship, reaches 0.758. The four fit coefficients are normalised to a total of 100; their independently rounded shares are 35 / 18 / 19 / 29 and sum to 101 because of rounding. They are close to the 30, 20, 20 and 30 chosen in advance. A scorecard with equal weights of 25 reaches 0.732. In this population, the choice of inputs and the quality of records move discrimination more than fine adjustment of points.
11 Lift by decile concentrates the first wave
Table 5 and Figure 1 rank the validation half by score and divide it into ten equal groups. Because a four-input scorecard produces few distinct values, investors with equal scores are ordered by a fixed random key, and the score ranges of adjacent deciles therefore touch. The top decile meets at 36.2%, which is 2.89 times the average of 12.5%. The bottom decile meets at 2.5%, a lift of 0.20. The top two deciles hold 44.6% of all qualified meetings, the top three 58.7% and the top half 81.0%.
The shape of the curve carries the decision. Lift falls steeply after the first decile and crosses one between the fourth and fifth. Below that point each approach is less productive than a random one, and by the eighth decile it is roughly a quarter as productive. A team that intends to cover the whole list gains nothing in total meetings from the score, and gains only in the order in which they arrive. The score is a sequencing tool, and its value is highest when capacity is tightest.
| Decile | Investors | Score range | Meetings | Generated rate | Predicted rate | Lift | Cumulative share |
|---|---|---|---|---|---|---|---|
| 1 | 600 | 75 to 100 | 217 | 36.2% | 39.1% | 2.89 | 28.9% |
| 2 | 600 | 65 to 75 | 118 | 19.7% | 23.1% | 1.57 | 44.6% |
| 3 | 600 | 60 to 65 | 106 | 17.7% | 16.7% | 1.41 | 58.7% |
| 4 | 600 | 55 to 60 | 103 | 17.2% | 13.0% | 1.37 | 72.4% |
| 5 | 600 | 50 to 55 | 64 | 10.7% | 9.6% | 0.85 | 81.0% |
| 6 | 600 | 45 to 50 | 53 | 8.8% | 7.9% | 0.71 | 88.0% |
| 7 | 600 | 35 to 45 | 40 | 6.7% | 5.8% | 0.53 | 93.3% |
| 8 | 600 | 30 to 35 | 17 | 2.8% | 4.3% | 0.23 | 95.6% |
| 9 | 600 | 20 to 30 | 18 | 3.0% | 3.0% | 0.24 | 98.0% |
| 10 | 600 | 0 to 20 | 15 | 2.5% | 1.6% | 0.20 | 100.0% |
MatchPoint analysis of the constructed population. Model output under stated inputs; not an observed cohort result. Rounded display. Predicted rate uses the map fitted on the development half.
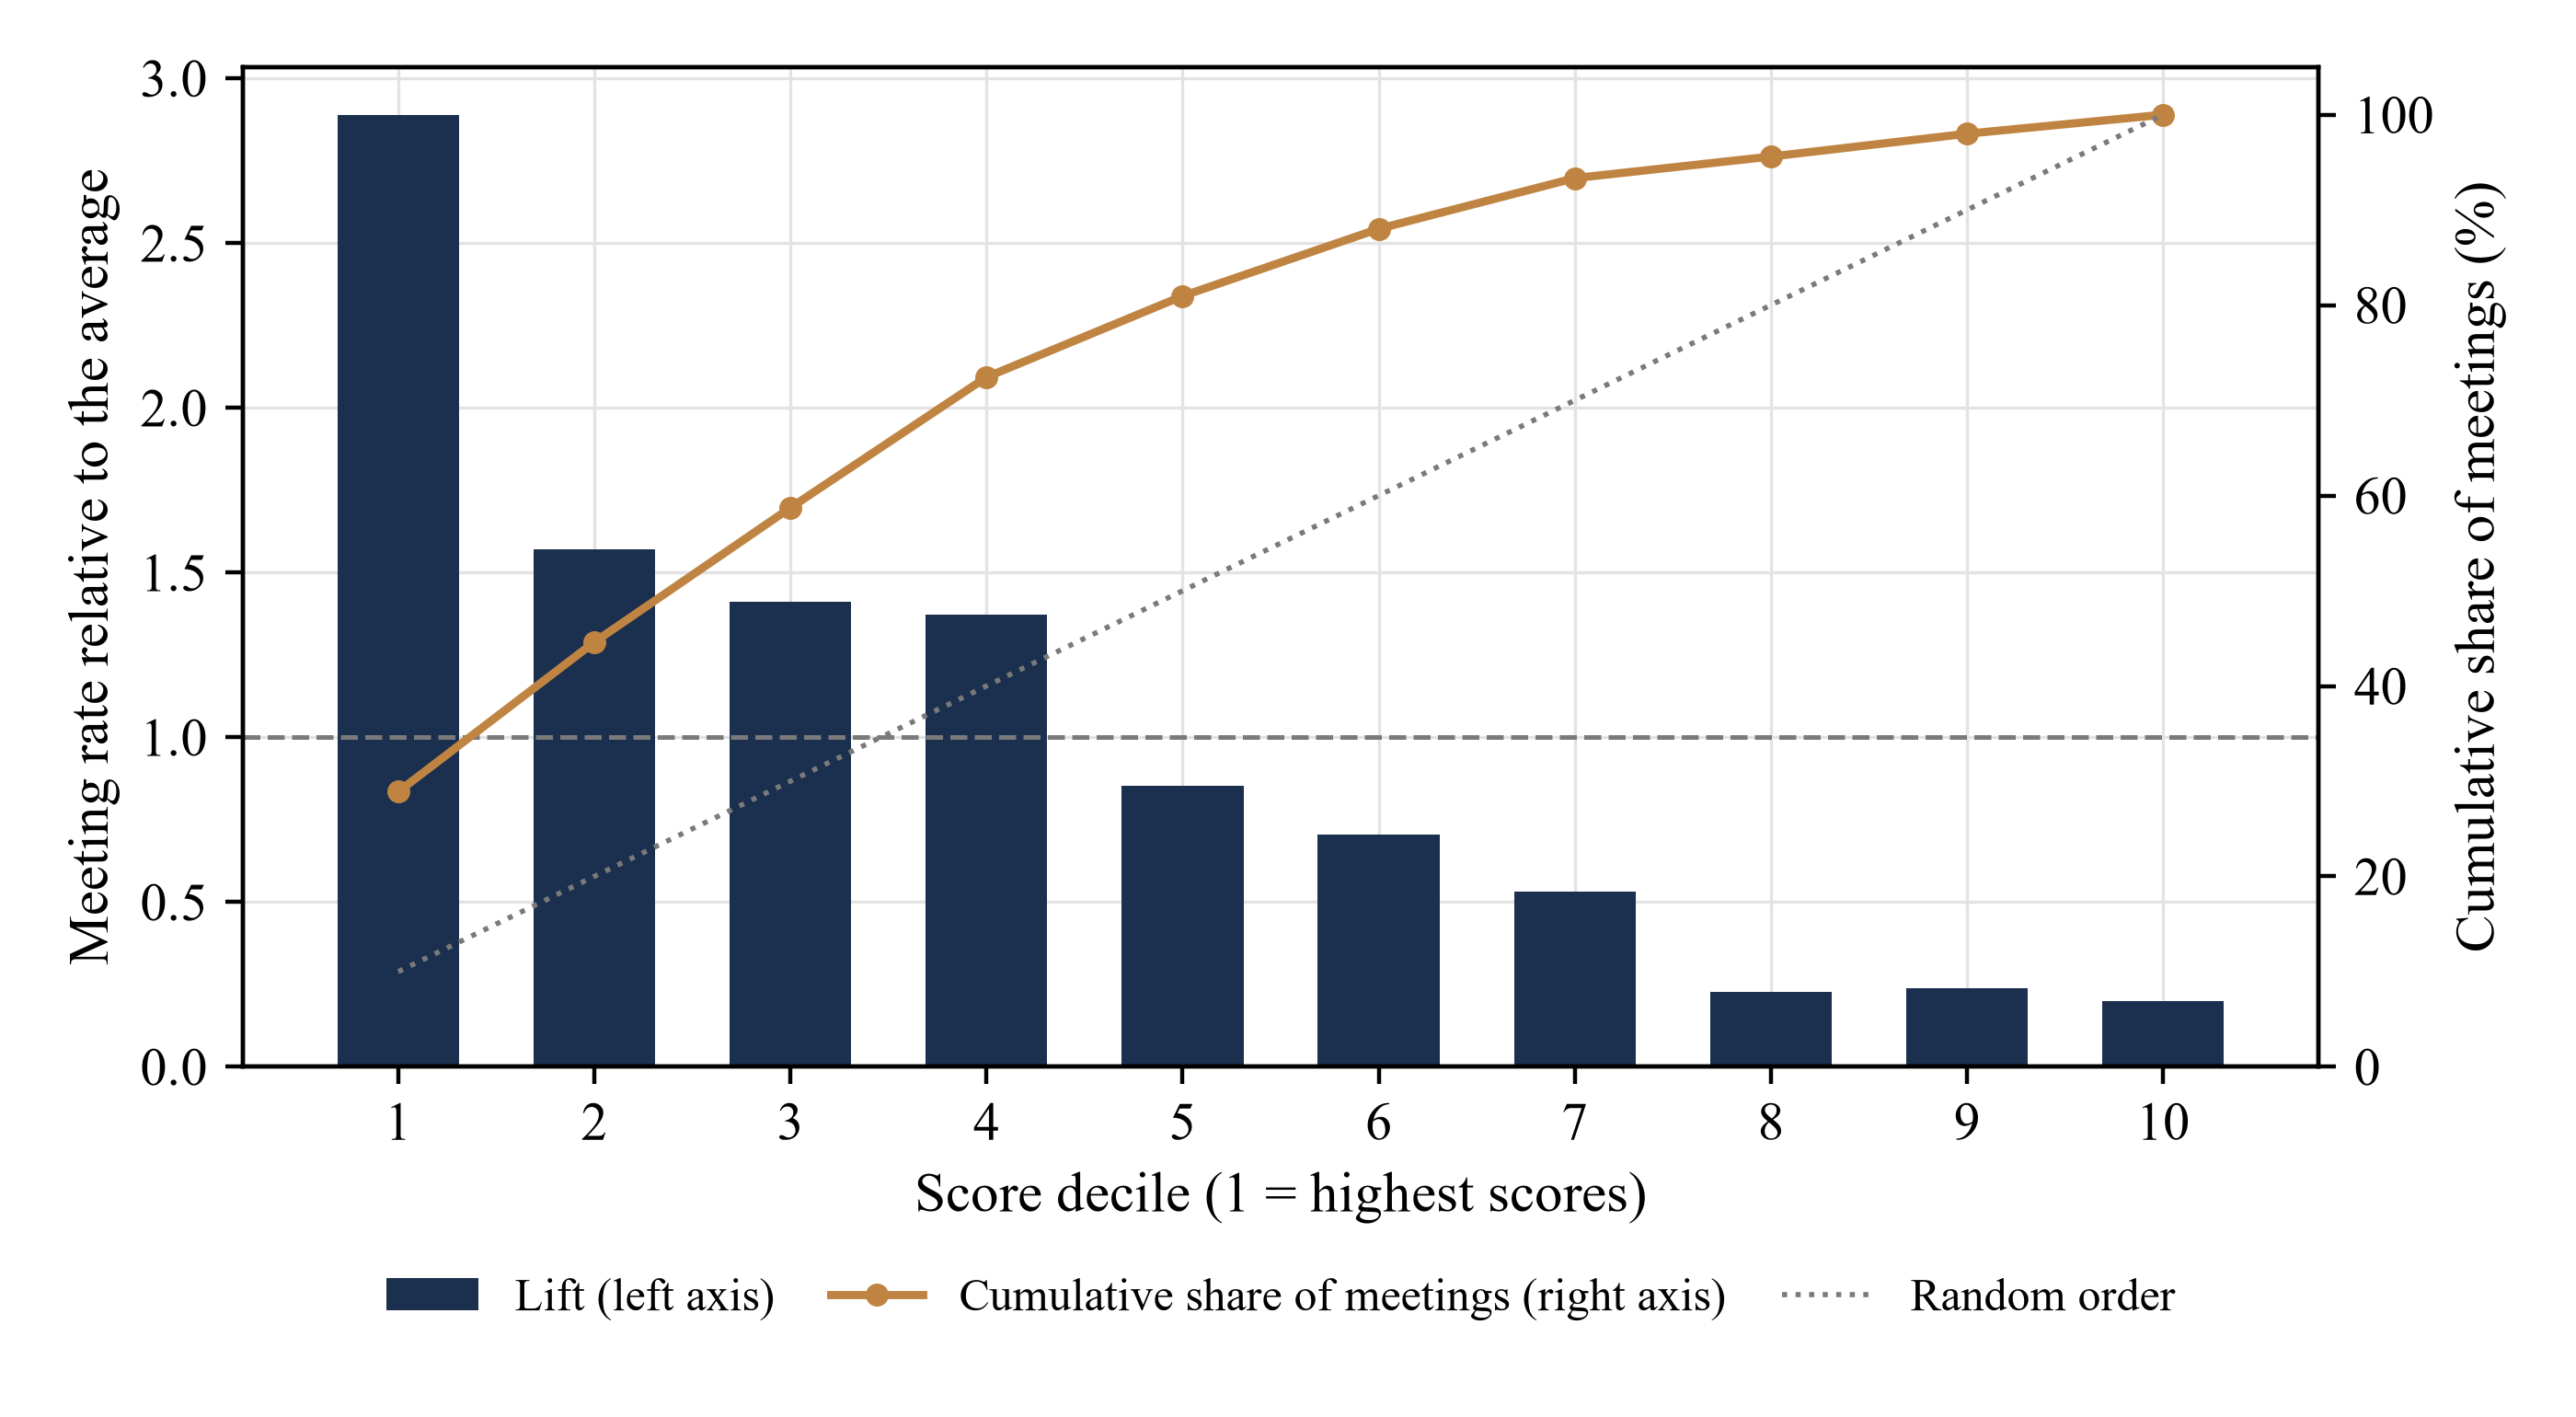
Scroll horizontally to read the figure at full size. You can also open the full-size figure.
MatchPoint analysis of the constructed population, validation half. Model output under stated inputs; no observed cohort.
12 Calibration converts a rank into a planning probability
A rank tells the team where to start. A probability tells it how many approaches a target number of meetings requires, and that is the figure a client asks for. We fit a two-parameter logistic map from score to probability on the development half, with an intercept of -4.89 and a coefficient of 5.30 on the score divided by 100. The map assigns 9.6% to a score of 50, 23.4% to a score of 70 and 60.0% to a score of 100. Applied to the validation half, it predicts an average of 12.4% against a generated rate of 12.5%.
The calibration intercept on the validation half is 0.01 and the slope is 0.89. Mean calibration is therefore sound, while the slope below one indicates predictions that are slightly too extreme. Table 5 shows where: the top decile was predicted at 39.1% and met at 36.2%, and the largest gap between predicted and generated rates in any decile is 4.2 percentage points. Figure 2 plots the ten deciles against the diagonal. The Brier score is 0.0994, against 0.1095 for a forecast that gives every investor the average rate, an improvement of 9.2%.
Two cautions follow. The slope was estimated on 751 meetings from a single draw of outcomes, and part of its distance from one is sampling variation rather than a property of the map; it is reported as found and was not adjusted. More importantly, the map is the fragile part of the scorecard. The score weights remain fixed in this stress test, while the probability map was fitted to the original constructed response mechanism. Section 16 keeps the score ordering fixed while changing meeting probabilities; its colder-market case overstates meetings by more than half.
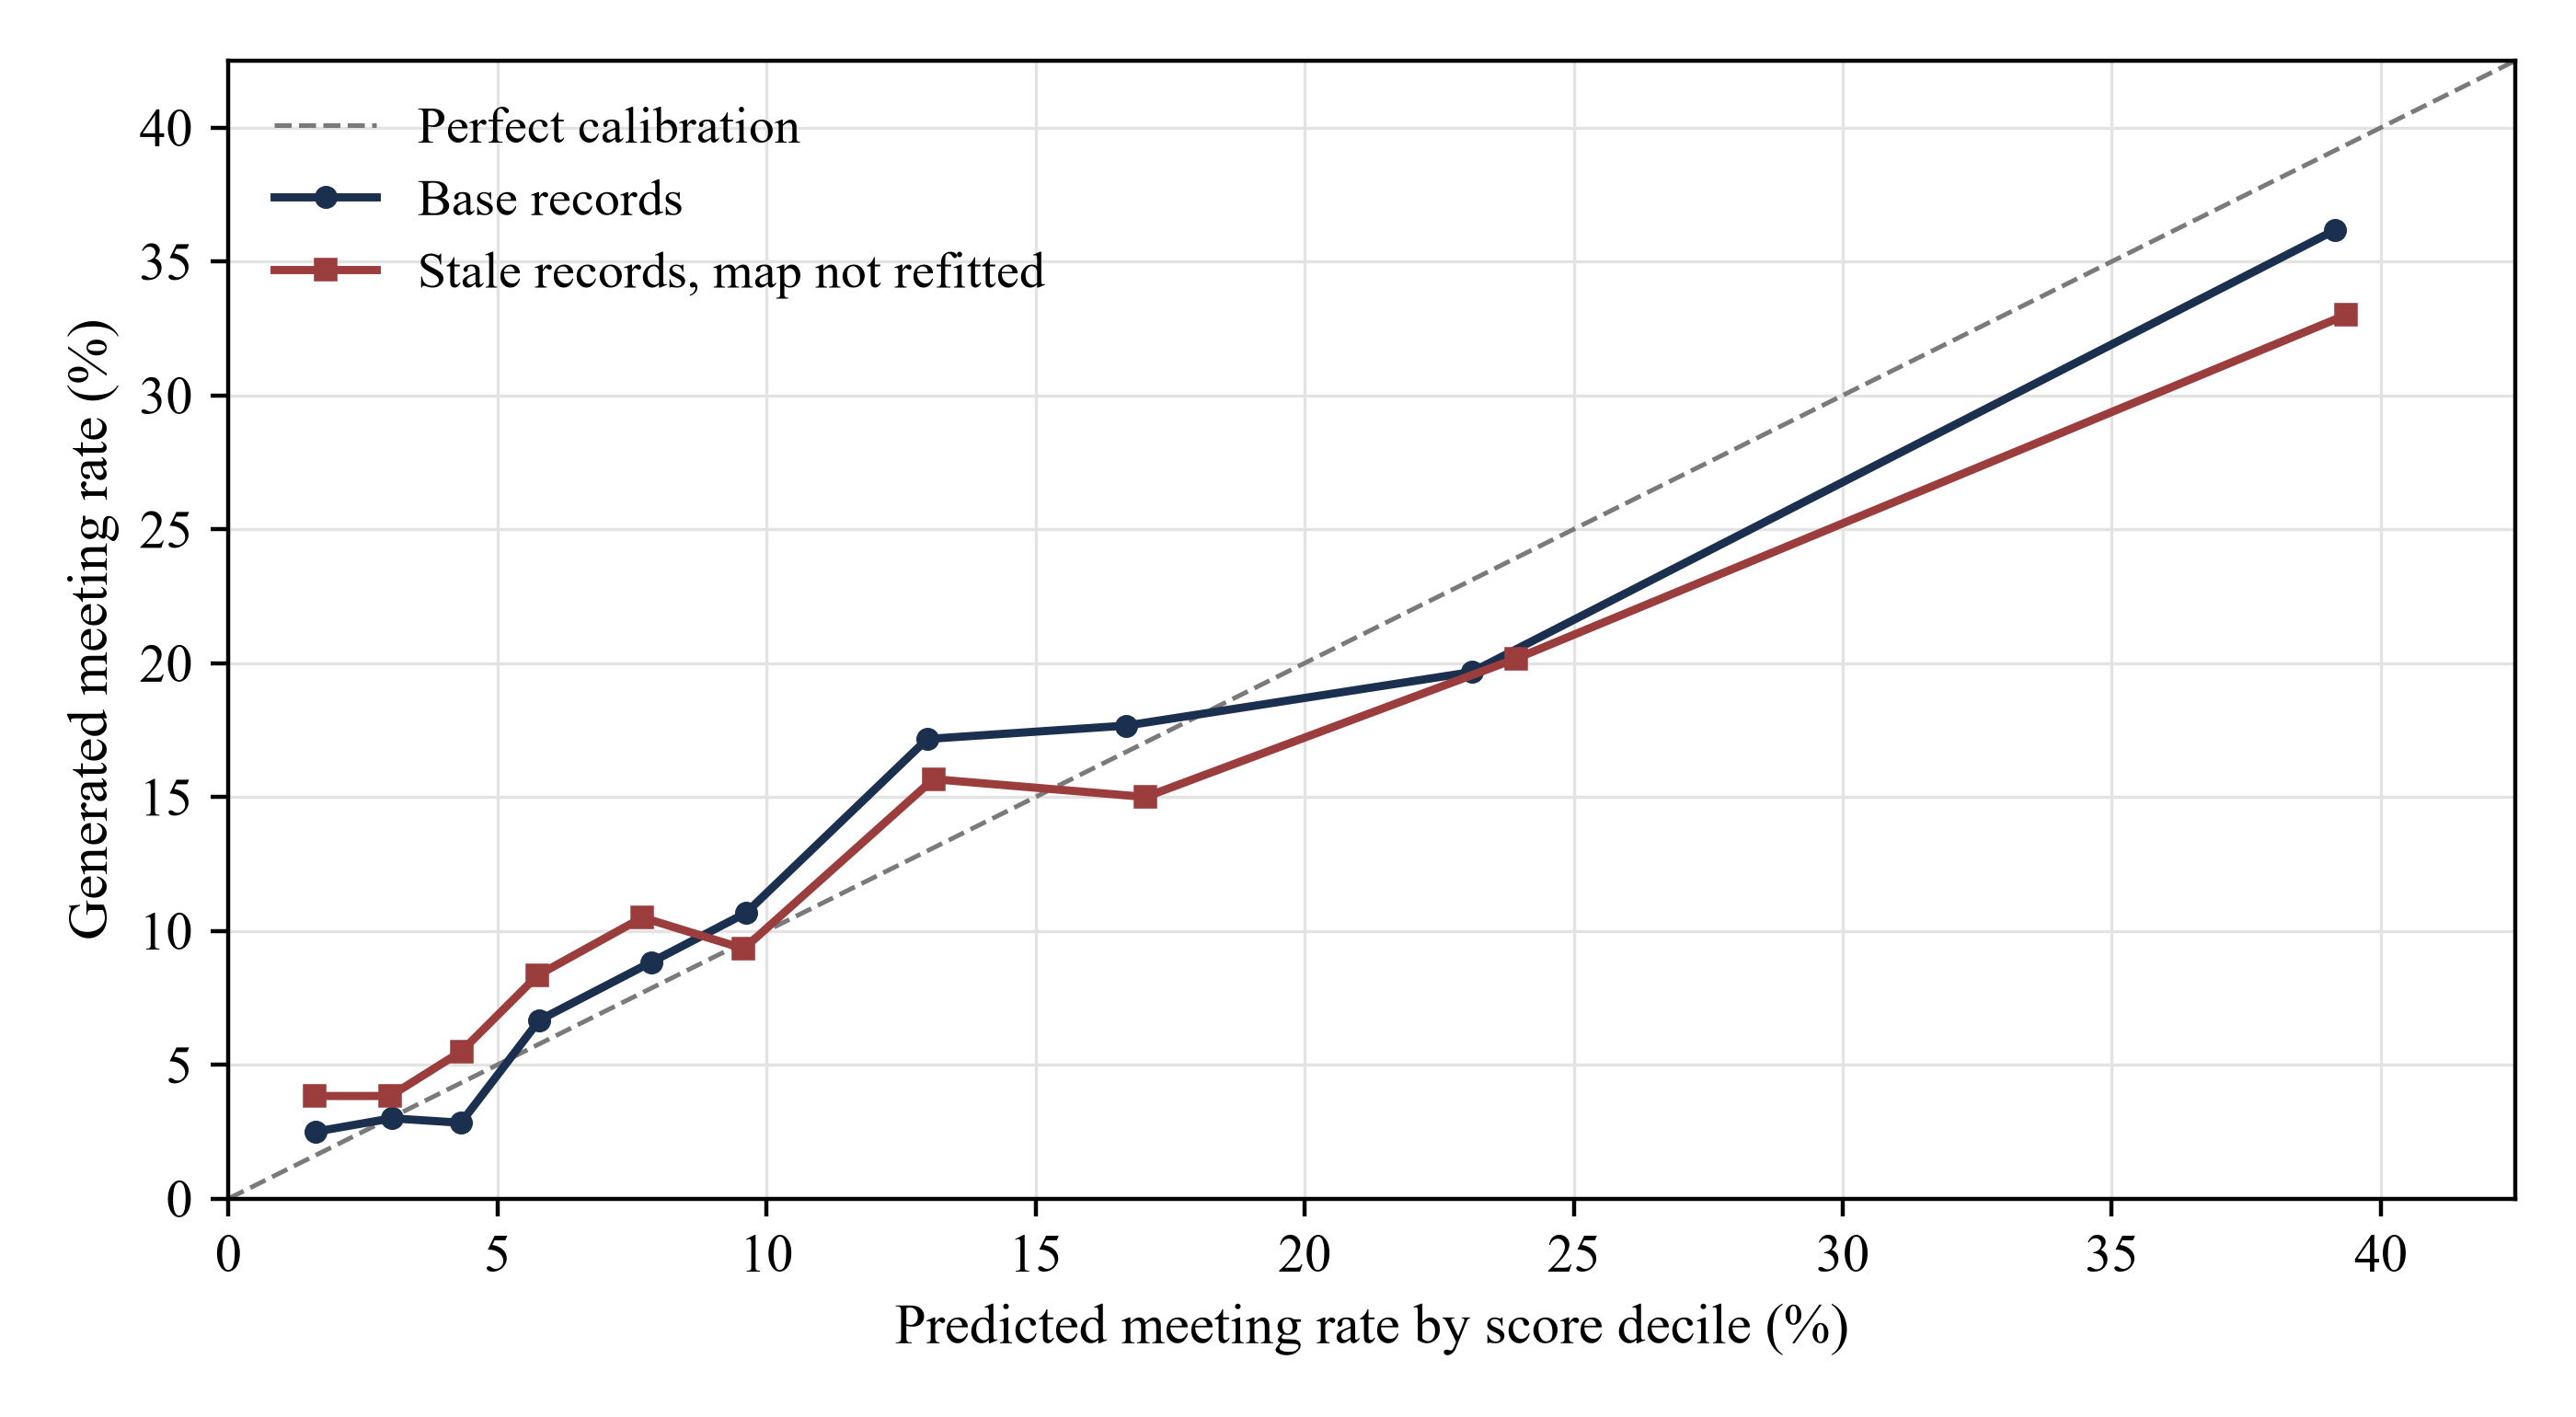
Scroll horizontally to read the figure at full size. You can also open the full-size figure.
MatchPoint analysis of the constructed population, validation half. The stale-record line applies the map fitted on base records without refitting.
13 Follow the funnel from first meeting to commitment
A first meeting is an intermediate outcome. The experiment therefore carries each investor through diligence and commitment, using the conditional structure that the venture survey documents for the investor's side of the process. [4]
In equation (4a), C equals one when investor i commits; p is the probability of a qualified meeting, q the probability of diligence given a meeting and c the probability of commitment given diligence. In equation (4b), E is the expected number of commitments from a first wave of K approaches, and T is the set of K investors ranked highest by whichever rule is being tested. Strategy and ticket drive diligence in the generating model, ticket and decision cycle drive commitment, and the unrecorded appetite enters every stage.
Table 6 and Figure 3 report generated outcomes by score band. The top quintile meets at 27.9%, converts 47.2% of meetings to diligence and 52.5% of diligence cases to commitment, for 69.2 commitments per 1,000 approaches. The middle three quintiles produce 15.0 and the bottom quintile 2.5. The top quintile supplies 83 of the 140 commitments, or 59.3%. The score ranks commitments with an AUC of 0.791, a little higher than for meetings, because the inputs that open the door also carry the later stages.
One figure qualifies that result. Among investors who have already taken a meeting, the score separates those who proceed to diligence with an AUC of only 0.595. Once an investor is in the room, the scorecard has little more to say; what remains is the appetite it cannot see and the quality of the opportunity, which the experiment does not model. The absolute conversion rates are authored and are far higher than the roughly one closed deal per 100 opportunities that venture firms report. [4] They describe a screened long list in a constructed case and should not be read as market rates.
| Score band | Names | Meetings | Diligence | Signed | Meeting rate | Diligence rate | Signing rate | Signed per 1,000 |
|---|---|---|---|---|---|---|---|---|
| Top quintile | 1,200 | 335 | 158 | 83 | 27.9% | 47.2% | 52.5% | 69.2 |
| Middle three | 3,600 | 383 | 145 | 54 | 10.6% | 37.9% | 37.2% | 15.0 |
| Bottom quintile | 1,200 | 33 | 8 | 3 | 2.8% | 24.2% | 37.5% | 2.5 |
| All | 6,000 | 751 | 311 | 140 | 12.5% | 41.4% | 45.0% | 23.3 |
MatchPoint analysis of the constructed population. Model output under stated inputs; not an observed cohort result. Rounded display. Names are investors approached; signed means a commitment; diligence rate is per meeting and signing rate per diligence case.
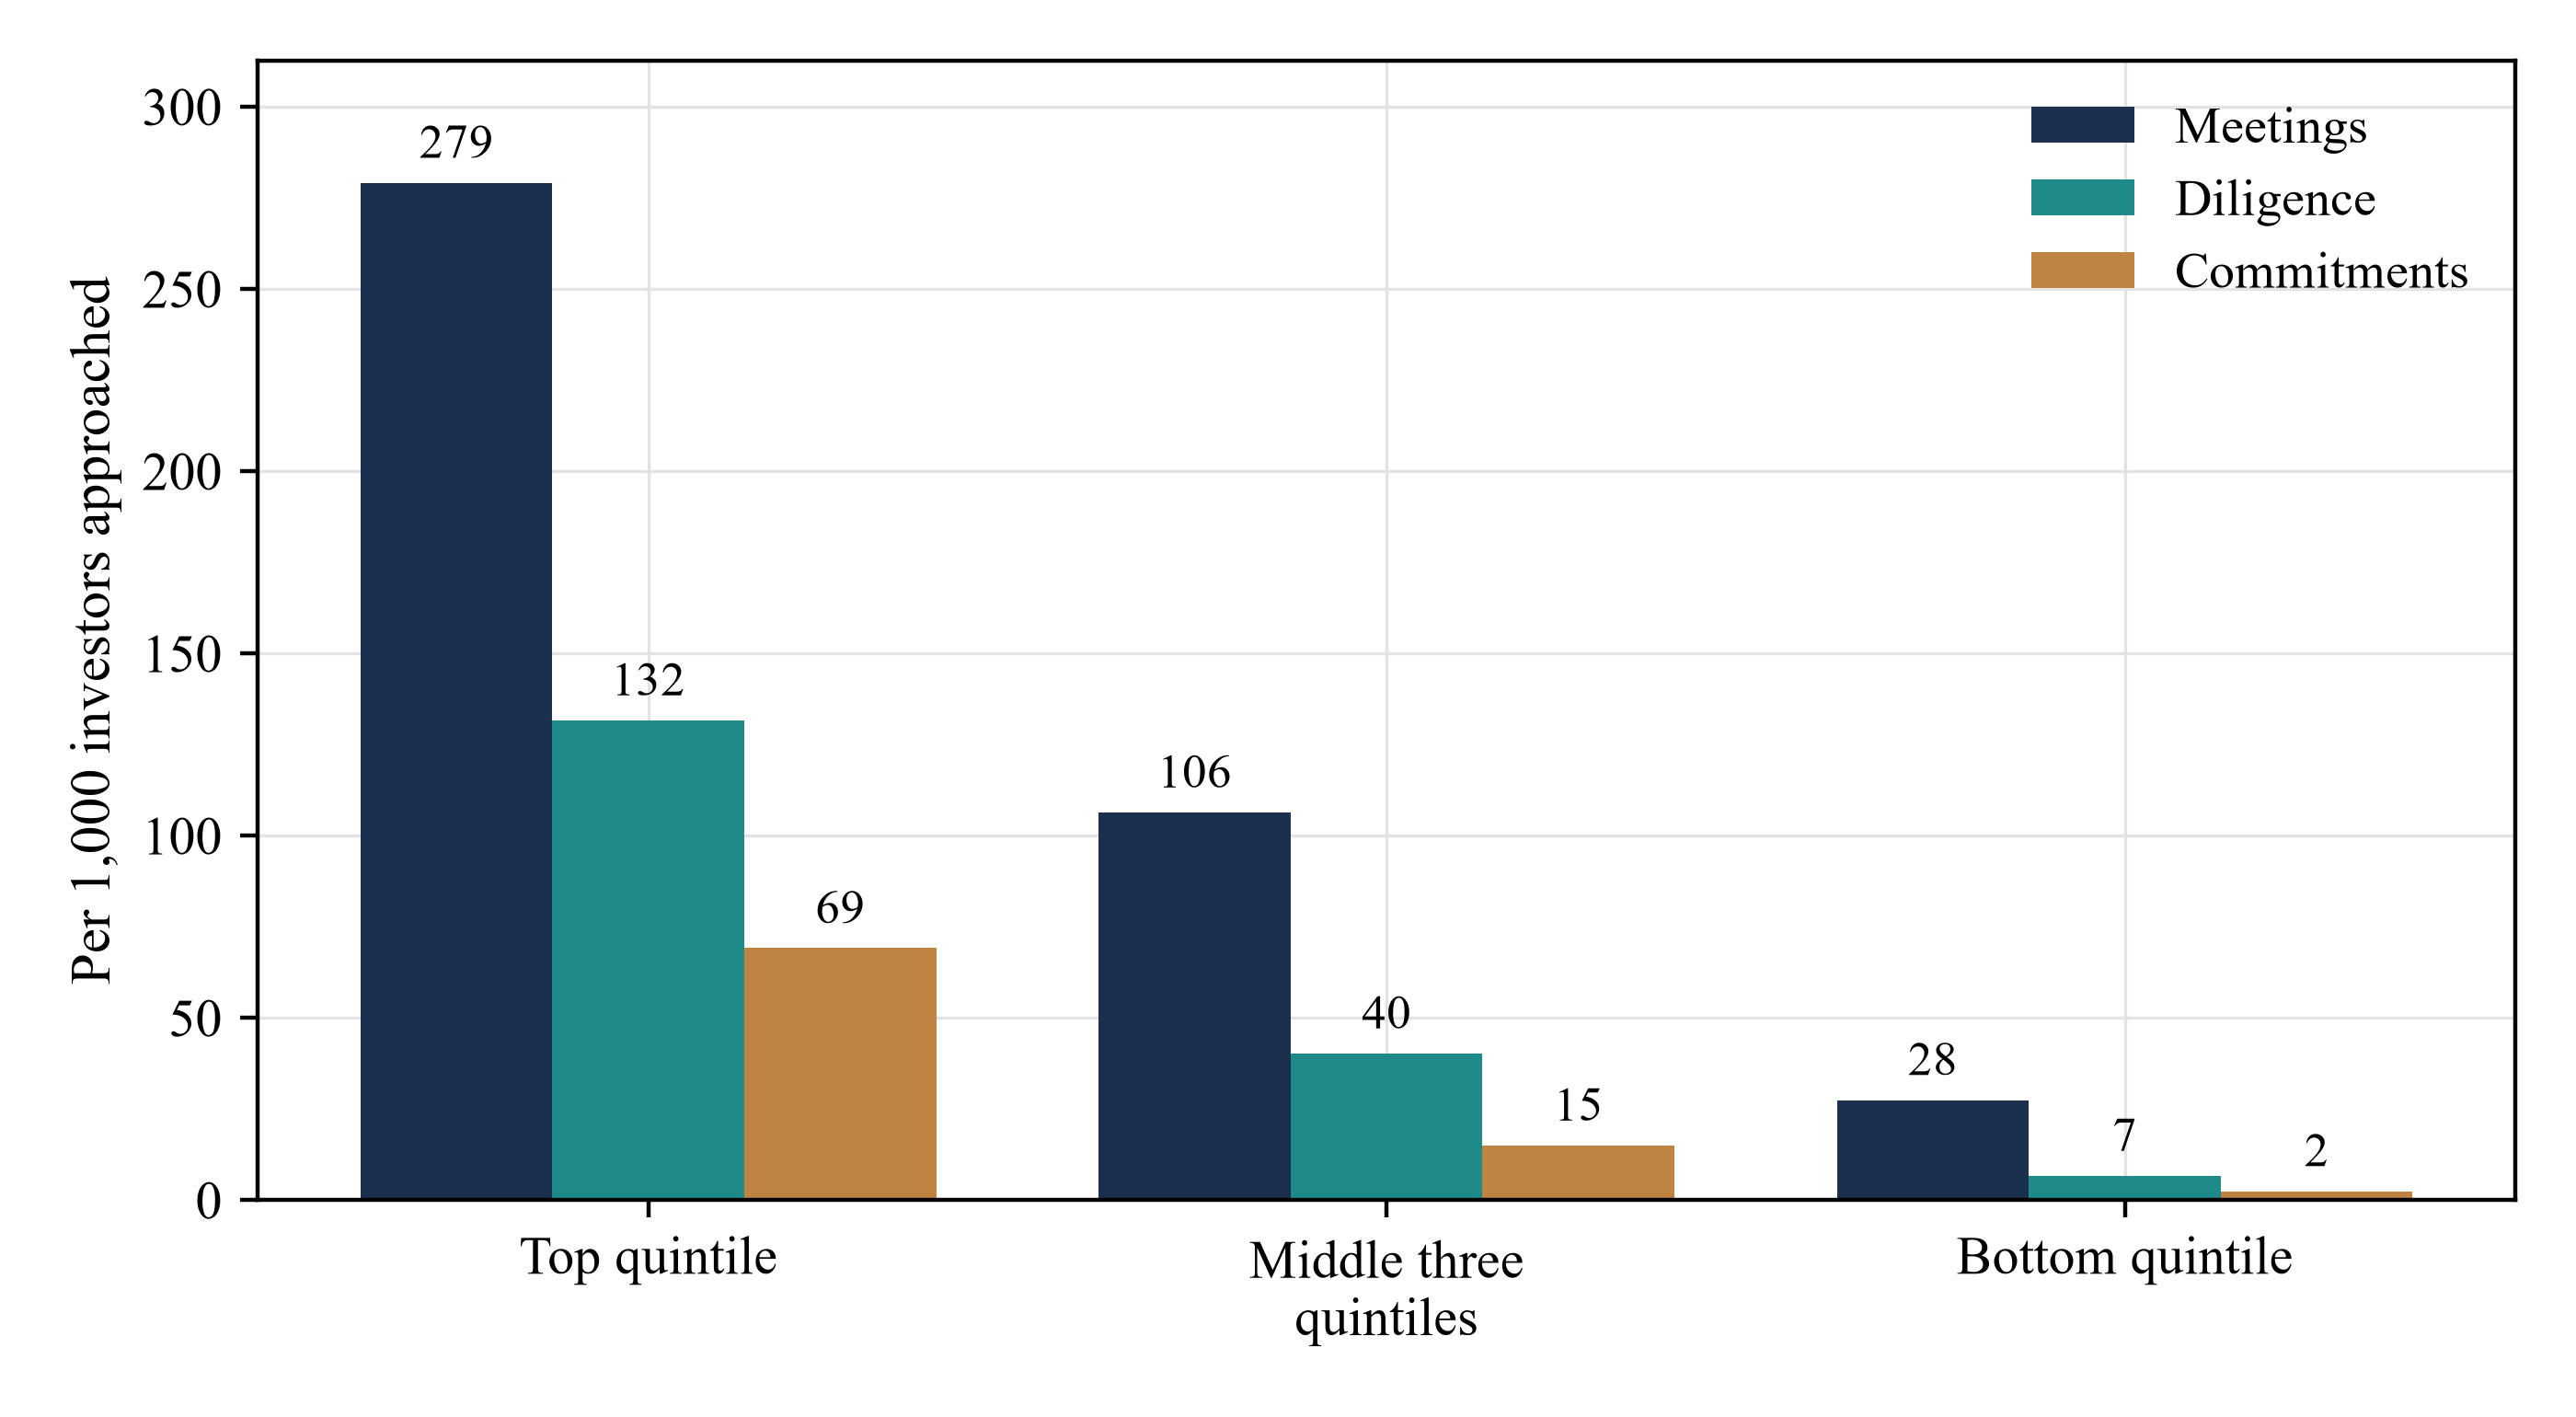
Scroll horizontally to read the figure at full size. You can also open the full-size figure.
MatchPoint analysis of the constructed population, validation half. Generated outcomes; funnel rates are authored inputs.
14 First-wave capacity turns lift into a decision
The sequencing decision has a budget. Suppose the principals can make 100 well-prepared approaches in the first wave for every 1,000 names on the long list. Table 7 compares ranking rules on that budget, using expected values from the generating probabilities. This removes fresh Bernoulli outcome noise from the comparison while retaining dependence on the finite constructed population, ranking and tie-breaking draws, and assumed parameters. Random order yields 12.9 expected meetings and 2.40 commitments. Prominence yields 13.1 and 2.44. Relationship first yields 19.9 and 3.55. The base scorecard yields 36.8 and 8.80: 2.8 times the meetings and 3.7 times the commitments of random order.
The comparison with relationship-led outreach is the one most teams face. Starting with known investors is better than random in the constructed case, because relationships carry a real effect, yet the scorecard produces 2.5 times as many expected commitments from the same number of approaches. The fitted model that uses both reaches 39.5 meetings. The practical reading is that fit should choose the names and the relationship should choose the route. The scorecard captures 74% of the meetings that perfect foresight would deliver, and no document-based ranking in the table closes that gap.
| Ranking rule | Approaches | Expected meetings | Expected diligence | Expected commitments | Approaches per commitment |
|---|---|---|---|---|---|
| Random order | 100 | 12.9 | 5.5 | 2.40 | 42 |
| Prominence only | 100 | 13.1 | 5.6 | 2.44 | 41 |
| Relationship first | 100 | 19.9 | 8.3 | 3.55 | 28 |
| Wrong weights | 100 | 23.0 | 10.7 | 5.56 | 18 |
| Stale records | 100 | 31.1 | 15.2 | 6.94 | 14 |
| Base scorecard | 100 | 36.8 | 18.6 | 8.80 | 11 |
| Fitted weights plus relationship | 100 | 39.5 | 20.0 | 9.39 | 11 |
| Generating probability (not attainable) | 100 | 49.6 | 27.4 | 13.78 | 7 |
MatchPoint analysis of the constructed population. Model output under stated inputs; not an observed cohort result. Rounded display. Expected values from generating probabilities.
Figure 4 is the sequencing map. It separates structural fit points, out of 70, from the recorded decision-cycle state, and shows the expected meeting rate in each cell together with the wave to which most of its investors are assigned. At the highest fit band the rate rises from 18.1% when the cycle is recorded closed to 44.5% when it is open, a factor of 2.5. Waves are set on the total score: 70 or more, 55 to 69, 40 to 54, and a hold group below 40. Wave 1 is 16.8% of the list and holds 43.6% of expected meetings. Waves 1 and 2 together are 40.2% of the list and hold 73.7%.
The hold group is the less comfortable half of the decision. It is 30.9% of the list and holds 7.5% of expected meetings, at 33.6 approaches per meeting against 3.2 in Wave 1. Holding those names protects senior time and the reputation of the opportunity. It also forgoes real meetings, since a closed cycle recorded in error is still an open one. The map therefore needs a refresh rule: a hold is a dated status, reviewed when the record is, and never a permanent exclusion.
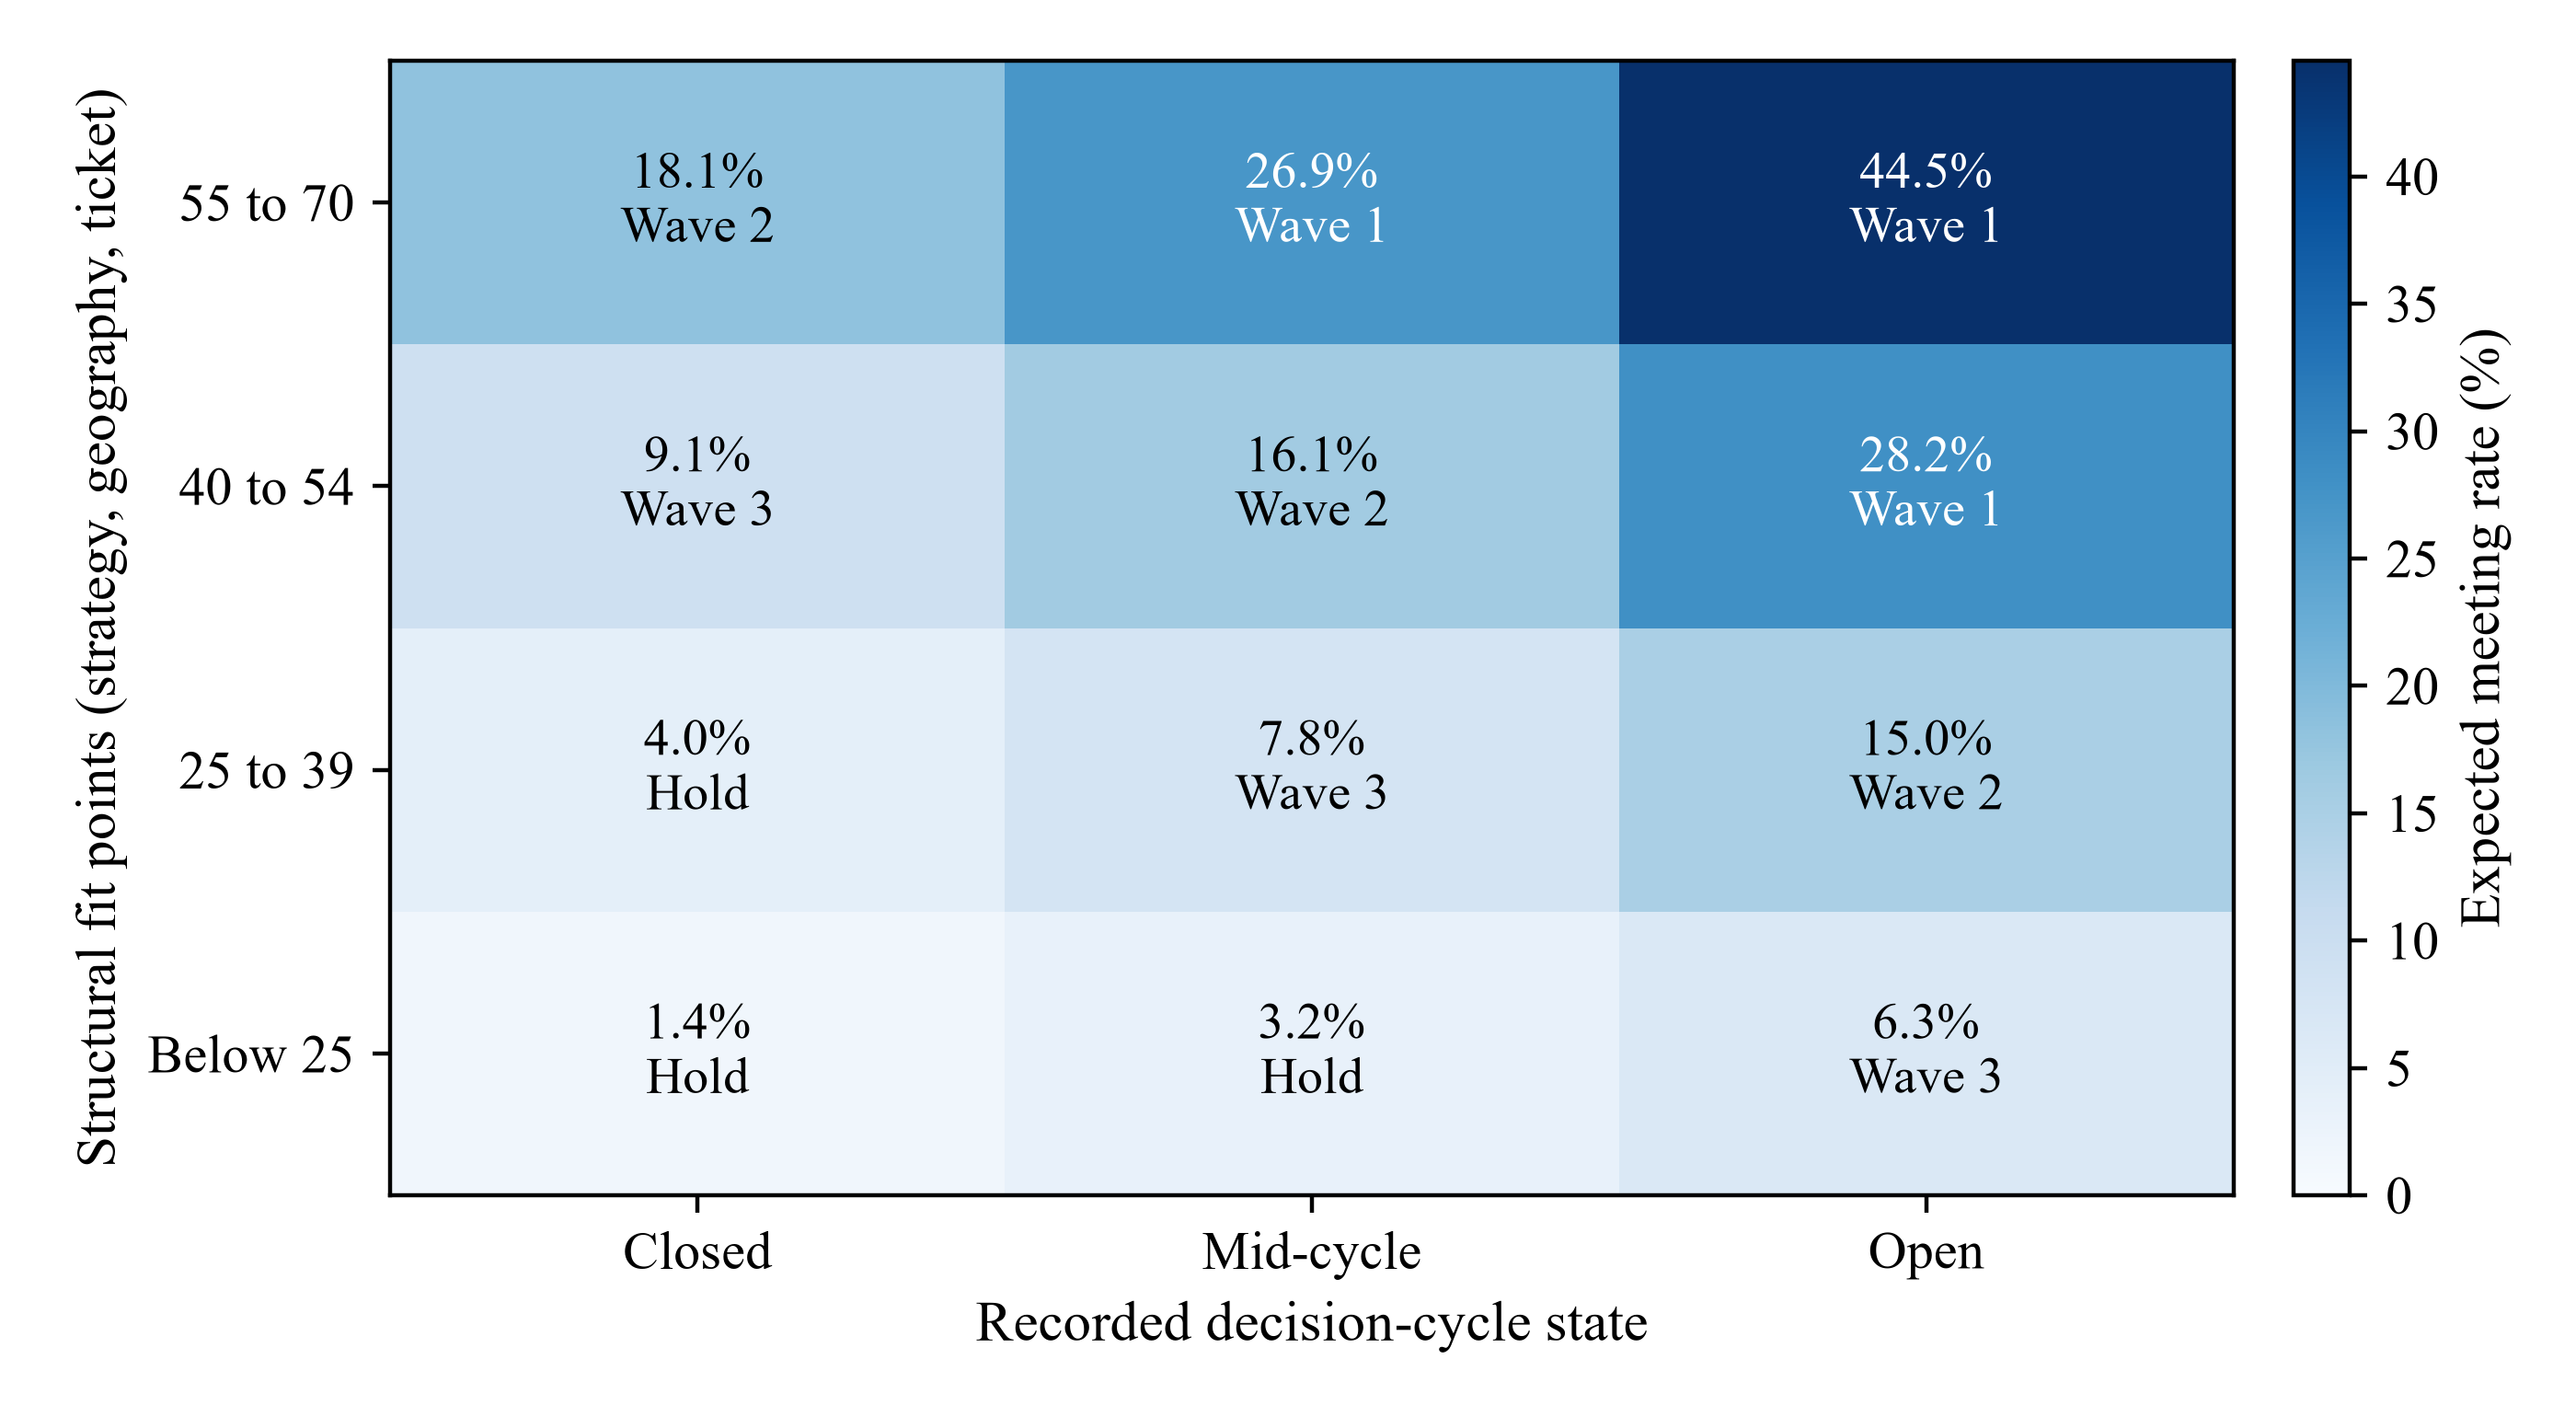
Scroll horizontally to read the figure at full size. You can also open the full-size figure.
MatchPoint analysis of the constructed population, validation half. Cells show the mean generating probability of a qualified meeting and the most common wave.
15 Non-random outreach changes what a cohort appears to show
Everything so far assumed that every investor was approached. A real history is different: the team chose whom to contact, and it chose for reasons. Heckman characterises sample selection bias as a specification error and proposes an estimator that corrects it. [14] When the rule that admits a case to the sample is related to the outcome, estimates from the sample are biased unless the rule is modelled. Seaman and White review one remedy, inverse probability weighting, in which each observed case is weighted by the reciprocal of its probability of being observed, and they discuss how the model for that probability is chosen. [15]
In equation (5a), A equals one when investor i was approached, pi is the probability of that approach, z collects recorded traits and u is the unrecorded appetite. In equation (5b), the reweighted meeting rate, written mu with a hat, sums outcomes over approached investors, each divided by an estimated approach probability that can use recorded traits only. We test three designs on the whole population. In the first, a quarter of investors are approached at random. In the second, the team favours relationships and prominent names, both of which are recorded. In the third, it favours relationships, true fit and investors whose appetite it senses, only the first of which is recorded.
Table 8 and Figure 5 give the results. Randomised outreach behaves as it should: the cohort meets at 12.2%, the forecast for the investors not yet approached is 12.2% and their generated rate is 12.6%. Selection on recorded traits lifts the cohort rate to 14.5%; a map fitted naively to that cohort forecasts 14.4% for the rest of the list, against a generated 12.0%. Reweighting brings the forecast to 12.8%. Where the selection rule is recorded, the bias is modest and largely correctable.
Selection on unrecorded judgement is a different matter. The cohort meets at 22.5%, nearly twice the population rate, because the team chose well. The naive forecast for the remaining names is 18.0%; their generated rate is 9.7%. The forecast is 1.86 times too high, and reweighting on recorded traits reduces that only to 1.76. Discrimination is affected less and in the opposite direction: the AUC within the cohort is 0.720, against 0.752 in the population, because a cohort chosen for fit contains fewer poor fits to tell apart.
| Outreach design | Cohort size | Cohort meeting rate | Reweighted rate | AUC in cohort | Naive forecast, rest of list | Reweighted forecast, rest of list | Generated rate, rest of list |
|---|---|---|---|---|---|---|---|
| Randomised outreach | 3,024 | 12.2% | 12.1% | 0.750 | 12.2% | 12.2% | 12.6% |
| Selected on recorded traits | 2,503 | 14.5% | 13.0% | 0.753 | 14.4% | 12.8% | 12.0% |
| Selected on unrecorded judgement | 2,628 | 22.5% | 18.0% | 0.720 | 18.0% | 17.1% | 9.7% |
MatchPoint analysis of the constructed population. Model output under stated inputs; not an observed cohort result. Rounded display. Generated rates for investors not approached are knowable only in a constructed population.
In this constructed selection design, judgement raises the cohort meeting rate and depresses the generated rate among unapproached investors. Reweighting on the specified recorded traits leaves residual bias because selection also uses unrecorded appetite and true fit. The direction and size of bias in a real campaign depend on its selection mechanism. Randomisation with known, positive selection probabilities across the target frame supports design-based estimation; observational adjustment requires explicit identification assumptions and adequate recorded predictors.
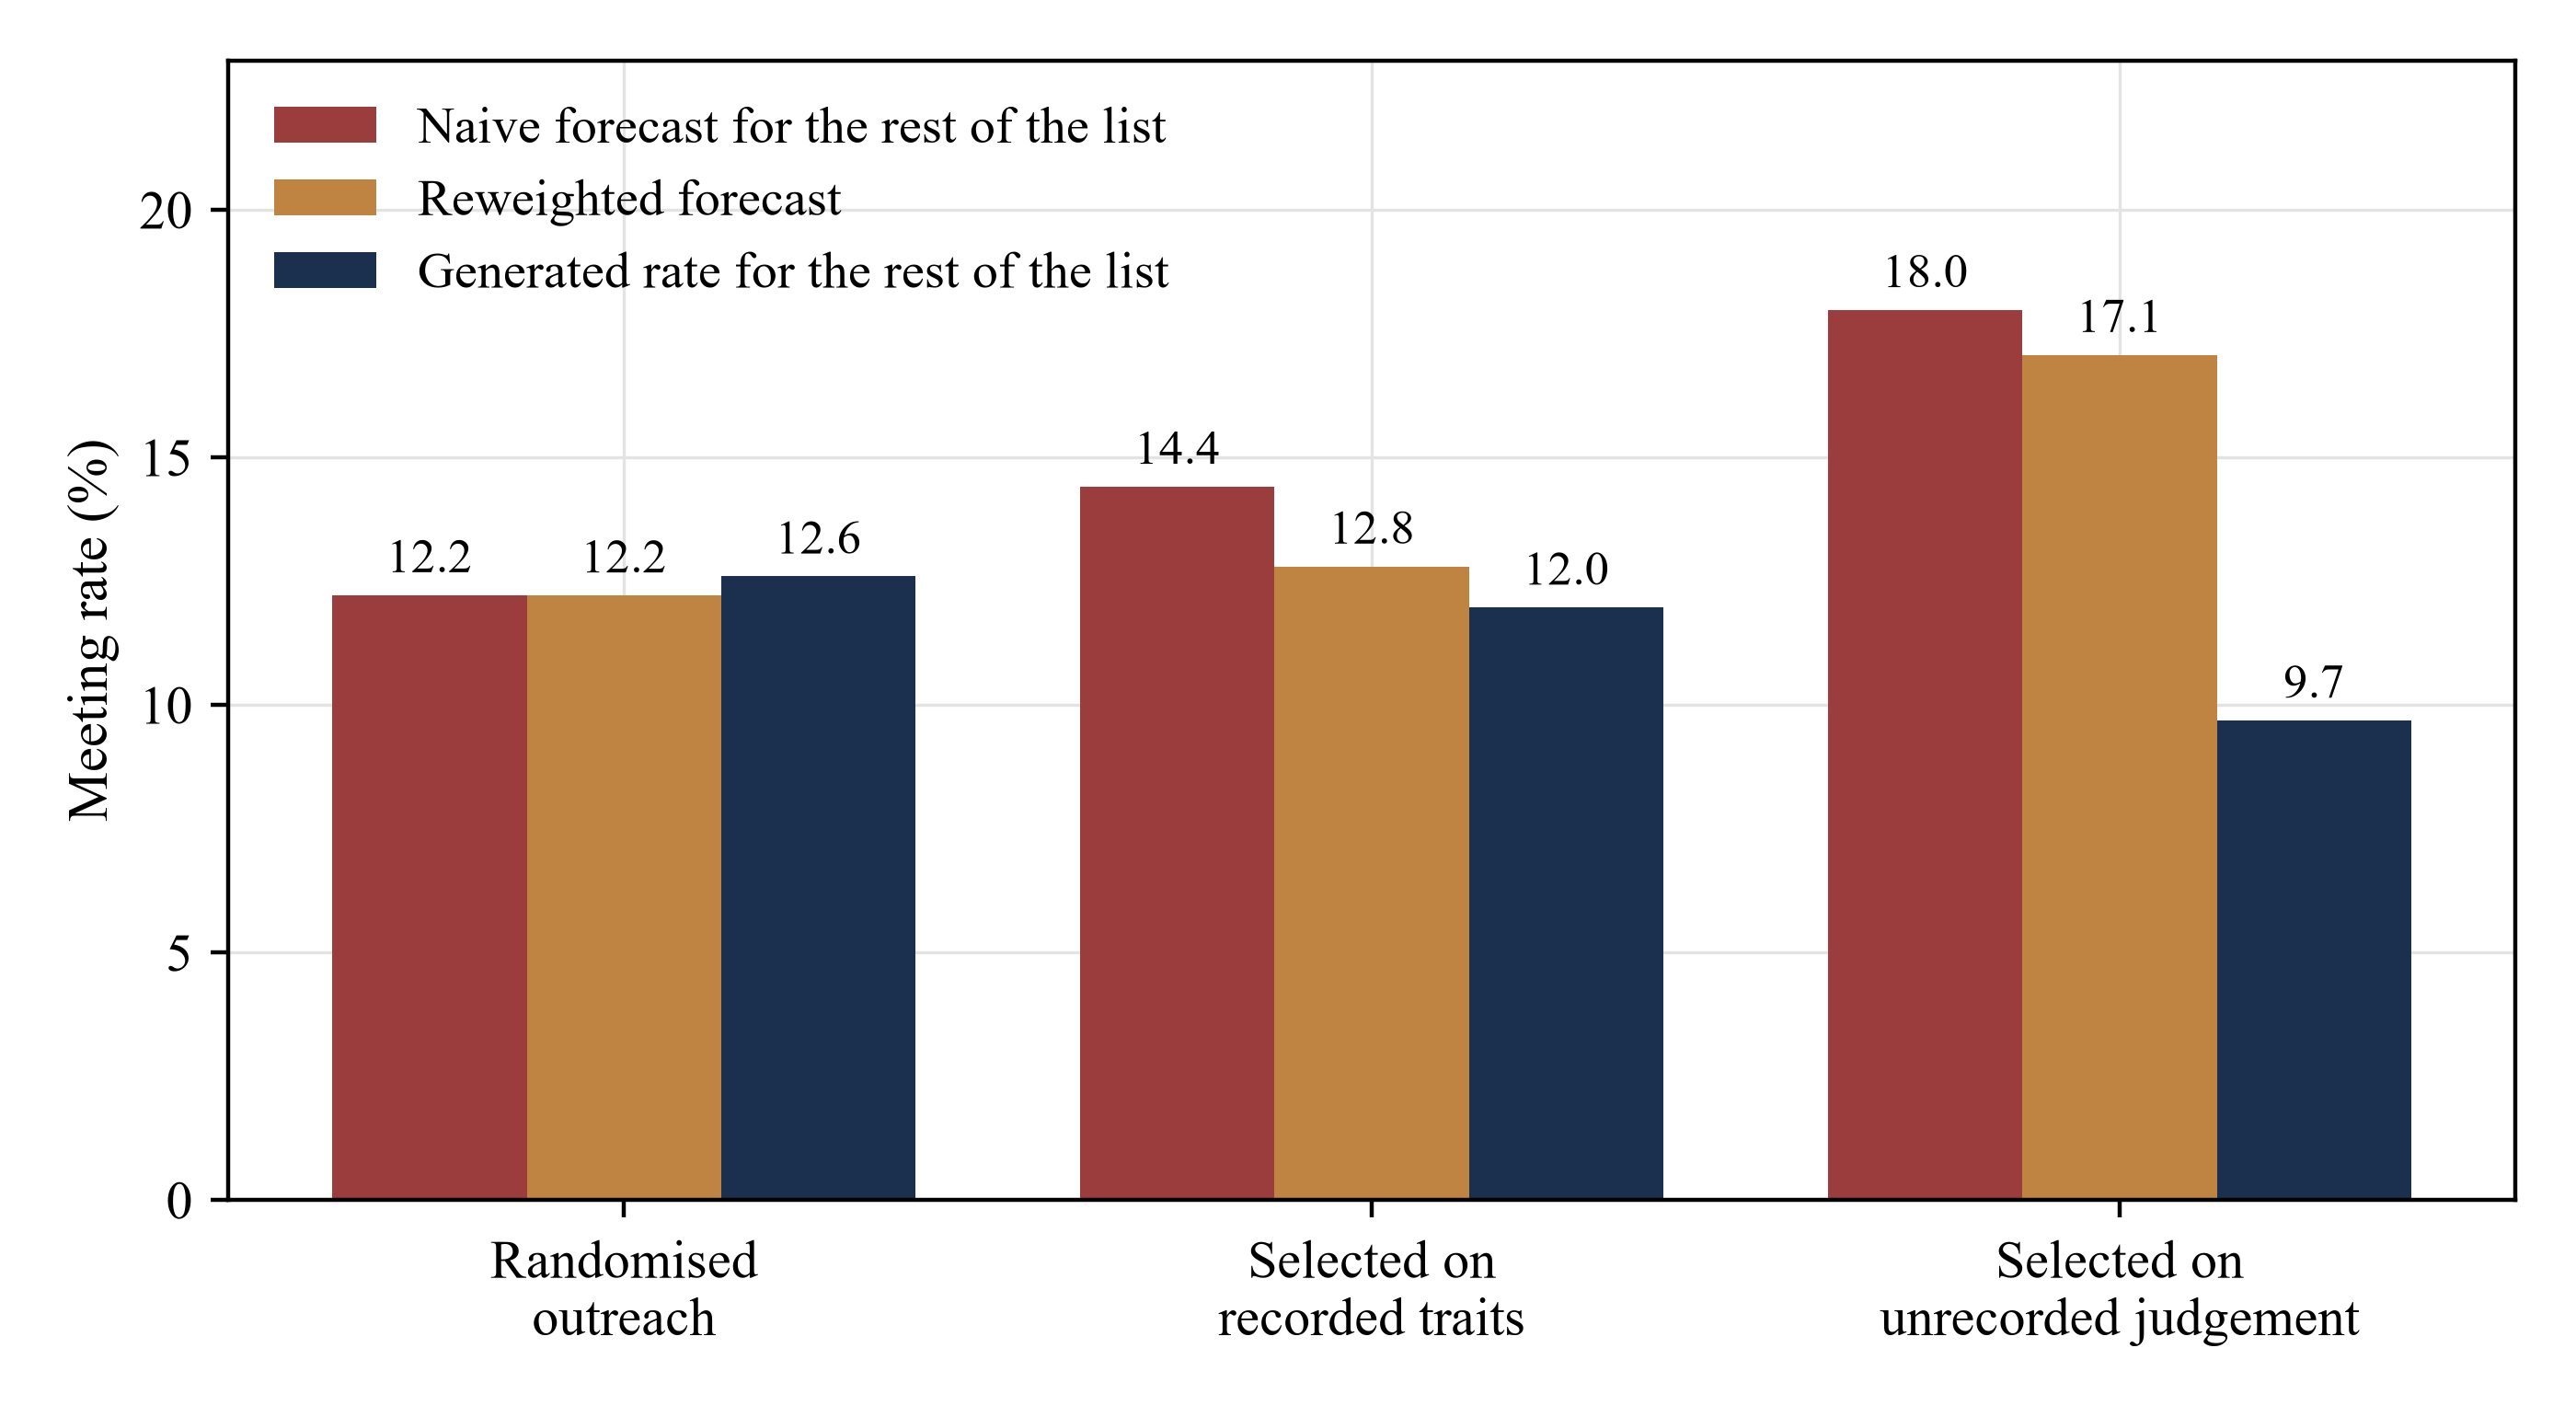
Scroll horizontally to read the figure at full size. You can also open the full-size figure.
MatchPoint analysis of the constructed population. Naive and reweighted forecasts are fitted on each approached cohort and applied to the remaining investors.
16 Wrong weights, stale records and a colder market fail differently
Table 9 applies the base map, without refitting, to a set of stress cases. Each case leaves a distinct signature, and the signature indicates the remedy. A scorecard with wrong weights, here 45 points on geography, 40 on ticket, 15 on strategy and none on decision cycle, falls to an AUC of 0.657 and a top-decile lift of 1.90. Its calibration slope collapses to 0.46 and its intercept to -0.26. Both ranking and probabilities are damaged. The remedy is to revisit the weights, which requires outcome data.
Stale records fail more quietly. With half of decision-cycle records, 30% of ticket records, 15% of strategy records and 10% of geography records out of date, the AUC falls to 0.705 and the top-decile lift to 2.64. The intercept stays at 0.00, so the average forecast is still right, while the slope falls to 0.72: high scores are over-promised and low scores under-promised. Figure 2 shows the flattening. The weights are not at fault and should not be changed. The remedy is to refresh the records. With wrong weights and stale records together the AUC is 0.636.
A colder market fails in a third way. We lower the log-odds of a meeting by 0.7 for every investor and draw fresh outcomes. The score ordering remains fixed and its AUC against the colder-market outcomes is 0.766. Both the changed outcome probabilities and the fresh outcome draw can affect the difference from the base AUC. The slope is 0.99. The intercept is -0.60: the map forecasts 12.4% and the market delivers 7.6%, an overstatement by a factor of 1.63. The fixed score retains discrimination in this constructed stress case, while the base probability map overstates its meeting rate. The remedy is to re-estimate the intercept on recent outcomes, which Van Calster and co-authors describe as the first step in updating a model. [13]
| Ranking rule | AUC | Top-decile lift | Top-quintile capture | Brier score | Calibration intercept | Calibration slope |
|---|---|---|---|---|---|---|
| Random order | 0.505 | 1.07 | 20.2% | 0.1095 | n/a | n/a |
| Prominence only | 0.524 | 1.11 | 21.8% | 0.1094 | n/a | n/a |
| Relationship first | 0.550 | 1.61 | 30.6% | 0.1084 | n/a | n/a |
| Wrong weights and stale records | 0.636 | 1.89 | 35.4% | 0.1147 | -0.25 | 0.40 |
| Wrong weights | 0.657 | 1.90 | 38.7% | 0.1124 | -0.26 | 0.46 |
| Stale records | 0.705 | 2.64 | 42.5% | 0.1033 | 0.00 | 0.72 |
| Equal weights | 0.732 | 2.80 | 43.7% | 0.1001 | -0.01 | 0.88 |
| Base scorecard | 0.744 | 2.89 | 44.6% | 0.0994 | 0.01 | 0.89 |
| Base scorecard, colder market | 0.766 | 3.39 | 51.9% | 0.0680 | -0.60 | 0.99 |
| Base weights, perfect records | 0.782 | 3.37 | 50.1% | 0.0950 | 0.01 | 1.09 |
| Fitted weights plus relationship | 0.758 | 3.05 | 47.9% | 0.0976 | 0.01 | 0.92 |
| Generating probability (not attainable) | 0.833 | 3.90 | 60.6% | 0.0890 | -0.02 | 0.97 |
MatchPoint analysis of the constructed population. Model output under stated inputs; not an observed cohort result. Rounded display. Scorecard rows use the base probability map without refitting. Other rows, including the generating-probability ranking benchmark, use a logistic map fitted to their ranking input for the reported probability metrics. Thus that benchmark's Brier and calibration entries are not computed directly from the generating probabilities. n/a marks calibration measures intentionally omitted for the ranking-only comparators.
Figure 6 varies staleness continuously. When all four records age together, the AUC falls from 0.782 with perfect records to 0.699 at 30% out of date, 0.649 at 50% and 0.605 at 70%, and the top-decile lift falls from 3.37 to 1.88 at the halfway point. When only the decision-cycle record ages, the decline is gentler: 0.737 at 50% and 0.719 at 70%, because structural fit continues to do its work. At a 50% redraw probability, the resulting records still beat prominence and relationship rankings in this population. The planning forecast degrades faster than the ranking: with a 50% redraw probability for each of the four inputs the calibration slope is 0.52.
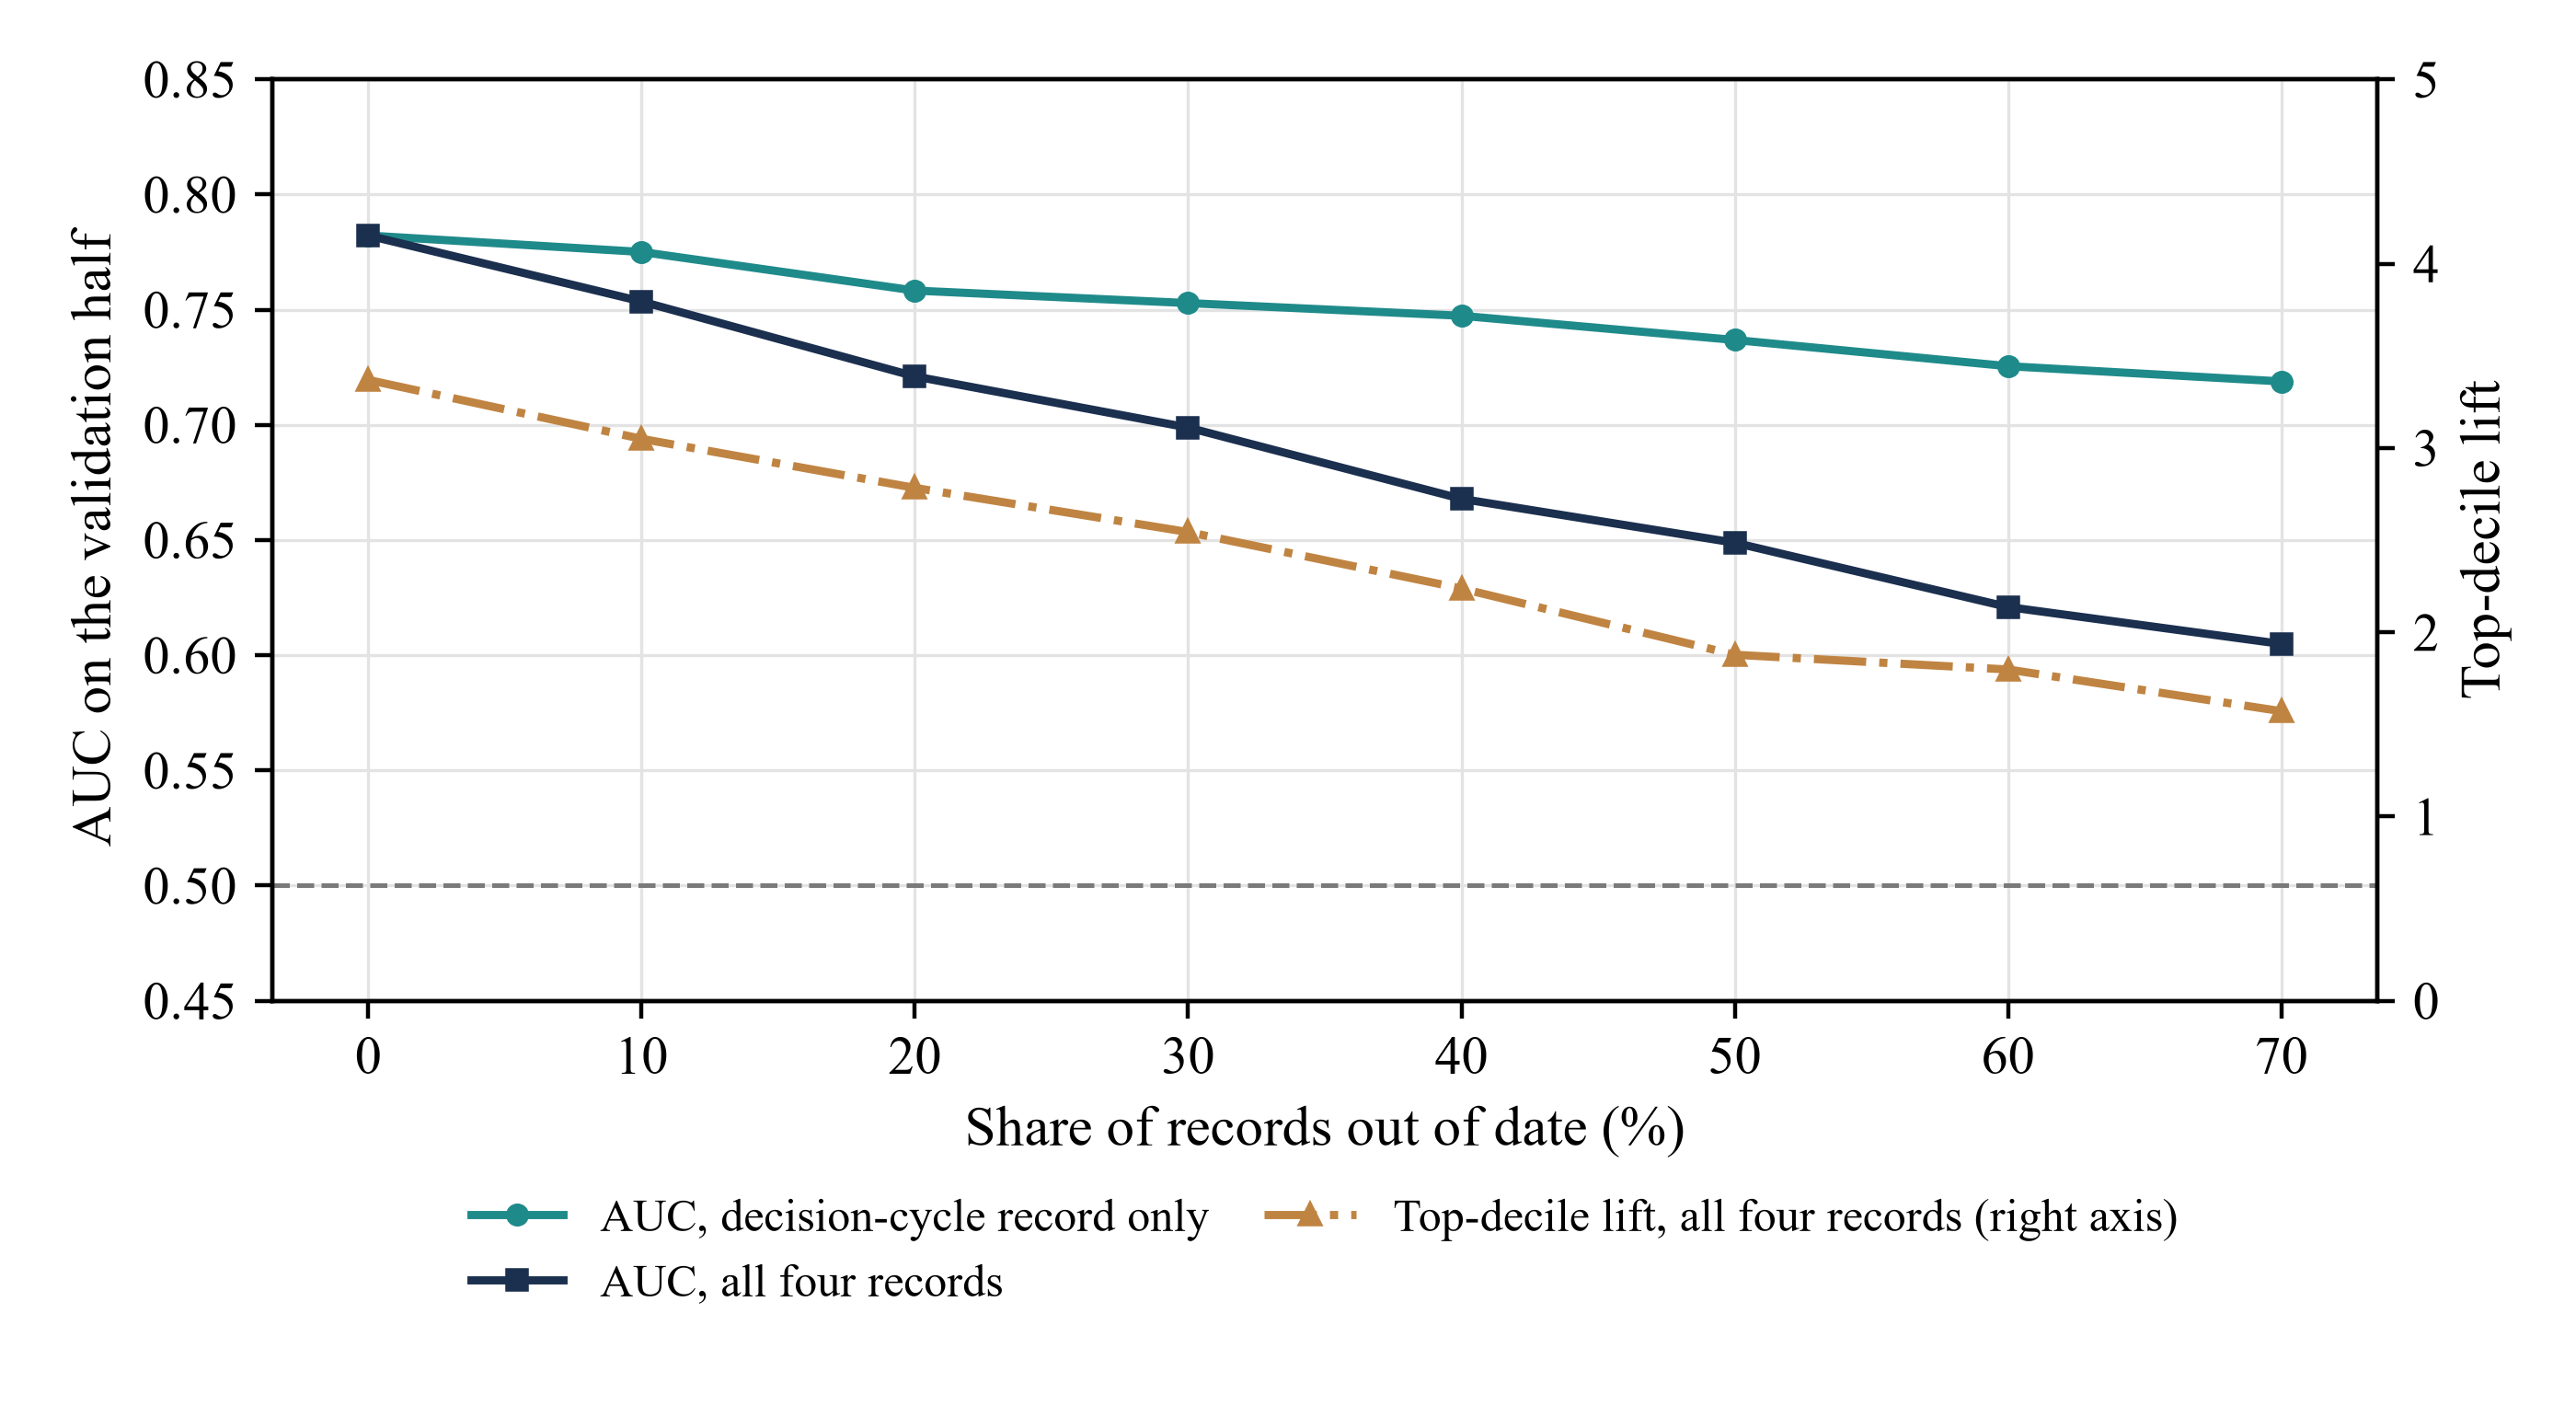
Scroll horizontally to read the figure at full size. You can also open the full-size figure.
MatchPoint analysis of the constructed population, validation half. Out-of-date records are redrawn from the population shares.
17 Sample size limits what one campaign can prove
A single raise approaches tens or hundreds of investors, not thousands. To see what such a campaign can establish, we draw 2,000 random cohorts of each size from the population and compute the AUC in each. Table 10 reports the spread. With 100 investors approached at random, and about 12.5 meetings, the central 90% of estimates runs from 0.624 to 0.868. A team could observe an AUC of 0.65 or of 0.85 from the same scorecard. With 250 approaches the range is 0.675 to 0.824; with 1,000 it narrows to 0.717 to 0.787.
Equation (6a) records how staleness was generated: the recorded level equals the true level x unless the redraw indicator d equals one, which happens with the stated probability for input k; a level x-star is then redrawn from the population shares and can equal the original value. Equation (6b) adapts published clinical prediction-model guidance as a planning heuristic: approximately 200 cases with the outcome and 200 without have been suggested for a calibration curve. [13] At the constructed rate of 12.5%, the expected-event calculation gives about 1,610 approaches. The achieved event counts, clustering, model complexity and desired precision require a study-specific assessment; this calculation is not a universal validation threshold. Intercept and slope estimates also need uncertainty intervals.
| Investors approached at random | Expected meetings | Mean AUC | Central 90% of AUC estimates | Width | Base beats wrong weights | Base beats equal weights |
|---|---|---|---|---|---|---|
| 100 | 12.5 | 0.752 | 0.624 to 0.868 | 0.244 | 91% | 75% |
| 250 | 31.2 | 0.752 | 0.675 to 0.824 | 0.148 | 98% | 88% |
| 500 | 62.4 | 0.752 | 0.700 to 0.802 | 0.102 | 100% | 94% |
| 1,000 | 124.3 | 0.753 | 0.717 to 0.787 | 0.070 | 100% | 99% |
| 2,500 | 312.4 | 0.752 | 0.731 to 0.774 | 0.043 | 100% | 100% |
MatchPoint analysis of the constructed population. Model output under stated inputs; not an observed cohort result. Rounded display. 2,000 cohorts drawn without replacement at each size.
Comparisons are more forgiving than levels. The base scorecard outranks the wrong-weight scorecard in 91% of cohorts of 100 and 98% of cohorts of 250, because both are scored on the same investors and the same outcomes. It outranks the equal-weight scorecard, which is nearly as good, in 88% of cohorts of 250 and 99% of cohorts of 1,000. One campaign can show that a scorecard is better than a poor alternative. It cannot fix the level of discrimination, it cannot settle fine questions of weighting, and it cannot draw a calibration curve. Those require cohorts pooled across raises.
18 Reproduction, controls and what the experiment cannot show
The experiment is reproducible from one file. The model asserts 30 identities and boundary tests and stops if any fails. A second generation from the same seed reproduces every outcome exactly. The AUC of the base scorecard is computed three ways, by rank sum, by trapezoid integration of the ROC curve and by a vectorised routine, and the three agree to ten decimal places; a reversed score returns one minus the figure. Table 11 lists the controls, including the reconciliation of every decile, band and wave table to the validation totals.
| Control | Expected result |
|---|---|
| Fixed seed | Seed 1376; a second generation reproduces every outcome exactly |
| Population and halves | 12,000 investors; 6,000 development and 6,000 validation, no overlap |
| Generated probabilities | Strictly between zero and one at every funnel stage |
| Funnel nesting | Commitments within diligence within meetings, by investor and by ranking rule |
| Scorecard points | Each scorecard sums to 100; scores lie between 0 and 100 |
| AUC, base scorecard | 0.743810 by rank sum, by ROC trapezoid and by the vectorised routine |
| Reversed score | AUC equals one minus the base AUC |
| Calibration map | Mean fitted probability equals the development meeting rate |
| Decile table | Sizes and meetings reconcile; weighted mean lift is 1.00; gains end at 100% |
| Bands and waves | Rows reconcile to the validation totals |
| Benchmarks | Random and prominence rankings within 0.03 of 0.50; generating probability ranks highest |
| Reweighting | Inverse-probability weights sum to within 5% of the population |
| Staleness and precision | AUC falls as records age; estimates tighten as cohorts grow |
| Checks asserted in model.py | 30 identities and boundary tests passed |
MatchPoint analysis. Controls are asserted in model.py; a failure halts the build.
The controls establish that the arithmetic is right. They do not establish that the assumptions are. The inputs are drawn independently, whereas real mandates are correlated: an investor with a regional focus often has a sector focus and a ticket range to match. The generating model is additive on the log-odds scale, whereas a real exclusion may be absolute. Staleness is random, whereas real records go out of date in clusters when a vintage of funds finishes investing. Each simplification is a boundary, restated in Table 14.
One limitation deserves separate statement. The outcomes were generated by a model in which the scorecard's inputs matter. The experiment therefore cannot show that mandate fit predicts investor behaviour; it assumes so and measures the consequences. Its findings concern the properties of the test: how much ranking power a document-based score can have when it is right, how each failure shows itself, how selection distorts a history and how large a cohort must be. Whether the premise holds in a real market is the question that only observed data can answer.
19 The evidence design that a consented cohort study requires
A real test needs five properties, set out in Table 12. The first is consent and lawful basis: each investor's contact details and outcome are used for analysis on a basis that the investor and the applicable data-protection regime permit, and outcomes are pooled without identifying any investor. The second is a timestamp on every event, including the scorecard itself. Scores must be frozen before the approach. A score revised after a meeting has been informed by the outcome it is supposed to predict.
The third property is a recorded selection rule. For each approach the file states why that investor was chosen: by score, by relationship, by introducer or by chance. The fourth is a randomised slice. We propose allocating a tenth to a fifth of first-wave capacity by lottery. Selection probabilities must be known and positive throughout the investor frame to which the estimates will apply. If the lottery is restricted to investors above a minimum score, its conclusions apply to that subgroup; it does not directly estimate responses for excluded names. Bernstein, Korteweg and Laws randomised information disclosure rather than the choice of which investor to approach, so their study is a methodological precedent for randomisation, not a validation of this proposed sampling scheme. [6]
The fifth property is scale through pooling. Section 17 shows that one raise cannot support a calibration curve. Raises must be pooled, with the raise identified as a factor, since response rates differ by asset class, size and market. The out-of-sample and out-of-time testing that supervisory guidance describes for bank models applies directly: weights fixed on earlier raises are tested on later ones. [16]
| Design element | Requirement | Bias or error it controls |
|---|---|---|
| Consent and data basis | Documented basis for using contact and outcome data; pooled, de-identified analysis | Unlawful or unrepeatable data use |
| Frozen scores | Inputs, weights and score timestamped before the approach; later revisions kept as new versions | Hindsight in the predictor |
| Outcome definitions | Qualified meeting, diligence and commitment defined in advance and dated | Outcome inflation by loose counting |
| Recorded selection rule | Reason for each approach logged: score, relationship, introducer or lottery | Selection that cannot be modelled |
| Randomised slice | A fixed share of capacity allocated by lottery among eligible investors | Selection on unrecorded judgement |
| Denominator | Every eligible investor retained, approached or not, with reasons for exclusion | Survivorship in the cohort |
| Record dates | Date and source of each input, especially decision-cycle state | Staleness mistaken for wrong weights |
| Pooling and time split | Raises pooled with a raise factor; weights tested on later raises | Small-sample noise and drift |
| Reporting set | AUC with interval, lift table, calibration intercept and slope, funnel by band | Selective reporting of one flattering measure |
Proposed research design. No such cohort is held or reported in this paper. [6, 13, 14, 15, 16]
20 Report the score to the client and the investment committee
A scorecard is reported to two audiences with different questions. The client asks how many meetings to expect and when. The investor's committee, if it ever sees the process, asks why it was approached. The first question needs calibrated numbers with their uncertainty; the second needs the documented basis of fit. We propose a single reporting pack that serves both, set out in Table 13, in which every figure is labelled as recorded fact, team judgement or model forecast.
The forecast should be stated as a range and tied to its evidence. In the constructed case a first wave of 100 approaches is expected to yield 36.8 meetings, but that expectation rests on a map fitted to a population in which everyone was approached. A team whose map was fitted to its own history should report the caveat of Section 15 alongside the number: the history was selected, and the forecast for unapproached names is likely to be high. Where the map has not been checked against recent outcomes, the pack should say so, and the forecast should be presented as an assumption.
Reporting also carries a regulatory dimension where the pack or its contents reach investors. Under the United States marketing rule, a material claim in an advertisement must be capable of substantiation, and benefits must be presented with fair and balanced treatment of risks. [7] A statement that an opportunity has been matched to an investor's mandate is a claim about that investor's documents and should be supportable from the file. Whether a given communication falls within it is a legal question for the firm concerned.
| Report item | Content | Question resolved |
|---|---|---|
| Long-list reconciliation | Names considered, removed at the perimeter gate, scored and held, with reasons | Whether the denominator is complete |
| Score distribution | Number of investors by score band and by wave | How much capacity each wave requires |
| Forecast and basis | Expected meetings by wave as a range, with the date and source of the map | What the client may plan on |
| Actual against forecast | Meetings, diligence and commitments by wave against expectation | Whether the map needs recalibration |
| Record freshness | Share of inputs reviewed within a stated period, by input | Whether weak results reflect stale data |
| Selection log | Share of approaches made by score, relationship, introducer and lottery | Whether outcomes can serve as evidence |
| Overrides | Approaches made against the score, with the reason and the outcome | Whether judgement adds to the score |
| Elapsed time | Days between approach, meeting, diligence and commitment | Whether the cycle assumption holds |
Proposed reporting pack. The entries are review deliverables; the paper does not assert that any programme has produced them.
21 Use data and AI to maintain the inputs, with model governance
The experiment locates the value of better data precisely. Applying the same weights to perfect records raises the AUC from 0.744 to 0.782, a gain of 0.038. Refitting the weights and adding the relationship raises it to 0.758, a gain of 0.015. In this population, keeping records current is worth more than optimising weights. That ordering depends on the assumed staleness rates and would differ with other inputs. It nonetheless indicates where effort should be tested first: on the dates and sources of the decision-cycle and ticket records.
This is the task for which language models and data tools are plausibly suited: reading policy statements, annual reports, committee papers and announcements, extracting stated ranges and limits, and flagging records whose source has been superseded. The evaluation should be specified before the tool is adopted. Useful tests include agreement with a human reader on a held-out set of documents, the rate of extracted limits that cannot be traced to a passage, and the change in out-of-date records over a quarter. These are proposed criteria. This paper reports no trained model, no extraction accuracy and no realised improvement.
A fitted model that replaces the scorecard needs stronger controls than the scorecard does. The model risk guidance for banks describes effective challenge as critical analysis by objective parties with the expertise and standing to effect change, and it places generative and agentic AI outside its scope as novel and rapidly evolving. [16] We take two points from it by analogy. Someone other than the scorecard's author should review its outcomes. And a tool that reads documents is a data source to be checked, while the decision to approach an investor remains with a named person who is accountable for the perimeter.
22 Apply the framework in a live raise or a fund placement
For a company or sponsor raising capital, the framework yields a sequence of steps. Build the long list and apply the perimeter gate with counsel. Score every remaining investor from dated documents, and freeze the scores. Set first-wave capacity honestly, in principal hours. Choose the wave cut-offs from the score distribution, assign relationship-holders to the names the score selects, and reserve a randomised slice. After the first wave, compare meetings with forecast by band before releasing the second. The scorecard governs order; it does not replace the judgement of whether an investor is the right owner or lender.
For a manager raising a fund from limited partners, the inputs change and the logic holds. Strategy fit is read against the allocator's programme ranges, ticket fit against its share-of-fund limit and the target fund size, and decision-cycle state against its commitment pacing and committee calendar. [1, 3] The funnel is longer and re-ups behave differently from new relationships, so existing investors should be scored and reported as a separate cohort. Local preference is a documented pattern among some allocators. [5] Geography should therefore be scored from the investor's side.
In the Gulf the perimeter and the cycle both need particular care. A fund domiciled elsewhere and offered in the Dubai International Financial Centre or in Saudi Arabia reaches investors through the routes described in Section 4, and the route determines who can be on the list at all. [10, 11] The Santiago Principles expect sovereign funds to disclose a description of their investment policy, [2] which supports structural scoring from documents, while their decision-cycle state is seldom public. For such investors the timing input will often score at the uncertain middle level, and the score should be read as a statement about fit.
Across all three settings the decision rule is the same. Sequence by score when capacity is scarce and records are fresh. Refresh records before changing weights. Recalibrate the forecast when the first wave differs from expectation across all bands. Assess selection in the team's history before forecasting for unapproached names. Invest in a randomised slice early to obtain a design-based comparison within the investor frame covered by the lottery.
23 Limitations and the next decision
The experiment is constructed and its limits are those of its construction. It contains one opportunity and no competition between opportunities for the same investor's attention. It models the investor's response and not the quality of the business or fund, which in practice dominates the later stages. It assumes that an approach has no cost to the relationship if it fails, and that a held investor can be approached later on the same terms. It treats each investor as independent, although investors talk to one another and an anchor commitment changes the response of the rest.
The statistical results are specific to the inputs. An AUC of 0.744 is what this scorecard achieves in this population; a different mix of mandates, a different appetite variance or a different staleness rate would give another figure. The base rate of 12.5% and the funnel conversions are authored. The selection result depends on how much of the team's judgement is unrecorded, which we set by assumption. No figure in this paper should be quoted as a market conversion rate, an expected outcome for a raise or a measure of what an adviser adds. Table 14 states what must replace each boundary before the framework is used in a transaction.
| Present boundary | Evidence required for an extension | Decision affected |
|---|---|---|
| Constructed outcomes | Consented, timestamped cohort with the design in Table 12 | Whether the scorecard predicts at all |
| Authored weights | Pooled outcomes sufficient to estimate and test weights out of time | Points attached to each input |
| Assumed staleness rates | Audit of record dates against later-confirmed status | Refresh frequency and data budget |
| Independent inputs | Observed joint distribution of mandate attributes | Size of each wave and of the hold group |
| Single map from score to probability | Recent outcomes by asset class, size and market | Client forecast of meetings and timing |
| Relationship outside the score | Outcomes by channel and introducer | Who makes each approach |
| One opportunity, no competition | Investor-level record of concurrent approaches | Timing of launch |
| Perimeter treated as a gate | Legal advice on vehicle, route and investor category | Who may be on the list |
Proposed extension of the authored experiment. Each extension requires observed evidence; none is treated as an observed result in this paper.
The next decision is therefore about evidence as much as about outreach. A team that already ranks investors can adopt the definitions in Section 2, freeze its scores and begin recording why each approach was made. A randomised slice uses first-wave capacity; its opportunity cost depends on the sampling frame and the alternative ranking. The experiment suggests what it is worth: an observed evaluation must address the selection mechanism before supporting forecasts for unapproached names or comparisons between score and judgement. This experiment demonstrates predictive behavior under its stated assumptions. Within the sources reviewed here, we have not verified an observed-cohort validation of this scorecard.
References
- Institutional Limited Partners Association. Due Diligence Questionnaire 2.0. Updated November 2021. Overview and section 4, Investment Strategy. Industry standard questionnaire; not a required document. https://ilpa.org/wp-content/uploads/2021/11/ILPA-DDQ-2.0.pdf
- International Working Group of Sovereign Wealth Funds. Sovereign Wealth Funds: Generally Accepted Principles and Practices (Santiago Principles). October 2008. GAPP 18 and sub-principles 18.1 to 18.3. Voluntary principles. https://www.ifswf.org/sites/default/files/santiagoprinciples_0_0.pdf
- California Public Employees' Retirement System. Investment Policy for Private Equity Program, Investment Committee agenda item 10a, attachment 2, November 2019. Appendix 3, strategy targets, ranges and investment limitations. Dated committee paper showing proposed revisions; not evidence of current limits. https://www.calpers.ca.gov/docs/board-agendas/201911/invest/item10a-02_a.pdf
- Gompers, P., Gornall, W., Kaplan, S. N. and Strebulaev, I. A. How Do Venture Capitalists Make Decisions? NBER Working Paper 22587, September 2016. Survey of 885 venture capitalists at 681 firms; deal sourcing, funnel and selection sections. https://www.nber.org/papers/w22587
- Hochberg, Y. V. and Rauh, J. D. Local Overweighting and Underperformance: Evidence from Limited Partner Private Equity Investments. NBER Working Paper 17122, June 2011. United States limited partners. https://www.nber.org/papers/w17122
- Bernstein, S., Korteweg, A. and Laws, K. Attracting Early Stage Investors: Evidence from a Randomized Field Experiment. Stanford Graduate School of Business Research Paper 3006, 2014. Randomised emails on one online platform. https://ideas.repec.org/p/ecl/stabus/3006.html
- U.S. Securities and Exchange Commission. Investment adviser marketing, 17 CFR 275.206(4)-1. Text as published by the Legal Information Institute, accessed 13 October 2026. https://www.law.cornell.edu/cfr/text/17/275.206(4)-1
- U.S. Securities and Exchange Commission. General Solicitation: Rule 506(c). Exempt offerings resource page, last reviewed or updated 17 March 2026. https://www.sec.gov/resources-small-businesses/exempt-offerings/general-solicitation-rule-506c
- Financial Conduct Authority. FCA Handbook, COBS 4.12B, Promotion of non-mass market investments. Text as accessed 13 October 2026. https://www.handbook.fca.org.uk/handbook/COBS/4/12B.html The original made-rules instrument is reproduced in FCA Policy Statement PS22/10, Appendix 1, FCA 2022/33, August 2022, with the relevant rules effective from February 2023. This is a dated regulatory example; current application requires checking the consolidated Handbook. https://www.fca.org.uk/publication/policy/ps22-10.pdf
- Dubai Financial Services Authority. The DFSA Rulebook, Collective Investment Rules (CIR), version CIR/VER40/01-26. Chapter 15, Marketing of Foreign Funds, guidance and rule 15.1.1A. https://dfsaen.thomsonreuters.com/sites/default/files/net_file_store/DFSA1547_11821_VER400126.pdf
- Capital Market Authority, Kingdom of Saudi Arabia. Investment Funds Regulations, as amended by Board Resolution 1-54-2025 dated 21 May 2025. Part 6, Foreign Funds, Articles 99 to 103. Unofficial English translation; the Arabic text is official. https://cma.gov.sa/en/RulesRegulations/Regulations/Documents/Investment_Funds_Regulations_2025_EN.pdf
- Fawcett, T. An introduction to ROC analysis. Pattern Recognition Letters 27 (2006), 861 to 874. Section on the area under the ROC curve. Copy accessed at https://www2.cs.uh.edu/~acl/cs6397/Doc/2006-PRL-An%20Intro%20to%20ROC%20analysis.pdf
- Van Calster, B., McLernon, D. J., van Smeden, M., Wynants, L. and Steyerberg, E. W. Calibration: the Achilles heel of predictive analytics. BMC Medicine 17, 230 (2019). Open-access text via Europe PMC. https://www.ebi.ac.uk/europepmc/webservices/rest/PMC6912996/fullTextXML
- Heckman, J. J. Sample Selection Bias as a Specification Error (with an Application to the Estimation of Labor Supply Functions). NBER Working Paper 172, March 1977. https://www.nber.org/papers/w0172
- Seaman, S. R. and White, I. R. Review of inverse probability weighting for dealing with missing data. Statistical Methods in Medical Research 22(3), 2013, 278 to 295. Abstract record via Europe PMC. https://www.ebi.ac.uk/europepmc/webservices/rest/search?query=%22Review%20of%20inverse%20probability%20weighting%20for%20dealing%20with%20missing%20data%22&resultType=core&format=json
- Board of Governors of the Federal Reserve System, Federal Deposit Insurance Corporation and Office of the Comptroller of the Currency. Supervisory Guidance on Model Risk Management, attachment to SR Letter 26-2, 17 April 2026. Guidance for banking organisations; not enforceable standards. https://www.federalreserve.gov/supervisionreg/srletters/SR2602a1.pdf
About the Author
Chennakeshav (CK) is a corporate finance and investment banking executive with 25+ years of global experience in deal origination, structuring and execution across M&A, growth capital and corporate strategy. He has led value-creation mandates for founders, corporates and funds — bridging the boardroom view to hands-on execution and close.
His career spans Morgan Stanley, HSBC, Lloyds Banking Group, EWEC, ADQ portfolio companies and Emirates Growth Fund, across TMT, real estate, fintech, deeptech, cleantech, infrastructure and energy. He has partnered with C-suite leaders, private equity and venture funds, sovereign wealth funds and family offices to finance complex fund raises and scale-up ventures, and has led M&A due diligence, post-merger integration and business-transformation initiatives to create value.
At Matchpoint Partners he is Managing Partner, leading the firm's corporate finance, M&A and capital-raising practice. He holds an MBA from London Business School, an engineering degree from VTU and a Master of Laws (LLM, in progress) from UCL London.
An active start-up mentor, CK mentors at Techstars, DIFC FinTech Hive, Startup Grind, Founder Institute and IN5, serves as Entrepreneur Mentor in Residence (EMiR) at London Business School, and judges the Entrepreneurship World Cup.
https://www.linkedin.com/in/ckadya/
https://www.matchpoint-partners.com/team/ck-adya.html
Disclaimer
This paper is part of a continuing series on the structure of private and alternative markets. The views expressed are the author's own. The paper is for information only, describes market structure in general terms, and does not constitute investment, legal, tax or regulatory advice or a recommendation in respect of any security, vehicle or counterparty.
