

1 The financing decision behind an impact forecast
An innovation funding application asks a decision-maker to commit resources before the commercial outcome is known. A founder may forecast sales, skilled employment, follow-on investment or a technical milestone. A finance committee then needs to understand what those numbers mean, which assumptions carry the result and how delivery could subsequently be checked. This paper develops a record linking each dated forecast to a precisely defined later observation. The commercial use is to make an application's evidence reviewable throughout preparation, financing and follow-up, with separate records for the original forecast and subsequent management revisions.
A useful starting question is whether the predicted quantity can be identified without reading the surrounding pitch sympathetically. Turnover in the fifth year, turnover accumulated over five years and additional turnover attributed to the project require different observations. A projection conditional on securing another investment round has a different information content from a forecast that already allows for financing failure. These distinctions determine which comparison would answer the submitted claim. They also matter to a board deciding how much working capital to commit while a grant application is unresolved.
The public evidence reviewed here has three separate uses. Official programme materials establish selected assessment and reporting requirements at a stated date. A purposive examination of four CORDIS project records tests whether the public material examined supplies an admissible forecast/outcome pair. A fully disclosed, constructed portfolio then demonstrates the measurement arithmetic. The public-record examination established no eligible pair within its scope. Accordingly, this paper reports no empirical rate of forecast accuracy for a funding programme, a country or a population of applicants. The worked portfolio supplies a method that could be applied once suitable records and lawful access exist.
The central recommendation is to establish the matching rules when the forecast is submitted. Record the entity, forecast vintage, commercial measure, horizon, conditions, evidence requirement and scoring method before the outcome is observed. Follow-up should retain failures, missing information and entity changes with their actual status. A later analyst can then see which claims are testable, which comparisons are supported and which conclusions remain unavailable. This proposed system gives founders and evaluators a common structure while preserving the governing requirements of each particular funding instrument.
The analysis is relevant across technology sectors because the matching problem concerns the structure of a claim. A software subscription forecast needs its revenue-recognition and customer definitions. A battery developer needs the test conditions and commercialisation stage that connect technical validation to sales. A water-technology company needs to distinguish a successful pilot from recurring contracted revenue. These examples identify measurement choices; they supply no observed company results or sector success rates. Actual applications require evidence specific to the product, programme and decision under consideration.
2 Separate forecasts commitments and causal impact
A forecast is a statement about a future quantity under a stated information set. A target records an intended result. A scenario describes an outcome conditional on selected assumptions. A commitment adds an obligation or delivery standard under its governing terms. These statements can coexist in one application, so the review should classify each numerical claim before choosing a score. Management's ambition to reach a revenue target does not, by itself, specify whether the number is an expected value, a median, a probability threshold or an upside scenario.
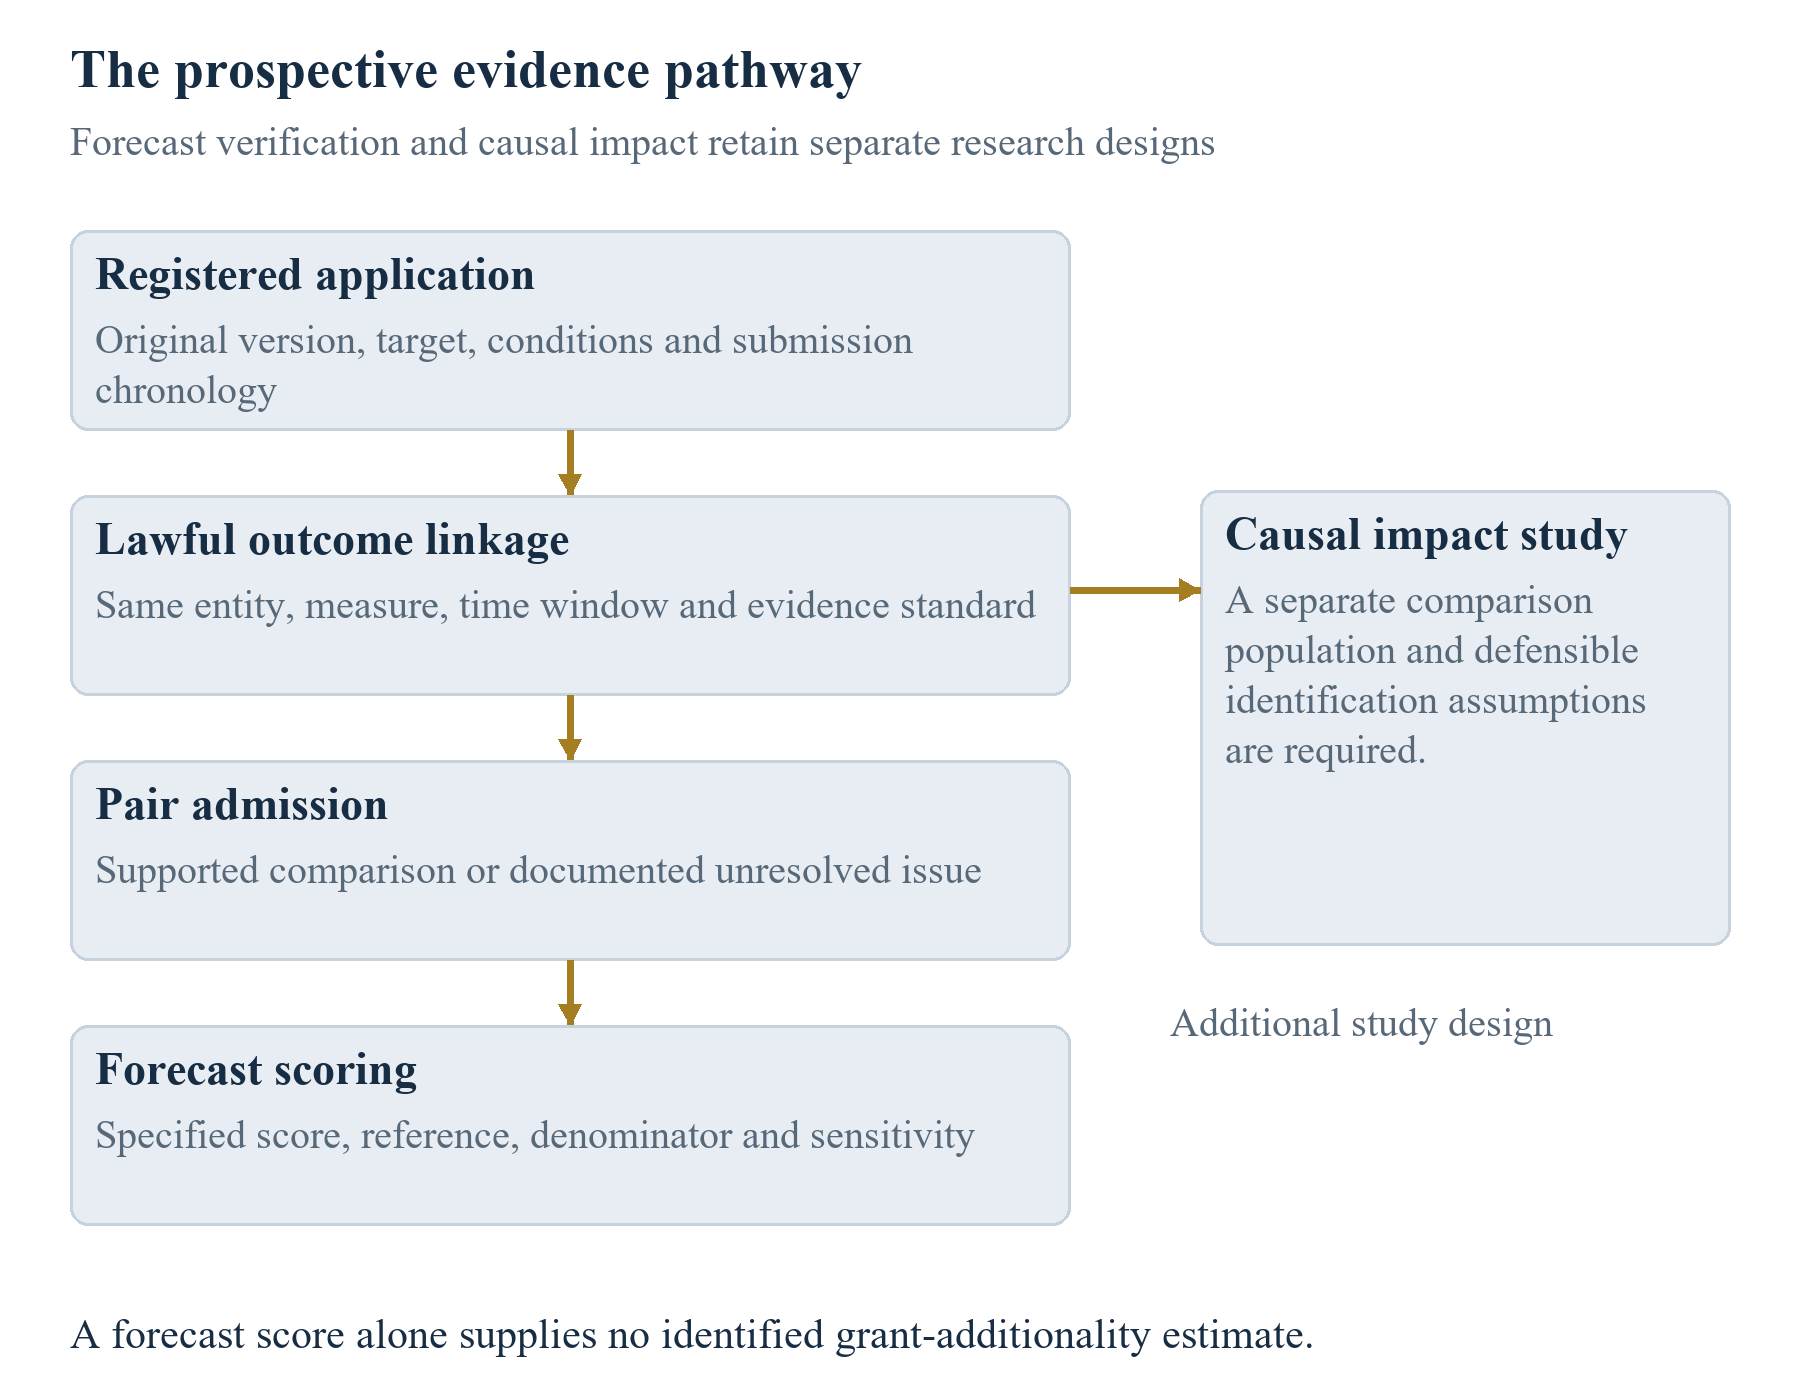
Forecast verification compares a previously recorded prediction with its matching outcome. Grant additionality asks how an outcome changes because support was provided. The second question requires a counterfactual design. Howell's research uses ranked applicants to the US Department of Energy's SBIR programme to study subsidy effects. The 2026 Smart Grants evaluation uses administrative and company data with a comparison design described in its report and technical annex. These are established bodies of causal-impact research. Their findings cannot be reproduced by subtracting an applicant's revenue forecast from later revenue. [6-8,14]
An award recipient may achieve the submitted sales figure while the causal contribution of the award remains unidentified. Another recipient may fall short of that figure while the award has supported a commercially valuable result relative to an otherwise weaker counterfactual. Neither conclusion follows automatically from the forecast error. A programme dashboard should therefore maintain separate fields for gross observed outcomes, forecast accuracy and any separately justified causal estimate. The underlying studies, assumptions and populations should be accessible to the person using those fields in an investment or policy decision.
A technical commitment requires an additional distinction. A pass/fail test can establish delivery against a frozen protocol when the relevant evidence is available. A proportion of commitments delivered supplies an outcome frequency for those commitments. Probabilistic calibration requires submitted probabilities and repeated resolved events under an appropriate evaluation design. Calling every milestone an 80 percent probability after the event would introduce information that was absent from the original statement. The register should preserve the statement actually made and leave the corresponding probability field empty when none was supplied.
The same discipline applies to funding. A probability of receiving outside equity, a forecast amount of equity, a signed term sheet and cash received are separate measures. A public announcement can establish that a statement was made. Verification of the specified financing event needs the evidence defined for that event. Where that evidence remains confidential or unavailable, the result stays unresolved for this study. The funder's administrative decision and the researcher's measurement status may legitimately differ because they answer different questions using different access rights.
3 What the selected programme documents require
The selected documents were checked on 11 November 2026. Their purpose in this paper is to identify where commercial evidence enters the process and which source version a research register needs. They do not form a universal eligibility guide. Applications must follow the actual call, action type, phase, jurisdiction and instructions effective at submission. A comparison table should retain these distinctions so that a requirement found in one scheme is never transferred silently to another.
The EIC 2026 work programme page identifies the 17 June 2026 amendment. Its Accelerator assessment addresses commercial matters including the realism of addressable-market and market-share assumptions and financial projections. The full application uses a bounded proposal and supplementary information. The work programme also addresses confidentiality and information sharing for relevant investment assessment. For the present research question, these provisions indicate that commercially relevant forecasts can exist in an application whose complete underlying contents are unavailable to a public researcher. They do not establish a common forecasting horizon or public access to every submitted model. [1]
Horizon Europe's April 2026 standard evaluator briefing distinguishes project results, outcomes and wider impacts by their relationship to implementation and subsequent use. It also records a 2026/27 simplification removing scale and significance from the standard impact criterion while retaining credible pathways and appropriate dissemination, exploitation and communication assessment. A review based on an older briefing could describe the current evaluation task incorrectly. The register should therefore preserve the exact action and applicable briefing version beside any extracted impact metric. A quantifiable managerial forecast can still be useful without being a universally required scoring field. [2]
Innovate UK's funding-offer guidance describes monitoring support and an exploitation plan that records the business case and exploitation activity. Appropriate outputs and achievements are quantified, and the plan is reviewed during project setup and progress reviews. This creates a route for evolving project management information. A research study must distinguish the submitted application from that later plan and its revisions. The guidance does not grant public access to commercially sensitive plans or establish that the latest plan preserves the original forecast. [3]
NSF's current 26-510 solicitation identifies commercial potential alongside its other merit-review criteria. Its linked preparation instructions distinguish a public-facing project summary from protected proposal material. SBA's commercialisation-reporting page describes an authorised user dashboard and reporting at specified award stages. These sources support a distinction between the existence of administrative information and a researcher's access to matched microdata. Any proposed cross-programme comparison needs a permissions and data-dictionary stage before an outcome is pooled or scored. [9-11]
4 Use dated terms and preserve changes in measurement
A dated register should capture the document's publication, amendment and effective dates separately from the research access date. A new webpage retrieval confirms what was available to the reviewer then. It does not establish the text that governed an application submitted several years earlier. Archived official versions, call-specific instructions and the actual submission receipt provide the appropriate route to that earlier information set. Where these records cannot be obtained, the uncertainty belongs in the pair-admission decision.
The Smart Grants material illustrates why programme state needs a dated source. UKRI published a Smart impact evaluation in July 2026, while its current specific-funds guidance says Smart is closed to new applications. An evaluation's publication supplies research about a programme; it supplies no current open-call date. Historical competition questions may illuminate the original study period if their applicability is established. They should retain their historical label when used in a research design or a founder's funding plan. [6,21]
SBA's September 2026 commercialisation notice provides a second example. It announces updated standards for a defined repeat-award population and describes non-SBIR revenue share using an explicit company-revenue denominator and fiscal-year window. Its stated implementation date is 15 November 2026 with publication on SBIR.gov, and it describes a final-requirement process following comments. At this paper's 11 November review date, that date is still ahead and the inspected general benchmark webpage retains earlier descriptions. The announced metric and its implementation conditions should be recorded separately. This paper makes no determination that the announced threshold already applies to an applicant. [11,12]
A change in metric creates a comparability problem even when both old and new numbers are reported accurately. Sales plus investment per award is a different quantity from the share of company revenue earned outside specified grants. A larger denominator, a changed eligible-award window or a revised treatment of government contracts can change a reported ratio without changing the underlying operating business. An analyst should retain the original definition and create a separately labelled harmonised measure only when all components and a defensible conversion are available.
The proposed deadline tracker therefore contains several dates. The first is the application's actual submission cutoff, with its timezone and governing version. The second is the forecast registration instant. The third is the outcome window's closing instant. The fourth is the date evidence becomes available. A future reporting deadline may also apply under the award agreement. Each date serves a different purpose. Combining them in one publication-date column would conceal whether a prediction was genuinely registered before the outcome and whether follow-up is complete.
5 Test whether public project records support a matched pair
We conducted a bounded public-disclosure feasibility inquiry before calculating any programme forecast error. The inquiry selected four CORDIS records containing numerical turnover forecasts through purposive searches and direct project-number checks. Reporting and results pages were examined for all four; selected fact sheets and linked reporting materials were also checked. This selection favours records with inspectable claims and provides no representative sample of awards. It can identify the information needed to admit those particular pairs and the gaps remaining in the inspected material.
A pair was eligible only if a forecast vintage could be authenticated as preceding its outcome, the entity and measure were identifiable, the target period and units matched, and an admissible later observation existed. Each claim needed its own decision. A forecast repeated inside a later report retained its status as a forecast until its original vintage and realised counterpart were established. Official hosting identified the document's source; commercial statements attributed to a beneficiary retained that attribution and were not upgraded to independent assurance.
The four records were MODBRIDGE, EKOMAP, iLocator and NexGenFSCM. They include feasibility-stage material and a larger subsequent project. The report periods, current update fields, beneficiary-reported commercial figures and claim wording provide several different kinds of chronology. None of the inspected combinations established the complete required application-vintage and matched independently verified outcome chain. The resulting admitted-pair count is zero for this inquiry. No project forecast is scored, and no absent commercial outcome is entered as zero. [17-20]
This finding describes the inquiry's actual access and selection. Private application files, archived submission packages, consented company accounts and registry-linked financial panels were not obtained for these four records. A study with those permissions and records could reach a different pair-admission result. Public search failure also supplies no evidence that the project failed commercially, that its beneficiary withheld required information or that the programme lacks internal monitoring data. Those would be separate claims requiring their own evidence.
The operational implication is a feasibility gate before committing to an empirical scoring study. A prospective researcher should request a small, lawfully accessible set of original forecasts and matching records, test the linkage and record a reason for each exclusion. A data-sharing agreement, a versioned data dictionary and a follow-up plan can then define the full study. Starting from an award list alone leaves the central prediction variable unspecified. Starting from success stories alone adds selection concerns before any score is calculated.
6 Read the four disclosure cases without inventing outcomes
MODBRIDGE's public reporting includes a turnover projection over the first five years of deployment. The inspected reporting period covers feasibility work, while the later deployment origin and the exact cumulative or terminal-year interpretation require additional evidence for scoring. The inspected results did not provide a matched realised five-year turnover observation. A comparison with the grant amount would answer a different question because grant support and turnover occupy different sides of the financing and operating records. [17]
EKOMAP's public material presents turnover forecasts for several years after market introduction. The market-introduction date is needed to translate those relative years into accounting windows. The inspected material did not establish that date together with matching annual actuals and a contemporaneous application version. A results-retrieval error further limits what the public-page check can establish. The case remains excluded for unresolved information rather than being assigned a favourable or unfavourable error. [18]
iLocator describes a five-year turnover objective relative to a smaller baseline. The analytical questions are the baseline date, the legal-entity perimeter, the annual-versus-cumulative interpretation, the forecast registration date and the endpoint accounts. The inspected pages did not supply a complete matching set. Even a later announcement of company growth would need those definitions before it could settle the original forecast. A numerical baseline in prose cannot supply the missing accounting period automatically. [19]
NexGenFSCM provides a particularly useful warning about attractive numerical matches. Its inspected report contains 2017 company-total and SaaS revenue statements, a 2020 sector-specific additional-turnover target and projections for later total revenue. These figures have different years and scopes. Comparing the earlier actual directly with the 2020 target would mix chronology and denominator. Later numbers described as forecasts remain predictions until matching outcome evidence is established. Pilot operational improvements concern further measures with their own customer populations and baselines. None provides an interchangeable company-turnover actual. [20]
The admission register should retain these reasons at claim level. An analyst can subsequently attach an original receipt, obtain the appropriate accounts or clarify a deployment date without rewriting the earlier audit trail. The decision may then change from unresolved to admitted on explicit evidence. Until that happens, a blank score is the correct output. The exclusion log remains analytically useful because it identifies the information a future data partnership should request and the comparisons that should be rejected during quality review.
7 Build an eligibility matrix for forecast and outcome pairs
The first eligibility decision in this research design concerns the evidence pair. It asks whether the available prediction and observation can support the intended comparison. A company's eligibility for an award is a separate programme decision. We propose a claim-level admission matrix with a definite requirement and a reasoned outcome for each check. An analyst should complete it before viewing a score because a striking result can otherwise distract from a mismatched quantity or a forecast whose original date remains unknown.
The chronology check requires a preserved prediction version issued before the period or event being predicted. A retrospective report may contain an earlier forecast, but its current publication alone cannot authenticate the earlier version. The identity check asks whether the applicant entity and the outcome entity coincide on the defined perimeter. The measurement check then compares the variable, unit, denominator, accounting convention, baseline and horizon. Finally, the evidence check determines whether the actual has the quality and access rights specified in the study protocol. Each check should identify the document or field supporting its conclusion.
The matrix should permit an unresolved state. A missing submission receipt is an information gap. An annual turnover actual offered against a cumulative forecast is an identified mismatch. Treating both as a generic failure would lose the distinction between evidence that could be obtained and a comparison that needs a different actual. The reviewer should record the next admissible action, its owner and the date for reconsideration. A score becomes available only after every requirement for that particular comparison has been met.
Multiple claims within the same application may reach different states. A technical test could be resolved while follow-on investment remains unverified. A revenue forecast might have a valid timestamp and an unresolved entity perimeter after an acquisition. The research register should preserve all three observations with their own statuses. Excluding an entire company because one claim is unresolved would change the population for every metric, often without an analytical reason. Any study-wide inclusion rule should be specified separately and its effect on each denominator disclosed.
An admission matrix also supports an efficient data request. Instead of requesting every document in a company's data room, the analyst can identify the specific item needed to close an uncertainty: the original application attachment, an executed financing document with evidence of cash, a reconciliation between entity and group accounts, or the actual test certificate. The presence of a document is still subject to substantive review. A filename labelled final or audited carries no automatic evidential status. Management can use the matrix to decide whether further follow-up is proportionate to the proposed study and its lawful purpose.
| Check | Required match | Unresolved or failed example |
|---|---|---|
| Forecast vintage | Authenticated version preceding target window | Current webpage repeats a forecast without original receipt |
| Entity | Same defined legal entity or approved perimeter | Acquired group revenue substituted for original entity |
| Measure | Same commercial variable and recognition basis | Funding announcement compared with equity cash received |
| Denominator | Same population or accounting base | Company turnover compared with sector-incremental turnover |
| Time | Same start, end and annual or cumulative basis | Earlier annual actual compared with later five-year target |
| Conditions | Conditional assumptions carried into interpretation | Survival-conditioned forecast compared with unconditional outcome |
| Evidence | Specified assurance and lawful access | Beneficiary statement presented as independent audit |
Authored research protocol. These are admission criteria for a comparison, not a statement of programme eligibility rules.
8 Freeze the entity measure and accounting boundary
Commercial evidence should describe the business whose outcome was forecast. A proposal submitted by a subsidiary may cite a parent group's market presence and still forecast the subsidiary's own sales. Later consolidated accounts cannot be substituted without a reconciliation. The proposed register records the legal identifier, consolidation perimeter and any project-specific segment before the follow-up begins. It then retains acquisitions, disposals, changes of name and transfers of intellectual property as events that may affect comparability. The presence of a familiar brand supplies no entity linkage by itself.
Revenue needs an operational definition that another reviewer can apply. The record should state whether the prediction concerns recognised revenue, bookings, gross merchandise value, contracted order value, annual recurring revenue or cash collection. A subscription business could report several of these quantities for the same customers. A project company's customer receipts might include taxes, deposits or pass-through amounts that are excluded from its chosen revenue measure. The study should follow the actual stated accounting basis and obtain a reconciliation where the original forecast uses a different management measure. This paper supplies no accounting-policy determination for a company.
Annual and cumulative values require separate fields. A forecast of sales during the fifth financial year is checked against that year's defined sales. A five-year cumulative forecast requires the sum over the specified five periods. A forecast beginning at first commercial deployment needs a verified deployment origin before its relative years become calendar windows. If management changes its financial year or reports a short transition period, the analyst should preserve the original prediction and document any conversion. A proportionate estimate may be useful for a sensitivity exercise, but it should not be presented as a directly observed annual actual.
Currency and prices create another boundary. The register should preserve the submitted currency, nominal or real price convention and any specified exchange-rate assumption. A comparison in a different reporting currency needs a disclosed conversion rule applied consistently to forecasts and outcomes. Otherwise, operating performance and currency movements enter one unexplained error. Where a project seeks international market access, revenue geography should also be defined. Customer billing location, deployment location and legal-entity residence answer different questions and may require different evidence.
Employment forecasts need the same care. A headcount at year end differs from average paid full-time-equivalent employment over a year. Contractors, founders without payroll, agency staff and employees outside the applicant entity need explicit treatment. Our worked example uses average paid employee FTE over a calendar year and supplies its definition before any calculation. The choice is illustrative. An actual grant's reporting instructions may prescribe another measure. The researcher's task is to match that measure consistently and retain a reconciliation rather than silently changing it to fit the most accessible dataset.
| Claim | Boundary to freeze | Matching evidence sought |
|---|---|---|
| Revenue | Entity, recognition policy, financial period and currency | Accounts or a reconciled revenue ledger |
| Equity event | Instrument, new cash, recipient and closing window | Executed documents plus receipt evidence |
| Employment | Headcount or average FTE, paid status and perimeter | Defined payroll or employment records |
| Technical validation | Protocol, threshold, site and deadline | Dated result under the frozen protocol |
| Project-attributable sales | Baseline and attribution rule | Separate identification design and supporting records |
Proposed evidence categories. The table does not certify any supplied company record.
9 Define probabilities expected values and technical commitments
The requested forecasting task should determine the score. An event probability describes the chance of a defined event by a defined horizon. An expected revenue is an arithmetic mean of a predictive distribution. A median revenue divides that distribution at its midpoint. A contractual milestone states a delivery requirement under its actual terms. Gneiting's analysis explains why assessment can become misleading when the forecast directive and scoring function are mismatched. The grant reviewer should therefore identify the requested quantity before interpreting the accuracy of a submitted point forecast. [15]
The worked funding event is at least one new arm's-length priced external equity round with positive cash received by the same entity during the three-year window. Grants, debt, founder transfers and announcements without the specified event are excluded from that definition. Its probabilities can be assessed by mean binary squared error, usually called the Brier score. For each resolved event, subtract its zero-or-one outcome from the submitted probability, square that error and average across the same resolved cases. Smaller values indicate lower realised loss under this rule. The proper-scoring literature supplies the wider theoretical setting. [16]
Expected revenue and expected FTE are assessed with mean squared error in this example because the forecast directive is the arithmetic mean. Root mean squared error returns that quantity to the original unit and is useful for presentation. Mean absolute error is also shown as a descriptive summary of realised errors. Its inclusion does not change the original directive into a median forecast. A study comparing different forecasting procedures should specify the functional and evaluation method in advance and avoid selecting whichever loss function makes a preferred procedure look strongest after observing the outcomes.
A technical commitment without a probability receives a delivery assessment. The protocol records its deadline, pass threshold, test conditions, verifier and evidence standard. A successful test under a different operating environment might be commercially interesting while leaving the original commitment unresolved. The result should retain both pieces of information with their proper scope. Counting verified passes among resolved commitments is legitimate descriptive reporting. That proportion cannot establish whether submitted probabilities were calibrated when no such probabilities were collected.
A larger social or environmental claim requires a similarly explicit measurement route. Avoided emissions, reduced water loss or increased access need a baseline, population, timeframe and method appropriate to the claimed effect. A forecast may be conditionally checkable if those components and later evidence exist. This paper makes no claim that wider impacts are universally uncheckable. The appropriate register decision is claim-specific. Where a defensible outcome measure or causal design remains unavailable, the study should retain the claim and its evidence gap without manufacturing a numerical validation.
10 Preserve forecast vintages and financing conditions
An application can contain several forecast versions before a decision is made. Management may update a market assumption, respond to a reviewer's question or change the financing plan. These are useful revisions when their reasons are documented. For research, each version needs its own registration time and lead time to the target outcome. The original submission should remain available even when a later version becomes the operative management plan. Otherwise, a study can accidentally evaluate an updated forecast as though it had been issued with the original information set.
We propose retaining an immutable copy of the submitted forecast, its attachment identifier, a hash and the portal receipt where available. These records provide evidence about file identity and submission chronology within their actual system controls. A hash by itself establishes neither the content's truth nor its original creation date. The register should connect the file to the receipt and record who had access and authority to revise the active plan. Revisions then become additional observations with their own reasons and dates, rather than overwrites of the first prediction.
Financing conditions should be stated at the same level of precision. A forecast conditional on receiving a grant and raising an equity round needs both conditions recorded. If the second round remains uncertain, management may also prepare an unconditional forecast that incorporates the probability and consequences of not raising it. Those two forecasts answer different questions. The evaluator should identify which one the programme requested and which one the board used for cash commitments. A later funding shortfall cannot be interpreted responsibly without that original conditional statement.
The timing of resources also matters to commercial milestones. A project might require a supplier deposit before a reimbursement arrives or need working capital to service an initial customer contract. A forecast register can link milestone dates to the financing assumptions that support them. A separate treasury schedule should record expected and actual funding receipts, restrictions and committed expenditure. This link makes a changed assumption visible to management. It supplies no forecast of award timing or certainty of payment; those depend on the actual programme and executed documents.
For a prospective study, the version policy should be determined before outcome scoring. One analysis can evaluate original submissions at a common lead-time definition. Another can examine revisions, provided each revision precedes the relevant outcome and its timing is disclosed. Mixing the latest available forecast for some firms with the original forecast for others creates an uneven information advantage. The register should show that difference directly and allow the analyst to restrict a comparison to a consistent vintage. Such restrictions may reduce the sample, which should remain visible in the denominator.
| Field | Reason for retention | Version treatment |
|---|---|---|
| Original receipt and file identity | Establish the submitted content and chronology | Preserve without overwrite |
| Forecast target window | Define the period predicted | Carry through every comparison |
| Funding conditions | Identify conditional commercial assumptions | Record each changed condition |
| Revision timestamp and reason | Identify information available when revised | Score separately by lead time |
| Evidence collection date | Distinguish outcome timing from retrieval | Retain actual retrieval history |
Authored record design; a cryptographic hash is a file-identity aid, not a standalone trusted timestamp or factual certification.
11 Establish the evidence and follow-up protocol
A follow-up protocol should specify the evidence needed for each metric and the permissions under which it will be processed. Public documents can support a documentary inquiry within their visible scope. Confidential applications and company records require an appropriate access and governance arrangement. NSF's current preparation guidance explicitly describes protection of proposal data and commercial material, while its public-summary instructions exclude proprietary information. This is one reason a public award description cannot be treated as a full application forecast. A research design should resolve access rights before promising a matched microdata study. [10]
Evidence quality should be recorded without implying that official republication independently verifies a beneficiary's commercial statement. We propose separate categories for an attributed self-report, a reconciled administrative record and independently assured evidence, with the actual assurance scope retained. These categories are analytical labels for the study, not a substitute for an auditor's or funder's professional judgement. A financial audit might cover company accounts while leaving a project-attribution claim outside its scope. A technical certificate may establish a test result while saying nothing about future customer demand.
Follow-up should begin with a contact and evidence plan rather than a single survey at the final horizon. The register can identify which observations are expected during implementation, which mature at commercial deployment and which require later accounts. UKRI's reporting overview describes outcome reporting beyond a project's completion, subject to its applicable scope and exemptions. Its Principles of Use also describe accuracy responsibilities and exclusions for sensitive information. Those provisions illustrate the importance of knowing the reporting population and permissions; they should not be extended automatically to every business grant or innovation scheme. [4,5]
The protocol should specify how unanswered requests, conflicting records and incomplete periods are handled. A nonresponse remains a nonresponse unless another admissible source resolves the target. Conflicting amounts should retain their source, date and reconciliation status. A target whose horizon has not yet matured should be labelled pending and excluded from a completed-horizon score under the pre-specified rule. These operational distinctions allow an evaluator to report follow-up coverage without implying that every excluded observation is a commercial failure.
A proportionate assurance process can focus on material claims and unresolved cases while retaining a consistent minimum standard. Reviewers should be able to trace a score back to the registered forecast and the admitted actual without exposing confidential material to unauthorised readers. An external paper may publish aggregate results and a data dictionary while keeping identifiable records controlled. The design should disclose the resulting reproducibility limit. Access restrictions are part of the study's evidence conditions and should be addressed directly rather than concealed by confident language about data quality.
| Source set | Commercial evidence in reviewed material | Access or interpretation boundary |
|---|---|---|
| EIC Accelerator 2026 | Market assumptions and financial projections in assessment | Complete proposal information is not established as public |
| Horizon Europe 2026/27 | Credible impact pathways and exploitation considerations | Action and current criteria govern; timing varies by result type |
| Innovate UK | Business case and exploitation plan monitoring | Later plan versions are distinct from the application |
| NSF SBIR/STTR | Commercial potential and specified proposal material | Protected proposal data differs from the public summary |
| SBA reporting | Company Commercialization Report through authorised dashboard | Existence of reporting does not establish public microdata access |
| Hub71 reports | Published community-level commercial aggregates | No matched applicant forecast/outcome sample established |
Bounded documentary comparison [1-5,9-11,13], accessed 11 November 2026. No cross-programme success-rate or eligibility comparison is implied.
12 Introduce the constructed measurement portfolio
The quantitative example contains twelve wholly constructed cases, labelled A to L. Their probabilities, forecast amounts, outcomes and missing observations are authored inputs. They represent no company, programme or measured population. The common forecast origin is immediately before 1 January 2023. The financing-event window runs from that date through 31 December 2025. Revenue and employment refer to calendar financial year 2025, and technical commitments share the end-2025 deadline under a hypothetical protocol frozen with the forecast. The review occurs after those horizons. This chronology demonstrates a mature target window without claiming an observed historic cohort.
The funding target is a defined priced external equity event with positive cash received. Revenue forecasts are unconditional arithmetic means in nominal EUR thousands for the same legal entity and calendar year. Employment forecasts are unconditional arithmetic means of average paid employee FTE, defined as the sum of daily paid full-time-equivalent employment divided by 365. Contractors and agency workers are excluded. Technical commitments use separately stipulated pass, fail or unresolved outcomes under the hypothetical acceptance convention. The example supplies no actual test protocol or customer certificate and makes no claim of real technical verification.
Observation coverage differs by metric. Ten funding events are resolved, nine revenue outcomes are supplied, ten FTE outcomes are supplied and ten technical commitments are resolved. The funding outcomes for I and J are unknown; revenue is missing for F, I and L; FTE is missing for I and L; technical outcomes are unknown for F and L. These masks are supplied separately, with no statistical independence or missingness mechanism assumed. Cases E and H contain explicit stipulated whole-year zero-revenue and zero-FTE observations. Their zeros are never inferred merely from closure.
The reference funding forecast is a fixed probability of 0.4 for every case. It is an authored comparator chosen before scoring, not an estimated programme base rate. A second comparator mechanically moves each submitted probability halfway towards 0.4. No regression, calibration fit or optimisation is performed. These choices allow a reader to reproduce a comparison and understand how it changes under missing outcomes. Their realised performance in twelve constructed cases supports no recommendation that an applicant or programme should adopt those probabilities.
All rational score calculations retain exact fractions, with decimals used for presentation. Root mean squared error is an approximate square root of the exact mean squared error. Every metric exports its case membership and denominator. The four possible binary completions for the two unknown funding events are enumerated explicitly. The continuous sensitivity exercises retain their arbitrary caps as assumptions. This design provides transparent arithmetic and a small enough input set for manual review. It does not supply a sampling distribution, estimated confidence interval or empirical validation sample.
| Case | Submitted probability | Resolved event |
|---|---|---|
| A | 0.8 | 1 |
| B | 0.7 | 1 |
| C | 0.6 | 0 |
| D | 0.6 | 1 |
| E | 0.5 | 0 |
| F | 0.4 | 0 |
| G | 0.3 | 1 |
| H | 0.2 | 0 |
| I | 0.5 | Unresolved |
| J | 0.1 | Unresolved |
| K | 0.4 | 1 |
| L | 0.7 | 0 |
Every entry is an authored assumption. Event 1 means the specified equity-cash event; event 0 is a stipulated resolved non-event. No actual applicants are observed.
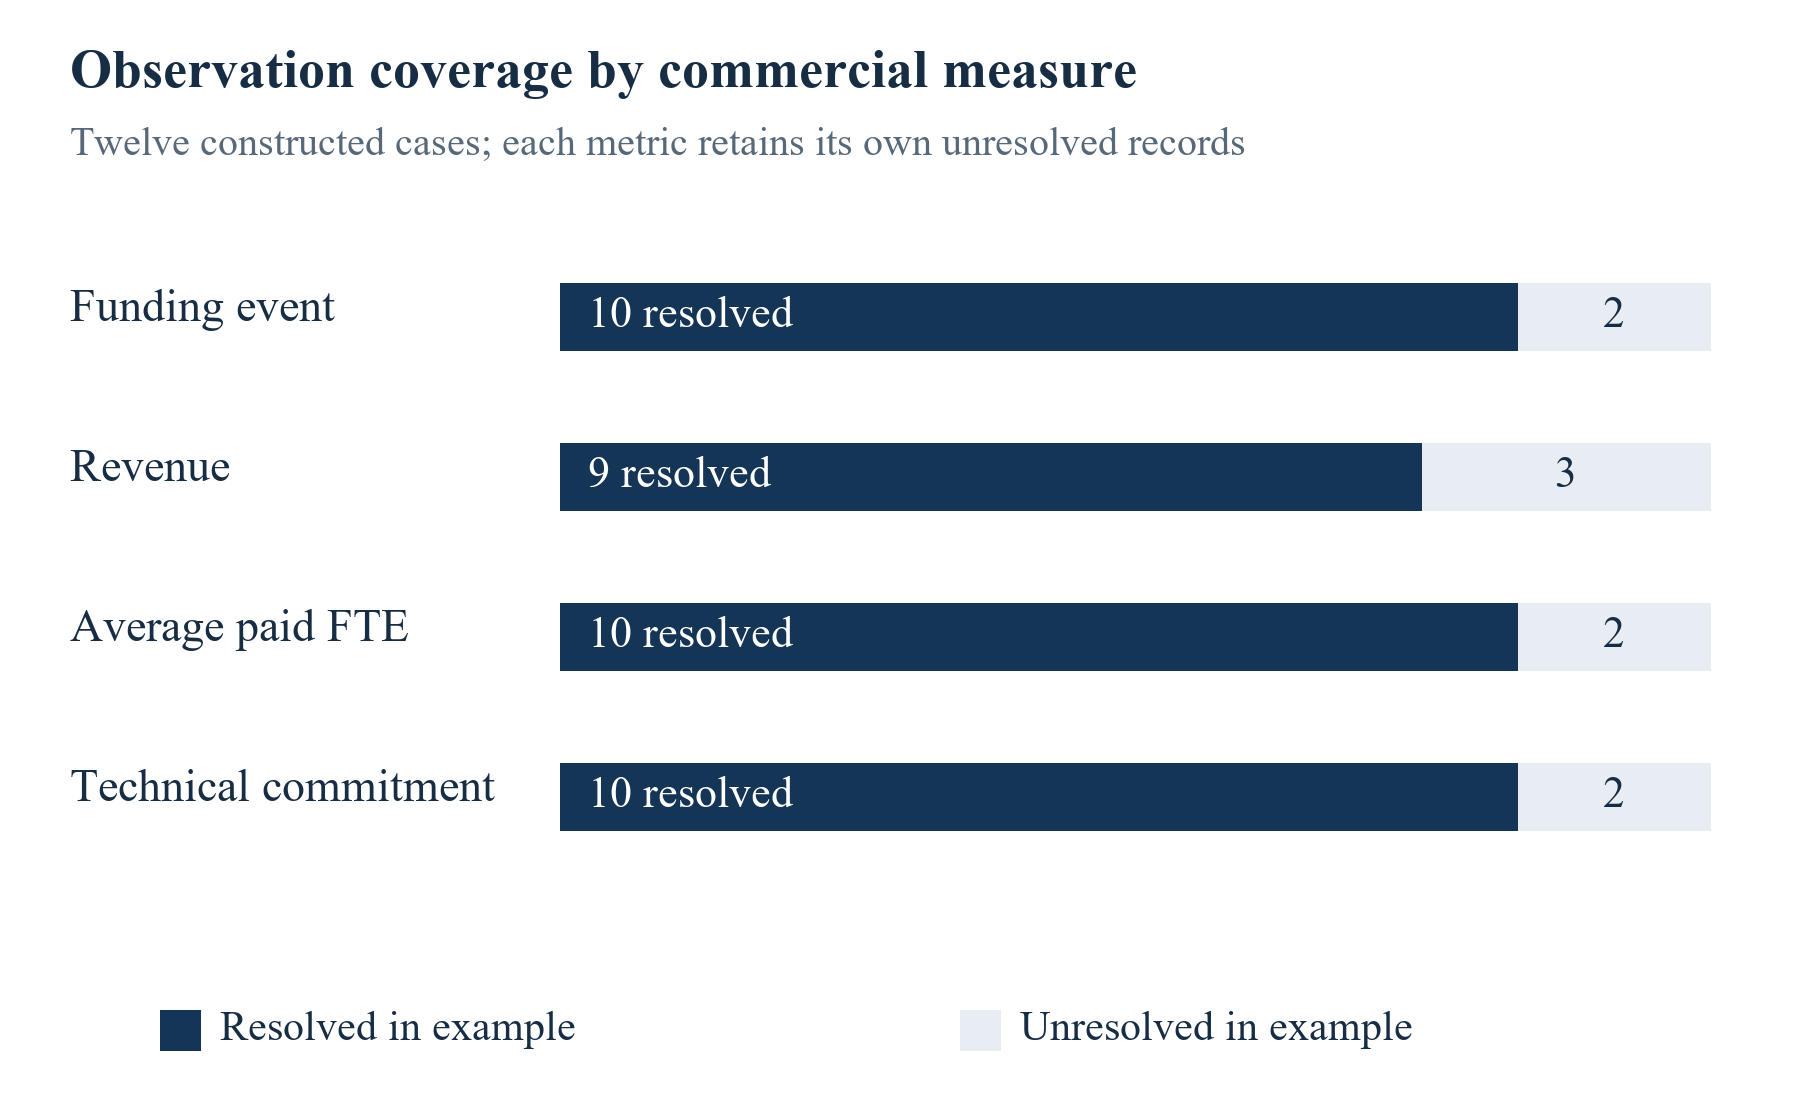
Scroll horizontally to read the figure at full size. You can also open the full-size figure.
Constructed input masks. Counts describe this worked example only and are not measured programme reporting rates.
13 Score resolved funding events with explicit comparators
The resolved funding set contains A, B, C, D, E, F, G, H, K and L. Five events occur among these ten constructed cases. The mean submitted probability is 0.52, giving a mean probability minus event frequency of 0.02. The Brier score is 0.244. The fixed 0.4 reference scores 0.260 on exactly the same cases. The mechanical halfway comparator scores 0.240. Each comparison uses the same event definition, horizon and admitted outcomes. The two unresolved cases do not enter any of these ten-case calculations.
Brier skill relative to a reference is defined here as one minus the submitted score divided by the reference score. The submitted probabilities therefore have skill 4/65, approximately 0.0615, and the mechanical comparator has skill 1/13, approximately 0.0769. These are realised worked-example values. A positive skill value means the selected probabilities incurred less average squared loss than the specified reference on these cases. It supplies no guarantee that either forecast improves upon a real funder's model or will perform better in another cohort. A zero reference score would leave this ratio undefined and should be reported explicitly.
Individual cases help explain the aggregate. Case A assigns 0.8 to an event that is stipulated to occur, producing squared error 0.04. Case G assigns 0.3 to an event that occurs, producing 0.49. Case L assigns 0.7 to a non-event and also produces 0.49. The score penalises confident errors in either direction under a symmetric binary-loss convention. A programme's actual allocation decision may have asymmetric consequences and other objectives. Forecast assessment and resource allocation should retain their separate decision rules, rather than treating a lower Brier score as a complete funding policy.
The comparator's definition matters as much as its numerical result. A constant probability fitted from the current ten outcomes would use information unavailable at forecast origin. It could serve as an in-sample descriptive reference if labelled accordingly, but would not be an operational ex-ante forecast. Our constant 0.4 avoids that particular leakage by being fixed as an assumption. A real prospective study should use a genuinely available historical reference, document its training population and evaluate any updating rule on later cohorts. That additional evidence is absent from the present illustration.
A results table should show score, reference, case count, horizon and missing outcomes together. Rounding should follow calculation rather than precede it. If one method is scored on nine cases and another on ten, their numerical ranking may reflect the changed sample. The pair-admission log should allow an analyst to reproduce the common comparison set and assess any excluded cases. Where different methods genuinely issue forecasts for different populations, coverage becomes a separate reported outcome and should not disappear from the evaluation.
| Measure | Submitted | Fixed reference | Mechanical halfway comparator |
|---|---|---|---|
| Cases scored | 10 | 10 | 10 |
| Brier score | 0.244 | 0.260 | 0.240 |
| Brier skill against fixed reference | 4/65 | 0 | 1/13 |
| Rule | Original supplied probabilities | 0.4 for every case | Halfway from submitted probability to 0.4 |
Exact fractions underlie displayed scores. No parameter is fitted to observed programme data. Mechanical-comparator performance is not calibration validation.
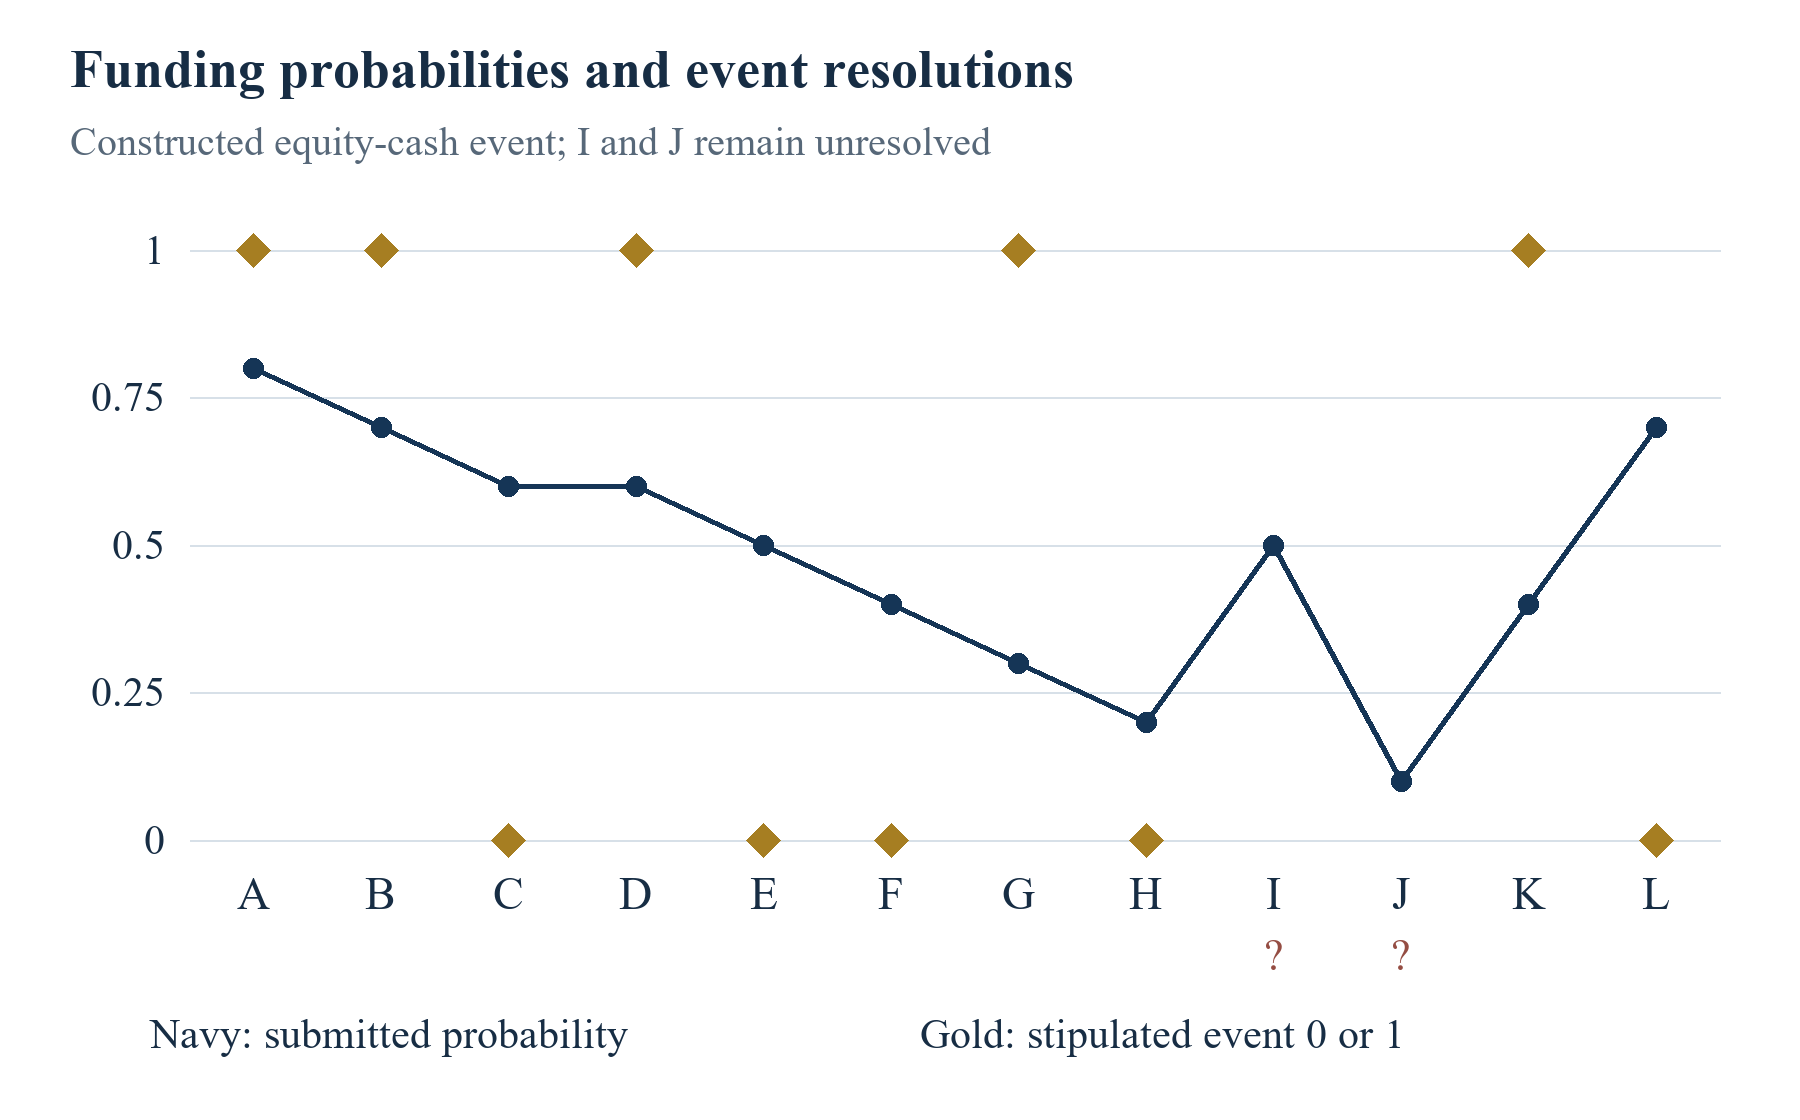
Scroll horizontally to read the figure at full size. You can also open the full-size figure.
Wholly constructed cases. Unresolved events are displayed separately and contribute no observed-case loss.
14 Separate probability calibration from ranking
A probability can order cases usefully and still express an inaccurate level of confidence. Ranking asks whether higher forecasts tend to accompany events. Calibration asks whether the probabilities align with event frequencies under the relevant information and population. The distinction matters when an assessor uses a forecast first to prioritise review and then to budget expected commercial outcomes. A ranking statistic alone cannot justify using the submitted probability as a cash-planning input or as an estimated award probability.
For the ten resolved constructed funding cases, pairwise AUC is 31/50, or 0.62. It compares the five event cases with the five non-event cases, assigning half credit when their probabilities tie. There are 25 such pairs. The mechanical halfway transformation preserves the ordering and ties because it is a strictly increasing affine transformation. Its AUC is therefore also 0.62, even though its Brier score changes. This is a mathematical property of the transformation on the supplied cases. It does not establish that the transformed probabilities are calibrated.
The bin summary uses three intervals fixed before scoring: probabilities below one-third, from one-third to below two-thirds, and from two-thirds to one inclusive. Among resolved cases, the low bin contains G and H, the middle bin contains C, D, E, F and K, and the high bin contains A, B and L. Their mean probabilities are 0.25, 0.50 and approximately 0.7333. Their event frequencies are 0.50, 0.40 and approximately 0.6667. Displaying bin counts is essential because these differences are based on only two, five and three constructed observations.
The overall probability excess of 0.02 does not imply uniformly close calibration. Opposing bin differences can offset in an aggregate. Equally, a noisy small-bin frequency is insufficient evidence of a systematic population defect. A real study should pre-specify bins or another calibration method, retain its evaluation population and quantify uncertainty using a design appropriate to independent observations, clustering and repeated cohorts. The present table demonstrates the objects that need to be reported and provides no estimated confidence limits for a real programme.
Recalibration requires a further chronological boundary. A model fitted using later outcomes cannot be described as an ex-ante correction for those same outcomes. Training, tuning and evaluation periods need to be separated, with the original forecast preserved alongside the adjusted version. Common shocks and changes in programme composition also affect transportability. A funding dashboard should therefore state the validation period and population whenever a recalibrated probability is used. Our mechanical comparator supplies no such validation record and remains solely a disclosed arithmetic comparison.
| Fixed interval | Cases | Mean probability | Event frequency |
|---|---|---|---|
| 0 to below 1/3 | G, H; n 2 | 1/4 | 1/2 |
| 1/3 to below 2/3 | C, D, E, F, K; n 5 | 1/2 | 2/5 |
| 2/3 to 1 inclusive | A, B, L; n 3 | 11/15 | 2/3 |
Constructed descriptive bin summary. Tiny bin counts support no population calibration claim or confidence interval.
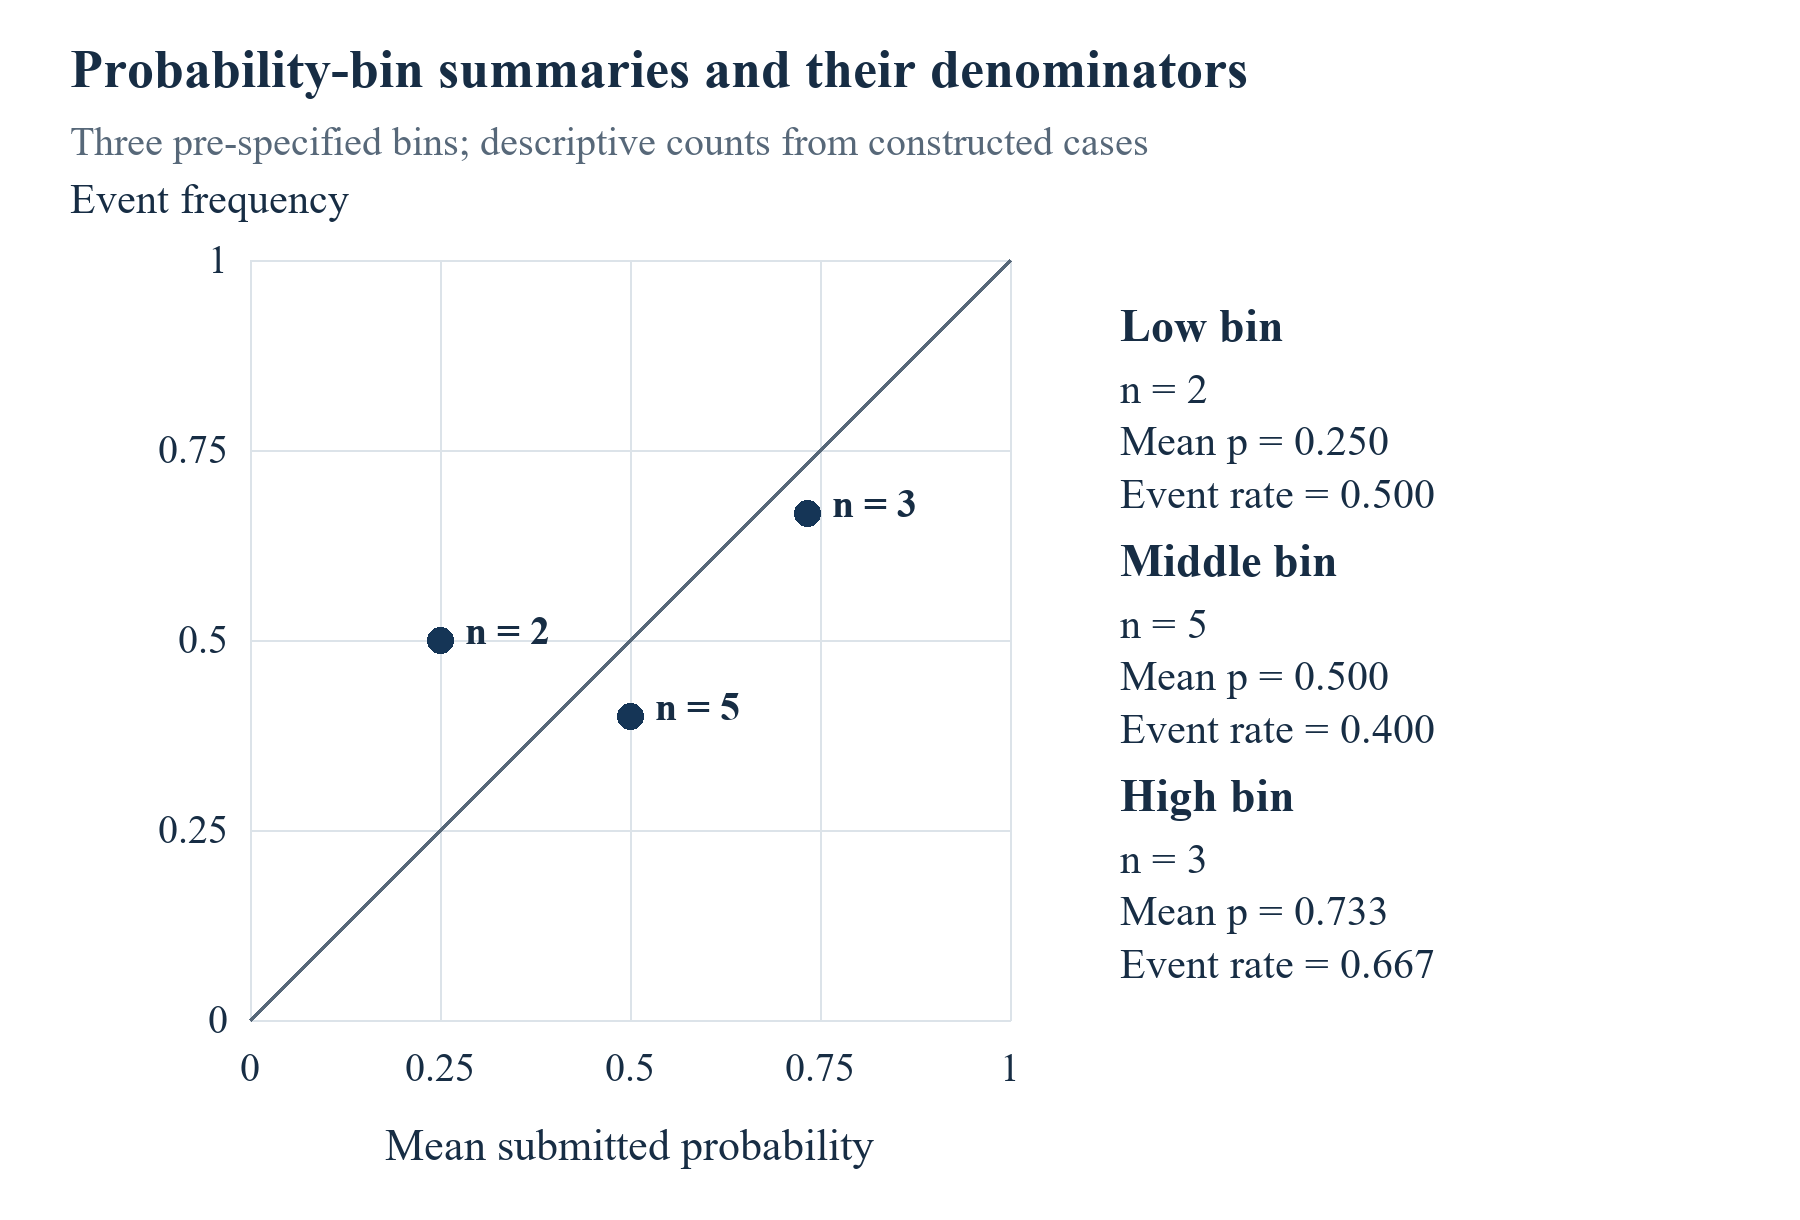
Scroll horizontally to read the figure at full size. You can also open the full-size figure.
Constructed cases; descriptive comparison only. The 45-degree equality reference is not a fitted calibration curve.
15 Measure revenue forecast errors on matched observations
Revenue scoring uses nine cases with both forecast and stipulated actual: A, B, C, D, E, G, H, J and K. Their forecast total is 5,300 EUR thousands and their actual total is 4,530 EUR thousands. Forecast minus actual is 770 EUR thousands, giving mean signed error 770/9, approximately 85.56 EUR thousands. The forecast-to-actual total ratio is 530/453, approximately 1.1700. Relative overstatement of the total is 77/453, approximately 17.00 percent. The ratio and the percentage express different quantities and should have distinct labels.
The mean squared error is 667,900/9 in squared EUR-thousand units. Its square root is approximately 272.417 EUR thousands. Mean absolute error is 230 EUR thousands. The signed mean describes the direction of net error, while squared and absolute losses describe its magnitude under their respective definitions. Positive and negative errors can offset in the net total. A portfolio can therefore show a modest signed error alongside substantial case-level deviations. The case table makes those deviations inspectable rather than allowing the aggregate to carry the entire interpretation.
The treatment of zero actuals is important. Cases E and H have stipulated complete-year zero observations and positive forecasts. Percentage error calculated separately by dividing by each case's actual would be undefined for those cases. Dropping them to obtain a convenient percentage would change the sample and omit material forecast errors. Our primary scores retain them through differences in original units. A total ratio is reported only because the matched actual total is positive. A study should define its zero and denominator treatment before examining which firms occupy those positions.
Revenue scaling also affects what a comparison means. An equal-case MSE weights each case's squared currency error equally in the arithmetic, so larger currency deviations contribute more to the result. A researcher interested in relative performance might choose another pre-specified measure, with explicit treatment of zeros and scale. That would be an additional estimand. It should not replace the chosen score after the outcome is seen or be combined with FTE and technical milestones through undisclosed weights. The decision purpose should explain why a particular summary is useful.
The nine-case total cannot be compared with all twelve submitted forecasts as though the missing actuals were zero. Forecasts for F, I and L sum to 1,350 EUR thousands, but their realised revenue remains unknown in the supplied records. They belong in the coverage and sensitivity analysis. An evaluator may report a matched-case result and a separate whole-portfolio bound. Those outputs preserve what is known about each population and prevent an apparent aggregate accuracy estimate from being created by a change of denominator.
| Case | Forecast mean | Stipulated actual | Forecast minus actual |
|---|---|---|---|
| A | 1200 | 1000 | 200 |
| B | 900 | 1200 | -300 |
| C | 800 | 400 | 400 |
| D | 600 | 800 | -200 |
| E | 500 | 0 | 500 |
| F | 400 | Missing | Not scored |
| G | 300 | 450 | -150 |
| H | 250 | 0 | 250 |
| I | 200 | Missing | Not scored |
| J | 100 | 80 | 20 |
| K | 650 | 600 | 50 |
| L | 750 | Missing | Not scored |
All values are authored assumptions. Matched totals use nine cases; three missing actuals remain missing. Zeros E/H are expressly stipulated for the complete target year.
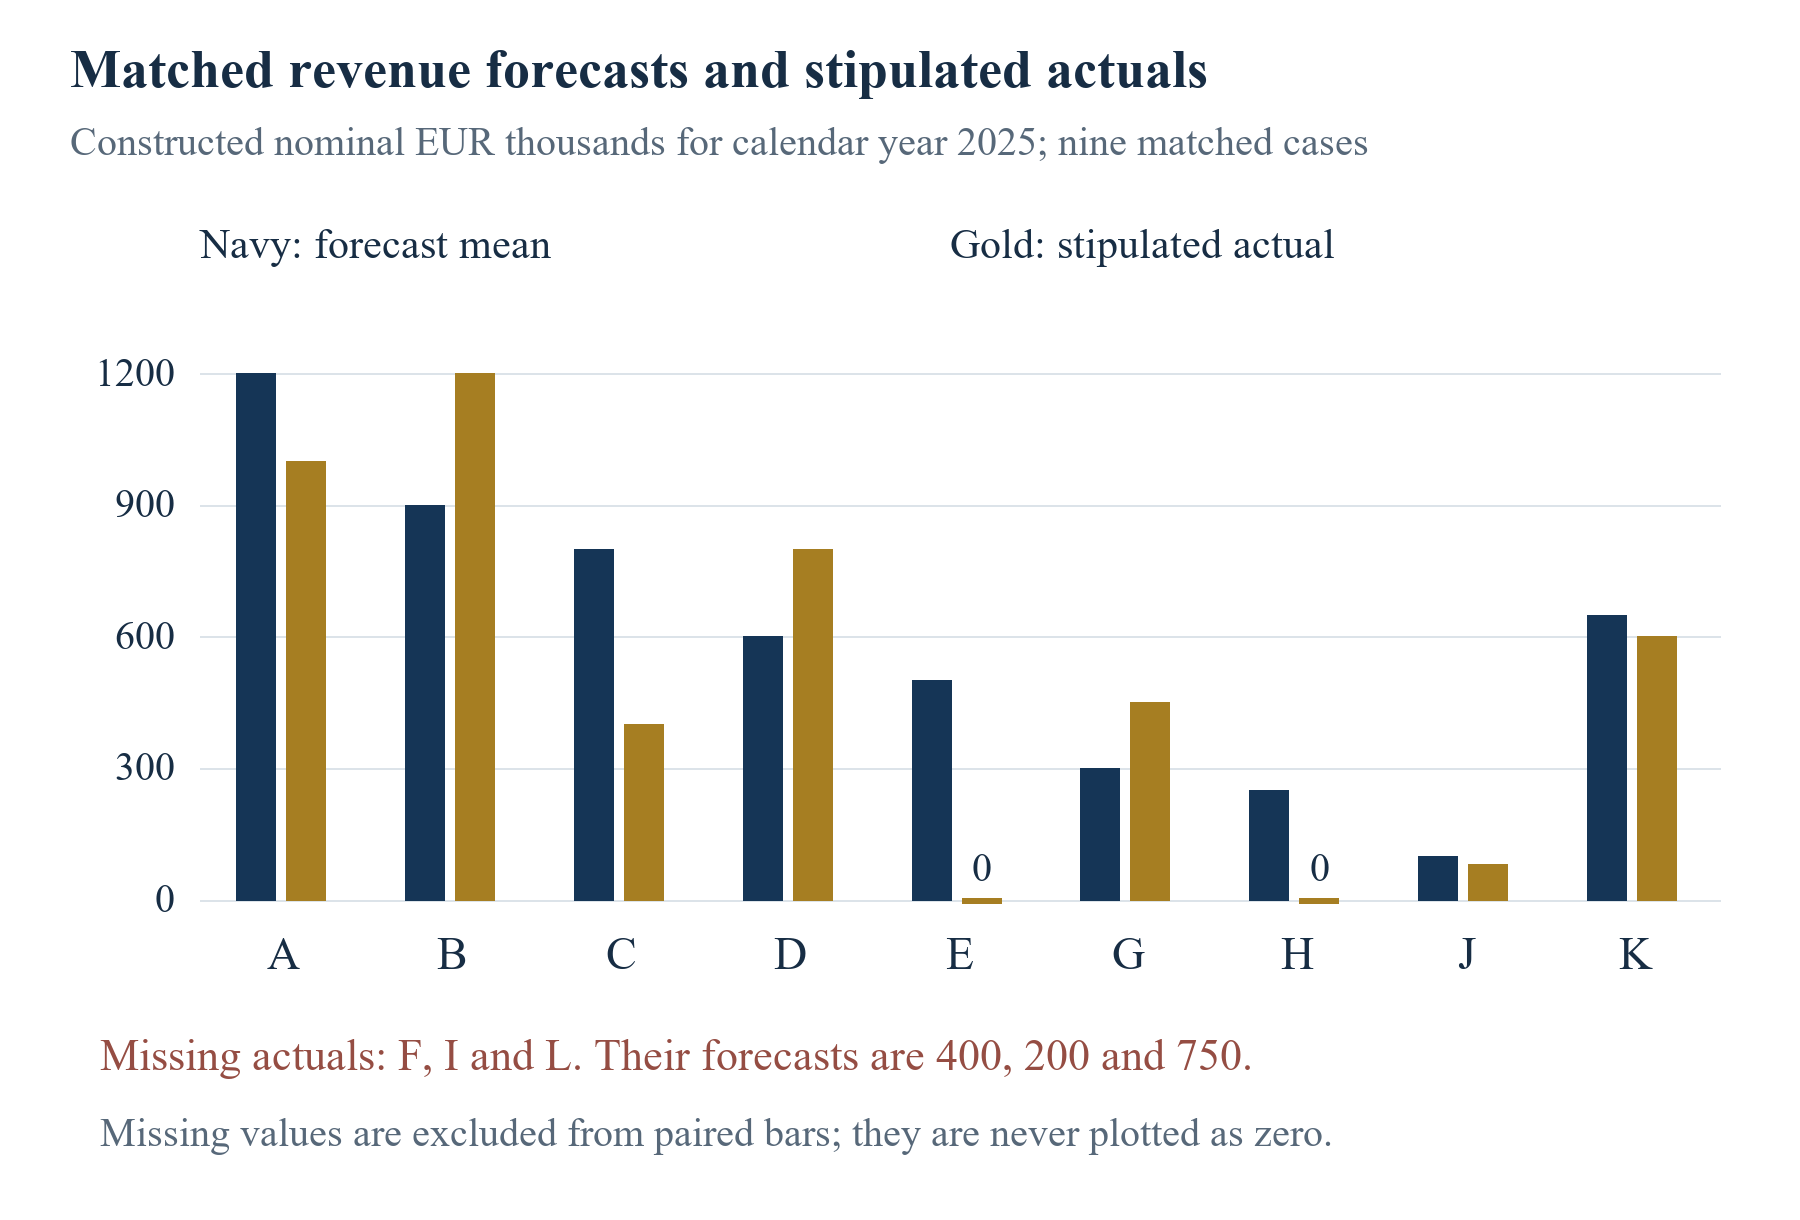
Scroll horizontally to read the figure at full size. You can also open the full-size figure.
Constructed nominal EUR-thousand amounts for 2025. No real company outcome or programme forecast error is estimated.
16 Check employment and technical delivery on their own terms
The employment comparison contains ten cases, including F whose revenue is missing. Their mean-FTE forecasts total 64 and their stipulated actual average FTE totals 51. The signed total error is 13 FTE, mean signed error 1.3 FTE, MSE 6.7 squared FTE and approximate RMSE 2.588 FTE. Mean absolute error is 2.1 FTE. The forecast-to-actual total ratio is 64/51, approximately 1.2549. The corresponding relative overstatement is 13/51, approximately 25.49 percent. These summaries use the employment observation mask rather than the revenue mask.
Average FTE is a time-averaged employment measure in this example. A headcount reported on 31 December would not automatically resolve it. Evidence would need to establish the paid full-time-equivalent employment over the specified days. A real study should retain the exact payroll convention, treatment of part-time work and entity perimeter. Our integer actuals are simply stipulated example values, even though an annual FTE average can be fractional. The absence of fractional inputs does not change the defined measure or authorise substituting a year-end count.
Technical delivery has ten resolved commitments, with six stipulated passes and four failures. F and L remain unresolved. The resolved commitment pass proportion is therefore 3/5. If both unresolved commitments failed, six of twelve would pass; if both passed, eight of twelve would pass. The whole-portfolio interval is thus one-half to two-thirds. These endpoints exhaust the missing binary possibilities for this delivery metric. They supply no probability distribution over those possibilities and no evidence about a real programme's technical success rate.
Commercial and technical measures may legitimately diverge. A product can meet a technical acceptance condition while its sales target remains unmet, or record employment while a particular milestone is delayed. The register should retain those outcomes individually and identify the exact relationship claimed in the application. A narrative that attributes all later revenue to one successful test would need additional evidence about commercial adoption and other contributing factors. The present arithmetic neither estimates that causal relationship nor assumes that one metric can resolve another's missing value.
A composite impact score would require explicit units, weights and an explanation of the decision it serves. Combining a binary event probability, currency error, employment error and a technical pass fraction without that structure would obscure their meanings. We retain separate summaries and allow a board or evaluator to assess the trade-offs in its own documented decision process. If a future study proposes a composite, it should preserve the underlying metrics, conduct sensitivity analysis and validate any claimed relation to subsequent decisions or outcomes using suitable evidence.
| Case | Forecast average FTE | Stipulated average FTE | Technical pass |
|---|---|---|---|
| A | 12 | 10 | 1 |
| B | 10 | 12 | 1 |
| C | 8 | 5 | 0 |
| D | 7 | 8 | 1 |
| E | 6 | 0 | 0 |
| F | 5 | 4 | Unresolved |
| G | 4 | 5 | 1 |
| H | 3 | 0 | 0 |
| I | 3 | Missing | 0 |
| J | 2 | 1 | 1 |
| K | 7 | 6 | 1 |
| L | 9 | Missing | Unresolved |
Authored inputs with independent metric-specific admission records. Separately supplied masks do not imply statistical independence. Technical values are stipulated resolutions under a hypothetical frozen-protocol convention.
17 Carry missing outcomes through the portfolio calculation
The two unknown funding events create four possible completed portfolios. Keeping every known outcome fixed, I and J can resolve as zero-zero, zero-one, one-zero or one-one. The full twelve-case Brier scores are respectively 9/40,7/24,9/40 and 7/24. The resulting range is 0.225 to approximately 0.2917. Each completion uses all twelve submitted probabilities and its corresponding complete outcome vector. The range describes the sensitivity of this constructed dataset to its unresolved binary events. It is not a confidence interval and assigns no likelihood to any completion.
The reference and ranking summaries change with the same completions. Their case-level resolutions must remain aligned when methods are compared. A lower bound for one metric and an upper bound for another may arise from different completed portfolios, so presenting both as one realised scenario would be incorrect. In this example AUC varies from 37/72 to 47/70 across the four completions. Mean probability minus event frequency ranges from minus one-tenth to one-fifteenth. The unresolved outcome for the low-probability case J materially affects those measures, even though its submitted forecast looks numerically small.
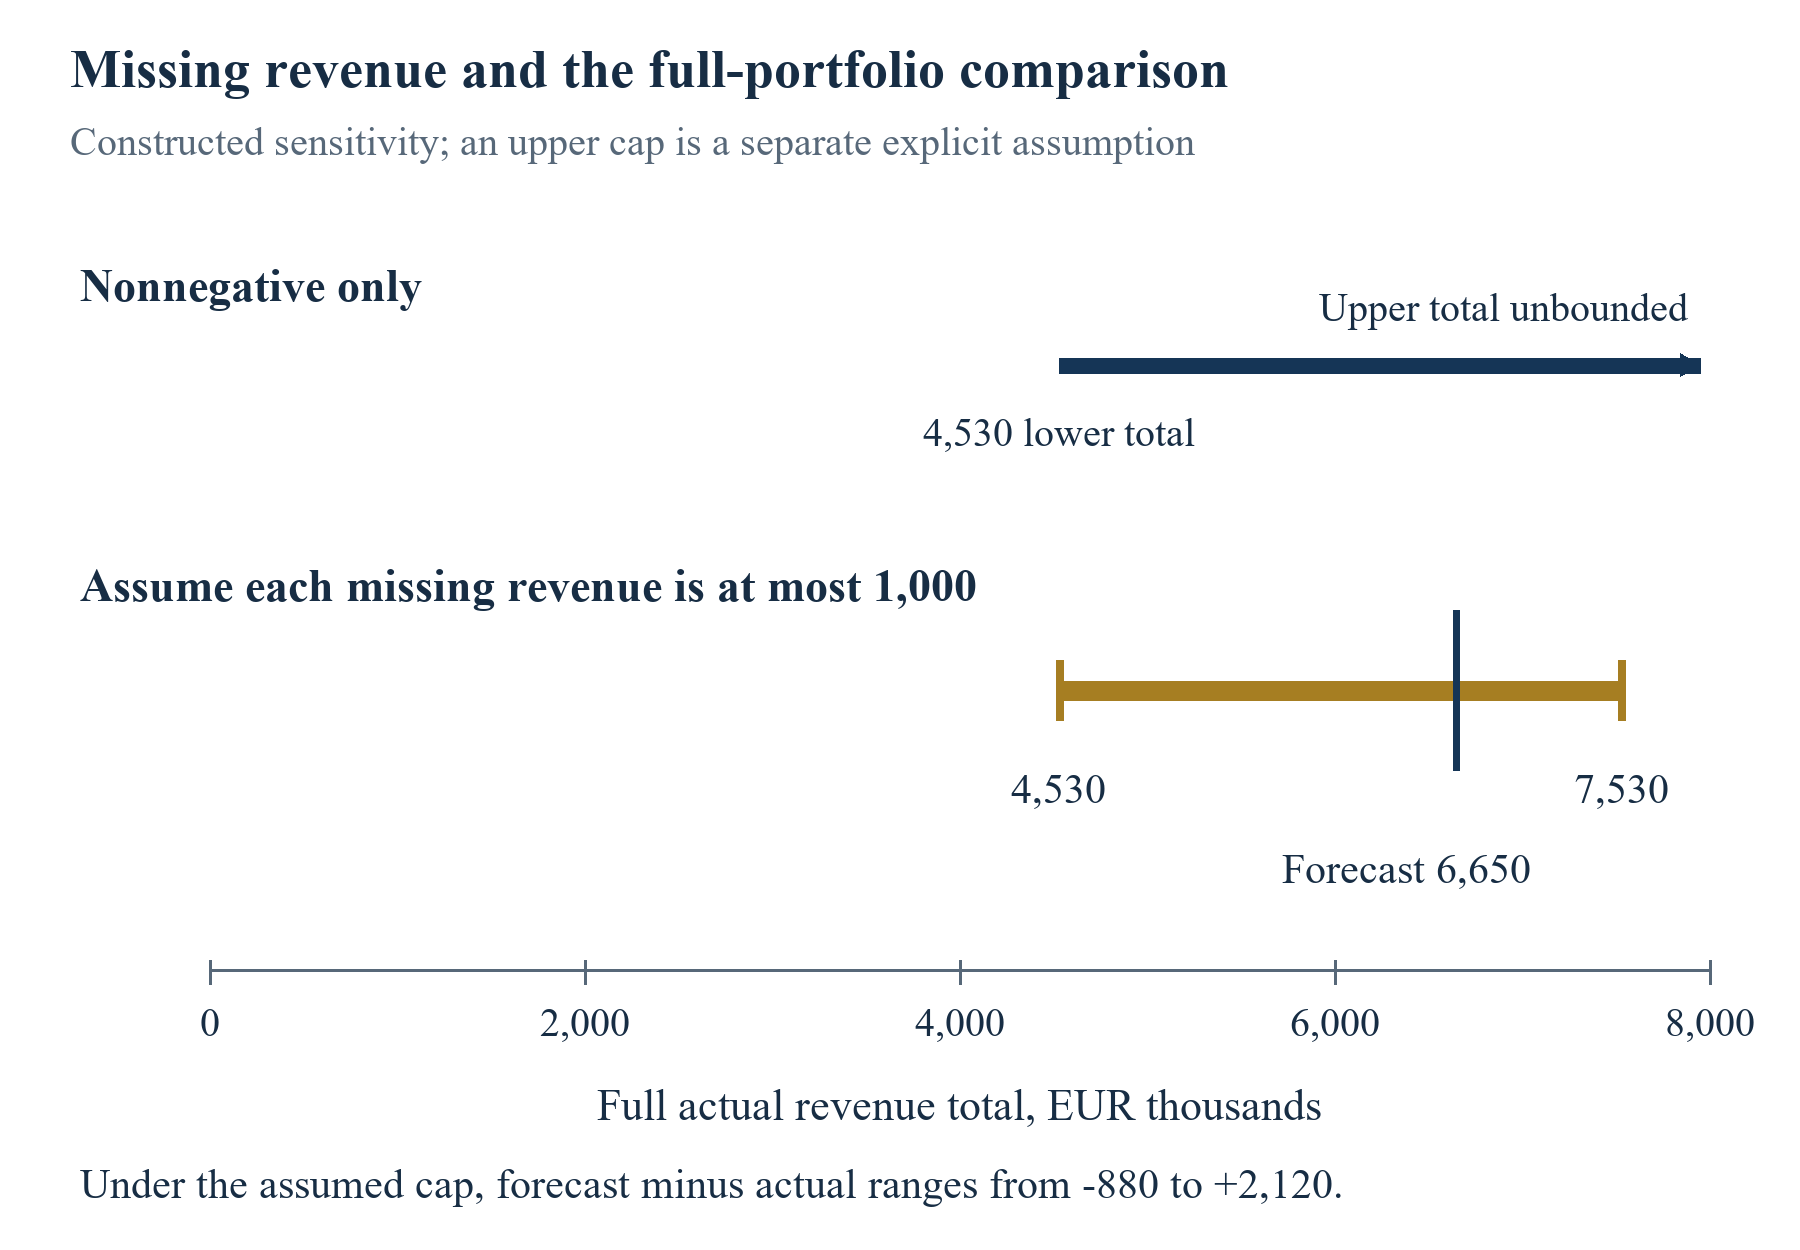
Missing revenue needs a different treatment because a nonnegative revenue amount has no finite upper bound under the example's minimal assumptions. The observed actual total is 4,530 EUR thousands. That is a lower bound for the twelve-case total if missing revenues are nonnegative. Nonnegativity alone supplies no finite upper total. The full forecast total is 6,650 EUR thousands. A single full-portfolio percentage error cannot be calculated from those facts, and a claim that the missing revenues are probably small would require evidence absent from this example.
A separate sensitivity exercise assumes each of the three missing revenues lies between zero and 1,000 EUR thousands. This arbitrary cap is introduced solely to show how an explicit additional assumption changes the conclusion. The full actual total then lies between 4,530 and 7,530 EUR thousands. Forecast minus actual lies between minus 880 and 2,120 EUR thousands. Either net understatement or overstatement is compatible with the assumed range. The cap is not a legal limit, market estimate, confidence bound or imputed observation. It should remain visible wherever its endpoints are reported.
For missing FTE, an equally explicit illustrative cap of 15 average FTE per missing case gives a full actual total between 51 and 81, against forecast 76. The signed total error can therefore range from minus 5 to 25 FTE. This separate cap is also an authored sensitivity choice. Neither capped result identifies a missingness mechanism. A real study could investigate administrative follow-up, reporting incentives and selection, but weighting or imputation would require additional assumptions and diagnostics. Keeping the unresolved values visible is the starting condition for that work, with the observation and sensitivity tables reported separately.
| I, J outcome | Submitted Brier | Reference Brier | AUC |
|---|---|---|---|
| 0,0 | 9/40 | 73/300 | 47/70 |
| 0,1 | 7/24 | 13/50 | 37/72 |
| 1,0 | 9/40 | 13/50 | 2/3 |
| 1,1 | 7/24 | 83/300 | 18/35 |
Exact calculations for four hypothetical completions of the constructed inputs. Unknown events have not been resolved in the underlying data.
| Metric | Additional assumption | Full actual total | Forecast minus actual |
|---|---|---|---|
| Revenue, EUR thousands | Nonnegative missing values only | At least 4530; upper unbounded | No finite lower error bound |
| Revenue, EUR thousands | Each missing value at most 1000 | 4530 to 7530 | -880 to 2120 |
| Average FTE | Each missing value at most 15 | 51 to 81 | -5 to 25 |
| Technical commitments | Unresolved outcomes all fail or all pass | 6 to 8 passes of 12 | Pass fraction 1/2 to 2/3 |
Caps and binary endpoints are explicit worked assumptions. Bounds have no probability or sampling-coverage interpretation.
Scroll horizontally to read the figure at full size. You can also open the full-size figure.
Constructed EUR-thousand sensitivity. Without the explicit arbitrary cap, actual-total upper bound is unbounded.
18 Recognise survival selection and unresolved company changes
A study of award recipients describes its selected population. It cannot establish how well rejected applicants forecast without their original predictions and comparable follow-up. A funder may select on perceived quality, commercial ambition or other criteria, which can change the distribution of submitted claims among recipients. The research plan should identify the population to which each result refers and preserve the selection process where available. The constructed portfolio contains recipients only and supplies no rejected-applicant comparison or allocation-effect estimate.
Survival conditions need special attention when commercial targets extend beyond the operating life of some businesses. A forecast expressed as revenue conditional on continuing to operate should be assessed under that condition, with the conditioning and population explicit. An unconditional expected revenue incorporates the possibility of closure in the forecast itself. Comparing a conditional forecast among survivors with a whole-cohort outcome changes the estimand. A study may report both views if it has both original forecast targets and suitable observations, but one should not be represented as a correction of the other.
Closure alone does not establish zero annual revenue for a financial year. A firm could have traded before closure, sold assets, transferred customer contracts or recognised revenue on another documented basis. Evidence about the target accounting window is needed. Our two zero examples explicitly stipulate full-window observations because the purpose is to demonstrate valid arithmetic, not infer accounts from a business-status label. A real record should state which accounting evidence supports a zero and whether the entity perimeter changed during the window.
Acquisition creates a further linkage question. The original company might remain a subsidiary with identifiable accounts, merge into another entity or transfer only part of its assets. A successor's total turnover can include activities absent from the original forecast. A practical study protocol should predefine whether it follows the original legal entity, a specific business activity or a documented successor perimeter. Any bridge needs a reconciliation and appropriate access. The acquisition announcement's valuation or transaction proceeds are separate outcomes and cannot automatically resolve the original revenue target.
Missingness may also reflect reporting burden, confidentiality, disputed definitions or commercial performance. The present dataset assumes none of these mechanisms. It uses a fixed supplied observation mask. A future empirical study should examine what is known about nonresponse, compare observable characteristics where lawful and appropriate, and disclose the assumptions behind any adjustment. A fitted reporting-probability model does not by itself establish that outcomes are missing at random. Sensitivity to unsupported assumptions should remain visible, particularly when conclusions depend on unobserved high-revenue or failed firms.
19 Compare financing structures without claiming causality
A financing register can record award type, cash receipts, timing, ownership terms, repayability and restrictions alongside commercial milestones. These facts help explain the resources and obligations under which a forecast was made. They should come from actual programme terms and executed documents rather than a broad label such as grant or accelerator. An equity-free programme may include noncash support, while another arrangement may combine grant and investment components. The research should retain the specific instrument and recipient entity before comparing the economic position of participants.
Dilution requires a defined transaction and capitalisation basis. A founder's ownership percentage after a priced round depends on the actual securities, option arrangements, conversions and other terms. A programme announcement or a headline support package cannot establish that percentage. Where the study lacks executed financing documents, the dilution field should remain unavailable or be recorded as a clearly attributed description of the published programme route. An illustrative ownership calculation belongs in a separate scenario with its inputs disclosed, rather than in an empirical outcome table.
Timing can be observed through distinct milestones: submission, decision, agreement, conditions satisfied and cash received. Their intervals answer different financing questions. A founder planning supplier commitments needs the relevant receipt and restriction dates, while an evaluator studying administrative processing needs its chosen start and end definitions. Mixing these intervals across programmes would produce a misleading comparison even if every recorded date were accurate. The register should retain the source for each date and leave uncertain or conditional events unresolved.
Observed differences in later commercial outcomes across instrument groups do not identify the effect of those instruments. Firms entering a grant-only route may differ from firms selected for investment support in their stage, sector, capital needs and other characteristics. A causal comparison requires a defensible design, assumptions and data on the relevant selection process. Howell's grant study and the Smart evaluation illustrate substantive attempts to address counterfactual questions in their own populations. They do not validate an unadjusted comparison among unrelated schemes or establish the effects of this proposed register. [6-8,14]
For this paper, the programme comparison is documentary and the numerical demonstration is wholly constructed. No matched cohort with observed award amounts, dilution, receipt timing and later outcomes was established. A prospective extension should first confirm access to each field and its legal basis, then define the outcome and comparison population. If financing terms remain confidential, a study may still evaluate forecast accuracy within an appropriately governed dataset while reporting that the proposed instrument comparison is unavailable. The scope should follow the evidence actually obtained.
| Field | Preferred source | Interpretation limit |
|---|---|---|
| Instrument and conditions | Governing terms and executed award documents | Programme label alone is insufficient |
| Award and actual cash | Award decision plus receipt evidence | Award amount is distinct from cash received |
| Ownership change | Executed financing and capitalisation record | No dilution inferred from headline support |
| Timing | Dated submissions, decisions, agreements and receipts | Each interval needs an explicit endpoint |
| Commercial outcome | Admitted matching accounts or other evidence | Gross outcome does not establish additionality |
Proposed empirical data request. None of these fields is supplied as observed applicant microdata in this paper.
20 Use commercial forecasts in the board financing plan
For management, the register should connect a grant narrative to the operating plan approved by the board. Sales forecasts imply delivery capacity, customer-acquisition expenditure and working capital. Technical milestones can require equipment orders, testing costs and recruitment. The application may describe an ambitious commercial pathway while the treasury plan needs to show the consequences of delayed financing or customer adoption. A common set of dated assumptions allows these documents to be reconciled without forcing them to serve the same decision purpose.
We propose a board review that asks which forecast is used for cash commitments, which assumptions depend on unreceived support and what evidence triggers an update. Management should identify costs that can be deferred, contractual obligations already incurred and the liquidity needed before a reimbursement or investment closes. These are company-specific judgements requiring actual cash records and documents. The framework supplies questions and record fields, with no recommended universal runway buffer, funding probability or expenditure ratio.
A material forecast revision should show both its operating driver and financing implication. A later deployment date could move revenue and change the period in which supplier or payroll costs arise. A change in expected customer mix could affect pricing, payment terms and the evidence needed to support demand. The register should preserve the original projection and the revised management view, with their separate dates. The board can then decide whether to continue, stage or revise a commitment using the current evidence while retaining the original research comparison.
Investor discussions can use the same discipline. A data room that connects the application forecast to subsequent accounts and explains deviations gives a reviewer a traceable evidence path. That is a proposed advisory deliverable, not a measured claim that the process increases valuation or closes a financing round. A company may have strong reasons for revised assumptions, including technical findings or a changed market. The quality of the record concerns whether those reasons and their consequences are supported, rather than whether every original forecast is achieved.
The practical value proposition for an adviser is therefore a bounded piece of work: establish the forecast register, reconcile financing conditions, define commercial metrics, identify evidence gaps and prepare decision-ready follow-up. Its scope, responsibilities and deliverables should be agreed with management. Separate specialist accounting, legal or technical advice may be needed for particular records. An adviser should not promise an award, a valuation uplift or a programme's acceptance merely because the documentation is structured. The outcome of the service remains distinct from the clarity of the work product.
21 Design an evaluator dashboard with visible denominators
A useful dashboard should make the study's population and missing information visible before presenting a headline score. We propose a top panel showing the registered cohort, matured horizons, admitted pairs, unresolved records and exclusions for each metric. The score panel then identifies the forecast vintage, comparison method and reference model. A third panel records revision and follow-up status. This layout allows a decision-maker to see whether a changed result reflects different outcomes, a different sample or a new definition.
Metric panels should retain units. A revenue RMSE in EUR thousands, an FTE error and a binary funding score cannot be interpreted on a common numerical scale without further choices. The dashboard can display them side by side with their definitions and case counts. If a decision-maker wants an overall programme judgement, that judgement should state the objectives and trade-offs explicitly. An unexplained average of heterogeneous scores gives a precise-looking number without a clear economic interpretation.
The worked example shows how the same portfolio produces several legitimate denominators: twelve registered cases, ten resolved funding events, nine matched revenues, ten matched FTE records and ten resolved technical commitments. A dashboard should display those denominators beside the corresponding outputs. A change in coverage should have its own history. When a previously missing outcome is admitted, the updated result should identify the newly included case and preserve the earlier version so that a reviewer can reconstruct the change.
A policy or management action triggered by a score should have a documented basis. An adverse revision could prompt a data-quality check, an assumption review or further technical diligence. It does not automatically establish fraud, poor management or a failed funding policy. The dashboard should direct users to the evidence needed for the specific decision and identify who is authorised to make it. Thresholds, escalation rules and materiality levels should be chosen for the actual programme and validated where an empirical performance claim is made.
Publication should preserve the same discipline. Aggregate reporting can include the cohort flow, observation masks, score definitions and sensitivity results while protecting confidential records. The external reader should be able to distinguish a disclosed self-report from assured accounts and a proposed method from an evaluated intervention. Where data cannot be shared, explain the verification and replication limits in ordinary language. A polished dashboard should not conceal a weak linkage or an unresolved evidence gap behind an apparently definitive colour or score.
| Panel | Minimum displayed fields | Decision supported |
|---|---|---|
| Population and coverage | Registered, matured, admitted, missing and excluded counts | Understand which records a result describes |
| Forecast performance | Vintage, unit, score, reference and denominator | Interpret the comparison consistently |
| Sensitivity | Unknown cases, assumptions and metric-specific bounds | Assess dependence on unresolved outcomes |
| Evidence quality | Source class, assurance scope and reconciliation status | Identify additional verification required |
| Action and revision | Responsible owner, next step and version history | Track follow-up without overwriting original claims |
Authored interface proposal. No dashboard intervention or programme outcome has been empirically evaluated here.
22 Establish a prospective empirical study
A prospective extension should start with a specific question and a feasible data partnership. One possible study asks whether submitted funding probabilities are calibrated among a defined award cohort at a fixed horizon. Another asks how an original revenue forecast's error differs from a genuinely available historical reference. These questions need different records from a study of grant additionality. The protocol should identify its primary estimand, population, forecast functional, outcome standard and follow-up date before requesting a large dataset.
The first feasibility sample should test access to original applications, timestamped attachments, stable entity identifiers and matching outcomes. The four-record public inquiry in this paper shows the kinds of gaps to examine. It provides no estimate of how often a properly authorised data partnership could close them. A project should record who controls the data, which permissions permit linkage, how sensitive records are handled and which derived outputs can be published. Those conditions determine the scope of a reproducible study and may limit the proposed comparisons.
The protocol should then specify cohort entry and follow-up. Include funded and declined applications only where the research question, access and comparison design justify them. Retain withdrawals and ineligible records in a clearly defined flow rather than allowing their disappearance to change the denominator silently. Define horizon maturity, revision handling, missing outcomes, entity changes and disputed evidence. The proposed study can report the proportion of records admitted under its own rules, but should describe that proportion as a property of the selected dataset and access conditions.
Sample-size planning requires information beyond the twelve-case illustration. Desired precision, event frequency, variation in forecast losses, clustering, repeated measurements and planned subgroup comparisons all affect the design. The present example supplies no empirical inputs for that calculation. A researcher should use justified pilot evidence or a clearly stated planning range and keep assumptions visible. Pre-specification of primary analyses and separation of training from evaluation can reduce avoidable ambiguity, while uncertainty estimates must follow the actual sampling and dependence structure.
A study report should publish its data dictionary, admission rules, cohort-flow counts, score calculations and sensitivity procedures to the extent permitted. Independent verification can examine the linkage and recompute allowed outputs without making confidential applications public. The report should also explain changes from the registered protocol and distinguish exploratory findings from planned tests. If the study later assesses whether using the register changes funding decisions or outcomes, that is a further intervention question with its own comparison design. The current framework is a proposal for that evidence journey, with no claimed measured effect.
Scroll horizontally to read the figure at full size. You can also open the full-size figure.
Authored research architecture. A linked commercial outcome supports only the comparisons justified by its forecast and evidence definitions.
23 Apply the framework across technology and geography
The matching framework can be adapted to different technologies by defining the commercial and technical quantities precisely. For an AI software company, an application might forecast contracted deployment or recognised subscription revenue. Customer pilots, trial users and annualised run rates should retain their own definitions. A technical forecast could concern a performance threshold on a frozen dataset and operating environment. A later benchmark on different data does not automatically resolve that claim. These are proposed applications of the method, with no observed AI applicant outcomes supplied here.
For battery or industrial hardware development, the evidence pathway may connect a laboratory result, a qualification process, manufacturing readiness and customer orders. A forecast of commercial sales should identify which of those stages and financing conditions it assumes. Technical test results need their protocol, sample and environmental conditions. Revenue needs the accounting and entity boundary already described. A milestone can be commercially relevant without guaranteeing conversion into orders or cash. The register records the links management asserts so that later evidence can test the specific claim.
Water, electricity and other infrastructure technologies can require site access, an offtake arrangement, regulatory conditions and a longer deployment period. The relevant outcome might be commissioned capacity, contracted service revenue or performance under a specified operating regime. Those quantities should remain separate. A successful demonstration at one site cannot establish a national deployment total without the corresponding evidence. A prospective study should define the system boundary and whether the claim concerns a technology supplier, a project SPV or a broader customer portfolio.
Geographical comparisons require the same care with programme design, reporting access, currencies and company definitions. The EU, UK, US and Gulf materials reviewed here illustrate different sources and information boundaries. Hub71's published ecosystem aggregates offer context about its community, while the inspected pages supply no matched original applicant forecasts for this study. They therefore do not enter a cross-country accuracy table. A study wishing to compare regions would need a defensible sampling and harmonisation design, with clear disclosure of what is lost when definitions are made comparable. [13]
The transferable element is the record structure: preserve the original claim, define its conditions, collect the matching evidence and retain unresolved information. Each programme still needs its actual governing terms and each sector needs the appropriate technical and commercial expertise. This paper supplies no claim that one universal metric ranks every innovation fairly. A useful advisory engagement can begin with a narrow commercial decision and build the evidence path required for that decision, then expand only where the data and management purpose justify it.
| Setting | Claim to define | Evidence boundary |
|---|---|---|
| AI software | Recognised deployment revenue or a specified model test | Separate pilots, run rates and matched test conditions |
| Battery technology | Qualification milestone and commercial sales | Freeze technical protocol and assumed manufacturing stage |
| Water technology | Performance at defined sites and contracted revenue | Retain site, baseline and customer perimeter |
| Energy infrastructure | Commissioning or service-revenue milestone | Distinguish supplier, SPV and system outcomes |
| Cross-border portfolio | Comparable original forecasts and later measures | Harmonise currency, period, entity and programme definitions explicitly |
Authored use cases, not observed transactions, applicant studies or tested sector effects.
24 Set the limits and the next evidence decision
This paper's empirical evidence is a dated documentary review and a purposive public-disclosure feasibility inquiry. The four inspected project records yielded no admissible timestamp-authenticated application-forecast and independently verified commercial-outcome pair. That bounded result supports a feasibility conclusion for those records and access conditions. It does not establish the availability of confidential programme data, the prevalence of forecast errors or the commercial success of the projects. No real-world accuracy score is reported.
The twelve-case quantitative exercise is fully constructed. It demonstrates how to retain metric-specific denominators, compare submitted probabilities with fixed references, distinguish calibration from ranking and propagate unresolved observations through a sensitivity analysis. Its caps, probabilities and outcomes are assumptions. The calculated values cannot establish programme reporting rates, a causal grant effect, an optimal selection rule or the performance of a recalibration policy. Every summary and chart should retain the constructed example's assumptions and limits.
The immediate management decision is whether the necessary original forecasts and matching evidence can be assembled lawfully and consistently. An applicant can begin by preserving the submitted version and linking it to its current operating and financing plan. An evaluator can begin by defining the target population, outcome evidence and follow-up rules. A prospective researcher can test those requirements in an authorised feasibility sample. Each party should identify the unresolved item that prevents a particular comparison rather than replacing it with a convenient proxy.
A useful first deliverable is a claim register containing the exact forecast, its vintage, the defined outcome, conditions, evidence owner and next review date. The second is an admission and exclusion log that preserves why each pair can or cannot be scored. The third is a metric-specific results table with its denominator, reference and sensitivity assumptions. These are proposed work products that can be reviewed on their own completeness and traceability. Any claim that they improve award decisions, valuation or commercial outcomes requires further evidence.
The conclusion is a practical research discipline. Commercial promises become testable through an explicit chain from original prediction to admissible outcome, with the metric and timing preserved throughout. A numerical result should be published only for the comparisons that chain supports. Missing evidence remains visible, revisions retain their history and causal claims receive their own design. That structure provides a foundation for a substantive empirical study and a clearer financing discussion while respecting the limits of the information actually available.
| Checkpoint | Date or window observed | Action and limit |
|---|---|---|
| EIC 2026 full proposal batches | Last listed batch 4 November 2026 | Passed at 11 November review; recheck actual portal for any new call |
| NSF 26-510 | 4 March 2027 next listed date after 4 November 2026 | 5 pm submitting-organisation local time; invitation and phase conditions still apply |
| UKRI outcome reporting | 1 February to 11 March 2027, 4 pm UK time | Apply only to the reporting population and exemptions covered by the guidance |
| SBA announced standard | 15 November 2026 and publication on SBIR.gov | Record notice and implementation conditions; no already-effective determination here |
| Constructed forecast origin | Immediately before 1 January 2023 | Hypothetical registration instant, not a real submitted cohort |
| Constructed target horizons | End 2025 | All example outcomes/missing statuses stipulated; no authentic applications |
Selected dated documents [1,4,9,12], checked 11 November 2026. This table is not an application calendar or a promise that a route is currently open to a particular applicant.
References
- European Innovation Council. EIC 2026 work programme and second amendment, 17 June 2026. Accessed 11 November 2026. https://eic.ec.europa.eu/eic-funding-opportunities/eic-2026-work-programme_en
- European Commission. Horizon Europe Proposal Evaluation Standard Briefing, version 14.0, 15 April 2026. Accessed 11 November 2026. https://ec.europa.eu/info/funding-tenders/opportunities/docs/2021-2027/experts/standard-briefing-slides-for-experts_he_en.pdf
- UK Research and Innovation. What happens if you receive a funding offer. Innovate UK monitoring and exploitation guidance. Accessed 11 November 2026. https://www.ukri.org/councils/innovate-uk/guidance-for-applicants/general-guidance/what-happens-if-you-receive-a-funding-offer/
- UK Research and Innovation. Reporting your project's outcomes. Updated 28 July 2026; accessed 11 November 2026. https://www.ukri.org/manage-your-award/reporting-your-projects-outcomes/
- UK Research and Innovation. Research outcomes collection Principles of Use. Accessed 11 November 2026. https://www.ukri.org/wp-content/uploads/2020/12/UKRI-120424-Research-Outcomes-Collection-Principles-of-Use.pdf
- UK Research and Innovation. Smart Grants impact evaluation final report, 14 July 2026. Accessed 11 November 2026. https://www.ukri.org/publications/smart-grants-impact-evaluation-final-report/
- UK Research and Innovation. Smart Grant Impact Evaluation Report, July 2026. Accessed 11 November 2026. https://www.ukri.org/wp-content/uploads/2026/07/IUK-140726-SmartGrantImpactEvaluationReport.pdf
- UK Research and Innovation. Smart Grants impact evaluation technical annex, July 2026. Accessed 11 November 2026. https://www.ukri.org/wp-content/uploads/2026/07/IUK-140726-SmartGrantImpactEvaluationReport-TechnicalAnnex.pdf
- US National Science Foundation. NSF 26-510 SBIR/STTR Phase I, Phase II and Fast-Track solicitation. Current version accessed 11 November 2026. https://www.nsf.gov/funding/opportunities/small-business-innovation-research-small-business-technology/nsf26-510/solicitation
- US National Science Foundation. Proposal contents and preparation. Current linked instructions accessed 11 November 2026. https://seedfund.nsf.gov/solicitation-proposal/
- US Small Business Administration. Performance Benchmark Requirements, Commercialization Reporting section. Accessed 11 November 2026; benchmark-version qualification discussed in text. https://www.sbir.gov/performance-benchmarks
- US Small Business Administration. Updated Minimum Performance Standards for Commercialization, document 2026-17987, 2 September 2026. Accessed 11 November 2026; stated implementation conditions discussed in text. https://www.federalregister.gov/documents/2026/09/02/2026-17987/updated-minimum-performance-standards-for-commercialization-for-firms-that-receive-funding-through
- Hub71. Reports, including Impact Report 2025 listing dated 8 June 2026. Accessed 11 November 2026. https://www.hub71.com/reports
- Howell, Sabrina T. 2017. Financing Innovation: Evidence from R&D Grants. American Economic Review 107(4), 1136-1164. DOI 10.1257/aer.20150808. https://www.aeaweb.org/articles?id=10.1257/aer.20150808
- Gneiting, Tilmann. 2011. Making and Evaluating Point Forecasts. Journal of the American Statistical Association 106(494), 746-762. DOI 10.1198/jasa.2011.r10138. Author paper hosted by the Bundesbank. https://www.bundesbank.de/resource/blob/635562/7d3de0f3fc003e5b4864828143f268cf/mL/2012-06-01-eltville-11-gneiting-paper-data.pdf
- Gneiting, Tilmann, and Adrian E. Raftery. 2007. Strictly Proper Scoring Rules, Prediction, and Estimation. Journal of the American Statistical Association 102(477), 359-378. DOI 10.1198/016214506000001437. https://doi.org/10.1198/016214506000001437
- European Commission CORDIS. MODBRIDGE, grant 694217, periodic reporting and results. Accessed 11 November 2026. https://cordis.europa.eu/project/id/694217/reporting
- European Commission CORDIS. EKOMAP, grant 661864, periodic reporting and results. Accessed 11 November 2026. https://cordis.europa.eu/project/id/661864/reporting
- European Commission CORDIS. iLocator, grant 663463, periodic reporting and results. Accessed 11 November 2026. https://cordis.europa.eu/project/id/663463/reporting
- European Commission CORDIS. NexGenFSCM, grant 726825, periodic reporting and fact sheet. Accessed 11 November 2026. https://cordis.europa.eu/project/id/726825/reporting
- UK Research and Innovation. Guidance for applying to specific funds, Smart section. Accessed 11 November 2026. https://www.ukri.org/councils/innovate-uk/guidance-for-applicants/guidance-for-specific-funds/
About the Author
Chennakeshav (CK) is a corporate finance and investment banking executive with 25+ years of global experience in deal origination, structuring and execution across M&A, growth capital and corporate strategy. He has led value-creation mandates for founders, corporates and funds — bridging the boardroom view to hands-on execution and close.
His career spans Morgan Stanley, HSBC, Lloyds Banking Group, EWEC, ADQ portfolio companies and Emirates Growth Fund, across TMT, real estate, fintech, deeptech, cleantech, infrastructure and energy. He has partnered with C-suite leaders, private equity and venture funds, sovereign wealth funds and family offices to finance complex fund raises and scale-up ventures, and has led M&A due diligence, post-merger integration and business-transformation initiatives to create value.
At Matchpoint Partners he is Managing Partner, leading the firm's corporate finance, M&A and capital-raising practice. He holds an MBA from London Business School, an engineering degree from VTU and a Master of Laws (LLM, in progress) from UCL London.
An active start-up mentor, CK mentors at Techstars, DIFC FinTech Hive, Startup Grind, Founder Institute and IN5, serves as Entrepreneur Mentor in Residence (EMiR) at London Business School, and judges the Entrepreneurship World Cup.
https://www.linkedin.com/in/ckadya/
https://www.matchpoint-partners.com/team/ck-adya.html
Disclaimer
This paper is part of a continuing series on the structure of private and alternative markets. The views expressed are the author's own. The paper is for information only, describes market structure in general terms, and does not constitute investment, legal, tax or regulatory advice or a recommendation in respect of any security, vehicle or counterparty.
