

1 Frame the review around a defined integration-cash decision
After the first full year of an acquisition, a board may need to assess delivery, revise the integration plan or evaluate further expenditure. Reported profit, cash, a synergy tracker and market returns each describe aspects of the combined business. Their usefulness depends on the particular decision, the measurement boundary and the information available. A review becomes more interpretable when those definitions are agreed before the reported outcomes are compared.
This paper defines a realised integration-cash estimand relative to a stated no-integration counterfactual. It examines the accounting and benchmark differences that affect alternative measures, using a constructed model whose integration effects are specified by the author. Selected academic studies provide context for cash-based performance measurement and matching [9, 10]. The paper's contribution is a source-grounded measurement framework with reproducible conditional tests and proposed operational templates.
The empirical study described in the research question requires acquisition records and consenting counterparties that were unavailable. No transaction cohort, client outcome, market demand estimate or regional performance advantage is inferred from the constructed experiment. The operational sections specify the records and approval process that a participating acquirer could use in a subsequent study. Decisions affecting earn-outs, bonuses or financing documents remain subject to their actual terms and relevant advice.
2 Define the cash estimand, currency boundary and observation window
For deal i, the defined estimand V_i is incremental integration cash, net of specified implementation cash costs, discounted to the completion date over event years a through b. C_it denotes operating cash before the separately recorded integration cash cost K_it, and C0_it denotes its no-integration counterfactual under the same cash definition. Both are measured for the same business perimeter, period and currency. This reduced-form scientific model excludes tax, capital expenditure, financing flows and changes in the reporting perimeter. Its operating-cash proxy is consequently narrower than an enterprise free-cash-flow valuation.
In equations 1a and 1b, t is the event year after completion, a and b define the observation window and d is the stated annual discount rate. Delta_it is C_it less C0_it. The separate K_it deduction applies because C_it has been defined before that integration cost. If an operational cash series already includes those payments, its reconciliation must remove the second deduction. Opening scale A0_i is held fixed when the experiment expresses these currency amounts as fractions of the pre-deal asset base.
The counterfactual is unobserved for an actual acquisition and specified explicitly in the constructed experiment. A years-two-and-three window and a years-one-to-three window define different outcomes. Comparing their rankings reveals how the constructed outcome and measurement process behave across windows. It supplies no general instruction to discard the first year's costs or performance. The complete transaction-to-date ledger remains visible alongside any later-window analysis.
3 Set the cash boundary before describing a benefit as realised
The following operational design is proposed for a transaction team that can obtain its own records and approvals. Its first deliverable is a measurement charter. The charter names the acquired perimeter, the integration actions under review, the currency, the completion date, the valuation date and the cash-flow definition. It records whether the analysis covers the acquired business alone, the combined business or named workstreams across both. A benefit transferred between two entities inside that perimeter contributes zero to the combined result unless an external receipt or avoided external payment also changes.
An acquisition can create useful value for a customer, employee or shareholder before the buyer receives cash. The realised-cash ledger deliberately measures a narrower outcome. It records the external receipts and payments inside the chosen boundary during the stated window. The team maintains separate columns for contracted future savings, annualised run rates, booked accounting income, actual cash and estimated incremental cash against the counterfactual. These columns describe different measurement objects. Approval of a procurement contract establishes a commitment; the subsequent invoice and payment establish the amount and timing that enter the cash calculation.
A consistent cash bridge starts with the reported operating result for the same perimeter and period. The finance owner identifies non-cash accounting adjustments, operating working-capital movements, integration cash payments, maintenance and integration capital expenditure, and taxes when taxes are included in the agreed definition. The direction of every adjustment is specified. An integration payment already included in the starting cash figure receives no second deduction. A capitalised integration asset can create a cash payment even when its expense appears over later periods. A ledger that captures only the expense misses that timing.
Financing flows receive their own reconciliation. Drawing acquisition debt changes bank cash and the capital structure; it supplies no operating integration benefit. Refinancing proceeds and repayment of debt principal belong in the financing schedule. Interest savings can be analysed in a separate capital-structure workstream with its own counterfactual, costs and tax assumptions. Combining an unlevered operating measure with equity cash after financing requires an explicit bridge. The same boundary applies to sale proceeds, cash acquired at completion, purchase consideration and dividends paid between consolidated entities.
The board receives the charter with each scorecard and a list of changes since the previous version. If customer operations migrate into a shared platform, finance maintains a mapping from the old customer and cost-centre identifiers to their successors. When the mapping is incomplete, the affected benefit remains unallocated in the incremental-cash analysis. A separately displayed unallocated amount keeps the reconciliation auditable. Its existence is a data limitation to resolve through records and ownership decisions.
| Entry | Treatment in the proposed measurement charter | Required reconciliation |
|---|---|---|
| Integration invoice paid | Deduct once in the stated cash window | Invoice, payment, ledger posting and workstream ID |
| New debt drawdown | Finance schedule; excluded from operating integration benefit | Debt movement to bank movement |
| Transfer between combined entities | Zero combined external benefit | Both sides eliminated within the stated perimeter |
| Acquired cash and purchase consideration | Transaction-value bridge; separate from operating delivery | Completion funds flow and closing balance sheet |
| Capitalised integration investment | Cash outflow when paid; expense reconciliation separate | Capital register, supplier payment and depreciation bridge |
| Future contracted saving | Forecast column until the relevant external payment changes | Contract terms, baseline and paid invoice |
Proposed operational template. These are measurement design choices; contractual, tax and reporting classifications require transaction-specific review.
4 Identify acquisition-accounting adjustments in a separate reconciliation
AASB 3's acquisition method generally uses acquisition-date fair values for identifiable assets and liabilities, subject to specified exceptions. It requires acquisition-related costs to be expensed apart from debt and equity issuance costs treated under other standards. Subsequent accounting for contingent consideration depends on its classification and the nature of the change [1]. Those requirements create accounting entries that require a separate reconciliation when a review asks about integration cash. The goodwill calculation also incorporates non-controlling interests and previously held interests where applicable [1]. A simplified wholly owned, single-step example must identify that scope explicitly.
The proposed reconciliation identifies the original recognition, subsequent expense or remeasurement, external cash date and relevant counterparty for each material item. Amortisation of an acquired intangible and cash paid to implement a system have different timing. An earn-out liability can be remeasured before settlement. Finance records each item under the applicable framework, while the measurement register distinguishes its accounting effect from the incremental operating-cash estimate.
Table 2 summarises the model's selected accounting channels. Their sizes and durations are constructed assumptions. Other material items, including tax, foreign exchange, leases and non-controlling interests, require separate treatment when the operational charter includes them. The model's charge schedule is a reduced-form experiment whose limited accounting boundary is explicitly stated.
| Item | Standards-governed treatment within cited scope | Potential profit effect | Authored experiment convention |
|---|---|---|---|
| Acquisition-related costs [1] | Expense when incurred and services received; debt/equity issuance costs follow their applicable standards | Expense reduces profit when recognised | Worked acquisition cost is placed at closing; excluded from the years-1-to-3 integration target |
| Fair-value step-up of identified assets [1] | Acquisition-date recognition/measurement has specified exceptions; applicable finite-life/depreciable assets generate later charges | Applicable amortisation/depreciation reduces profit | Finite-life intangible and PPE uplifts; eight- and ten-year lives |
| Acquired inventory [1, 9] | Acquisition-date measurement affects cost of sales as inventory is sold | A positive step-up raises cost of sales when sold | Entire positive step-up is expensed in year one |
| Acquired contract assets/liabilities [1, 8] | General IFRS 3 principle has scoped exceptions; US Topic 606 acquired contracts follow its specified recognition/measurement exception | Post-combination revenue effect follows the applicable framework and performance obligations | Illustrative positive deferred-revenue haircut placed entirely in year one |
| Contingent consideration [1] | Distinguish acquisition-date measurement, equity classification, non-equity subsequent events and separate service payments; equity is not remeasured, applicable non-equity changes follow subsequent-measurement rules | Upward liability remeasurement reduces profit; reversals and valuation/payoff terms affect sign | Changes in expected liability payout from an authored cumulative-return signal; no settlement cash or subsequent-service payment is simulated |
| Provisional acquisition-date amounts [1] | New information about acquisition-date facts for incomplete items; period ends when information is obtained or no longer obtainable, capped at one year | Qualifying retrospective adjustments revise acquisition-date amounts/comparatives | No provisional-measurement revision process is simulated; other later accounting changes remain possible |
| Goodwill [1, 2] | Complete residual within applicable scope; no amortisation; mandatory annual and indicator-based impairment testing; goodwill impairment is not reversed | Recognised impairment reduces profit | Separate synthetic status flag with authored 12%/4% latent-value-dependent rates; it does not model or permit discretionary delay of mandatory testing |
Compiled from the accounting texts cited in the first column. Direction describes the effect on reported profit relative to the cash flow of the acquired business. The timing of each item depends on the facts of the transaction. Standard-governed timing and requirements are separate from model timing, sign and magnitude. All included charges are placed in the authored operating-profit proxy; actual profit-line classification follows applicable requirements. Contractual payment obligations remain unchanged.
The accounting bridge supports interpretation of the actual reported measure. It also exposes which adjustments management has chosen to remove in an alternative performance measure. A reviewer can inspect the same underlying entries under both definitions. Their difference becomes a traceable reconciliation whose classification and contractual relevance can be assessed by the appropriate specialists. Payments dependent on post-combination employee service require their own classification assessment. A model's placement of a remeasurement inside an operating-profit proxy is an analytical convention requiring separate comparison with the entity's actual presentation.
5 Track provisional acquisition-date amounts and later changes individually
Under AASB 3, the measurement period concerns provisional acquisition accounting and new information about facts existing at acquisition. It ends when the relevant information is obtained or becomes unobtainable, with a maximum of one year from acquisition. The specified retrospective adjustments also affect related comparative information [1]. A transaction can contain completed accounting items and provisional items at the same review date.
The proposed review maintains an item-level log: the provisional amount, the acquisition-date fact under investigation, the information received, the date the measurement period ended for that item, the resulting adjustment and the comparative periods affected. Later estimates, errors and other reporting changes retain their own classifications under the applicable requirements. The acquisition's anniversary alone supplies no universal certification that the whole accounting base has become fixed.
For performance analysis, the team preserves the originally reported series and the consistently restated series with a bridge between them. A cash observation keeps its actual receipt or payment date. An accounting restatement can change the reported comparison without creating a new cash receipt. An analytical review can therefore examine a stable cash window while retaining the accounting history needed to interpret reported profit. The relevant year-one observations remain in the transaction-to-date record.
6 Interpret goodwill impairment within its reporting unit and timing
The reviewed AASB 136 allocates acquired goodwill to cash-generating units or groups expected to benefit, with a cap at the operating segment before aggregation. It requires annual and indicator-based tests. A loss follows the specified comparison of carrying amount and recoverable amount; recoverable amount is the higher of value in use and fair value less disposal costs. Recognised goodwill impairment cannot subsequently be reversed [2].
Li and Sloan studied the move in the United States from amortisation to impairment-only accounting. Their abstract reports inflated goodwill balances and untimely impairments after the change, and reports that investors do not fully anticipate the delay [12]. The study concerns United States standards and was read at abstract level only, so the paper uses it for one proposition: an impairment-only regime can produce write-downs that lag the underlying deterioration. The IASB project on business combinations includes targeted changes to how goodwill is allocated to units in order to reduce shielding [3].
The model includes an impairment indicator with constructed observation probabilities for negative and positive integration outcomes. Its low ranking follows those inputs. A real impairment decision can reflect the unit's broader operating outlook, discounting and reporting boundary. The experiment supplies no validated impairment-detection rate. A board can retain impairment information in its reporting review while examining the separately defined integration-cash estimate and its evidence.
7 Follow the current acquisition-performance disclosure consultation
The reviewed November 2026 IFRS Foundation staff paper for the Capital Markets Advisory Committee compares management-based and specified-metric approaches to subsequent acquisition-performance information. It discusses the reporting level, purchase-price-allocation effects and comparable trend information, and anticipates further recommendations in the first quarter of 2027 [15]. It expressly disclaims representing IASB views or decisions. Earlier September staff papers provide the historical discussion [3, 4].
This current consultation overlaps directly with the comparability problem considered here. It establishes an active policy discussion in the reviewed material; it supplies no final new disclosure requirement. The paper keeps mandatory requirements, proposals and its own measurement recommendations separately identified. The project page remains the place to check subsequent official developments [5]. Existing AASB 3 requirements include specified continuing disclosures, adjustment information and the relevant conditions and entity exemptions [1]. The analytical gap examined here concerns attribution of integration value.
The proposed operational response is to preserve a reconciled series at the lowest feasible consistent business boundary, with documented changes in measure and perimeter. Preparing that record supports internal analysis and a review of future reporting requirements. It confers no assurance that a particular future standard will require the same scope or that the record alone will satisfy it.
8 Assess public performance measures and framework differences within their scope
AASB 18's management-defined performance-measure definition concerns qualifying subtotals of income and expenses used in public communications to convey management's view of the financial performance of the entity as a whole. Specified subtotals are excluded. Cash-flow and liquidity measures, ratios and nonfinancial measures are outside that definition, while a qualifying income-and-expense component of a ratio can still be an MPM [6]. An internal board-only tracker lacks the public-use criterion on that fact pattern.
Where a subtotal meets the applicable management-defined performance-measure definition, AASB 18 specifies disclosures including a reconciliation and relevant tax and non-controlling-interest effects [6]. IFRS 18's stated effective date is annual periods beginning on or after 1 January 2027, with earlier application permitted [7]. Entity-specific adoption and classification require confirmation. The proposed cash register retains a bridge for each alternative measure used in the review.
FASB Accounting Standards Update 2021-08 communicates amendments requiring acquired Topic 606 contract assets and liabilities to follow that topic as though originated by the acquirer, with specified expedients. The general public-entity fiscal-year adoption date is after 15 December 2022; the document includes other-entity and early-application provisions [8]. The current Codification itself was not inspected. This is a scoped framework comparison. A one-year revenue effect in the scientific experiment is an authored timing assumption.
9 Position the analysis beside the selected performance-measurement literature
Healy, Palepu and Ruback studied the 50 largest mergers between United States public industrial firms completed from 1979 to 1983. They measured pre-tax operating cash flow, defined as sales less cost of goods sold and selling and administrative expenses plus depreciation and goodwill expenses, deflated by the market value of assets, because that measure is unaffected by the accounting method and by the financing of the merger [9]. They removed the announcement revaluation from the asset base, since otherwise a market-capitalised improvement would leave the measured return unchanged. The version read is the 1990 NBER working paper; the article was published in 1992 and its figures may differ.
The working paper's industry-adjusted comparison illustrates why the benchmark matters: its paired median improvement is 2.2 percentage points. The authors also discuss a market-adjusted comparison [9]. The retained working-paper version contains differing raw post-merger median figures between its body and a table, so this paper omits that disputed headline. The selected historical United States sample and its operating-cash proxy limit transfer to private acquisitions, other reporting frameworks and contemporary integration programmes.
Barber and Lyon examine specification and power for accounting operating-performance tests and the consequences of unusual pre-event performance [10]. Their analysis informs the choice to examine performance matching and benchmark sensitivity. The selected long-run stock-return study addresses another measurement problem [11]. These works provide prior art for the categories used here. They do not establish a universal deal-level ranking, a minimum acquisition sample size or the empirical performance of this constructed model.
10 State what each candidate measure counts
The experiment compares selected proxy definitions alongside oracle-adjusted and random-order references. Reported operating-profit change, its ratio to consideration, a constructed adjusted-EBITDA measure and a gross synergy tracker apply different accounting or management adjustments. Three cash proxies use an unchanged pre-deal baseline, a sector benchmark or five performance-matched controls. Constructed share-return proxies and an impairment indicator complete the comparison. These are defined analytical categories; their numerical implementations are model assumptions.
Table 3 records the selected analytical proxy definitions and their exposures. Each proxy uses the constructed data-generating process. The management tracker records noisy gross actions and a stipulated share of favourable cash changes. The impairment indicator has assumed detection probabilities. The market-related scores are synthetic proxies, not an estimated asset-pricing model or observed shareholder returns. The implementation and its labels state these assumptions explicitly.
| Measure | Built from | Main exposure |
|---|---|---|
| Reported operating profit change | Profit after less profit before completion | Accounting items, earn-out charge, market |
| Reported return on price paid | That change divided by consideration | Price paid, accounting items, market |
| Management adjusted EBITDA change | Cash earnings plus add-backs and pipeline credit | Management optimism, plan size |
| Synergy tracker | Delivered actions as a share of plan | Recording error, omitted cost, attribution |
| Cash change, unadjusted | Operating cash after integration cost less pre-deal level | Market, mean reversion |
| Cash change, sector-index-adjusted | Previous cash proxy less the model-known sector/calendar change | Mean reversion, benchmark choice |
| Cash change, matched controls | Previous measure less change of five matched firms | Matching quality, control noise |
| Synthetic market proxies, raw and adjusted | Constructed scores using market and cash components | Expectations, noise, market |
| Goodwill impairment flag | Constructed indicator with stated detection probabilities | Assumed observation process; no standards-calibrated detection rate |
Author-defined model proxies. Definitions identify this experiment's calculations and imply no universal firm practice, accounting compliance or observed performance.
The categories are justified by the sources above: accounting items by the standards [1, 2], management measures by the performance-measure rules [6], and benchmark choices by the empirical studies [9, 10]. The sources do not rank them. The ranking in the experiment depends on authored inputs, which the next section states in full so that a reader can replace them.
11 Construct a transparent acquisition experiment with named omissions
The experiment simulates a cohort of 60 acquisitions 500 times. Each deal has a pre-deal cash flow return on its asset base, a sector, a closing year and a pre-deal level that may be unusually strong. Cash flows follow a persistent abnormal component, a market component common to the calendar year and the sector, and noise. The integration adds a true synergy cash flow that ramps over three years and costs cash to deliver. Purchase accounting items, a management tracker, share returns and an impairment flag are generated from the same drivers. The input register in Table 4 lists every authored value.
| Assumption | Definition and unit | Value | Status |
|---|---|---|---|
| Normalised annual cash-flow scale | Cash flow divided by the fixed pre-deal asset base per year; distinct from the noisy observed baseline | 0.12 | Authored |
| Annual abnormal-performance persistence | Dimensionless autoregressive coefficient | 0.6 | Authored |
| Abnormal-performance innovation standard deviation | Annual cash-flow-return fraction of the pre-deal asset base | 0.006 | Authored |
| Transitory measurement-noise standard deviation | Annual cash-flow-return fraction of the pre-deal asset base | 0.006 | Authored |
| Common calendar-shock standard deviation | Annual cash-flow-return fraction of the pre-deal asset base | 0.01 | Authored |
| Sector calendar-shock standard deviation | Annual cash-flow-return fraction of the pre-deal asset base | 0.015 | Authored |
| Market-exposure loading standard deviation | Dimensionless loading around one | 0.25 | Authored |
| Initial abnormal-performance mean component | Cash-flow-return fraction at event year zero before the zero-year innovation | 0.006 | Authored |
| Initial abnormal-performance standard-deviation component | Cash-flow-return fraction contributed by the initial draw at event year zero; total variation also includes its innovation | 0.012 | Authored |
| Full-run-rate synergy-share mean | Synergy cash flow divided by the normalised annual cash-flow scale | 0.1 | Authored |
| Full-run-rate synergy-share standard deviation | Fraction of the normalised annual cash-flow scale; negative draws remain possible | 0.09 | Authored |
| Annual synergy-plan share mean | Plan cash flow divided by the normalised annual cash-flow scale | 0.1 | Authored |
| Synergy-plan log-standard deviation | Standard deviation on the natural-log scale; plan level is lognormal | 0.35 | Authored |
| Total integration-cost intercept | Years of the normalised annual cash-flow scale | 0.12 | Authored |
| Integration cost loading on synergy share | Years of normalised annual cash flow per unit synergy share | 0.6 | Authored |
| Integration-cost noise standard deviation | Years of the normalised annual cash-flow scale before the stated floor | 0.05 | Authored |
| Lower pre-premium purchase-price-base fraction | Price base divided by pre-deal assets; paid price then includes the premium | 0.15 | Authored |
| Upper pre-premium purchase-price-base fraction | Price base divided by pre-deal assets; paid price then includes the premium | 0.45 | Authored |
| Premium Gaussian location | Fraction of the pre-premium price base before the stated floor | 0.3 | Authored |
| Premium Gaussian standard deviation | Fraction of the pre-premium price base before the stated floor | 0.1 | Authored |
| Lower identified-intangible fraction | Recognised finite-life intangible amount divided by paid price | 0.2 | Authored |
| Upper identified-intangible fraction | Recognised finite-life intangible amount divided by paid price | 0.4 | Authored |
| Identified-intangible life | Years; straight-line amortisation convention | 8 | Authored |
| Lower property/equipment step-up fraction | Positive step-up divided by paid price | 0.02 | Authored |
| Upper property/equipment step-up fraction | Positive step-up divided by paid price | 0.06 | Authored |
| Property/equipment step-up life | Years; straight-line depreciation convention | 10 | Authored |
| Lower inventory step-up fraction | Positive acquired-inventory uplift divided by paid price | 0.01 | Authored |
| Upper inventory step-up fraction | Positive acquired-inventory uplift divided by paid price | 0.03 | Authored |
| Lower contract-liability charge fraction | Authored deferred-revenue haircut divided by paid price | 0.005 | Authored |
| Upper contract-liability charge fraction | Authored deferred-revenue haircut divided by paid price | 0.02 | Authored |
| Worked acquisition-expense fraction | Expense divided by paid price; closing-only worked example, excluded from the subsequent integration target | 0.02 | Authored |
| Maximum contingent-payout fraction | Maximum model liability payout divided by paid price | 0.1 | Authored |
| Contingent-payout valuation-signal scale | Cumulative cash-flow-return fraction of assets in the standard-normal probability mapping | 0.03 | Authored |
| Signed plan-difference credit weight | Dimensionless fraction of plan minus actual synergy, which can have either sign | 0.5 | Authored |
| Positive cash-change attribution weight | Dimensionless fraction of positive observed cash-flow change credited by the tracker | 0.3 | Authored |
| Tracker recording-noise standard deviation | Annual cash-flow-return fraction of pre-deal assets before positive truncation | 0.008 | Authored |
| Lower recorded-synergy share | Dimensionless share of annual synergy before noise and positive truncation | 0.4 | Authored |
| Upper recorded-synergy share | Dimensionless share of annual synergy before noise and positive truncation | 0.8 | Authored |
| Synthetic market-component loading | Valuation-score units per unit market cash-flow-return component; not measured shareholder return | 8.0 | Authored |
| Synthetic integration-component loading | Valuation-score units per unit conditional integration-plus-noise return | 4.0 | Authored |
| Synthetic valuation-score noise standard deviation | Dimensionless valuation-score units; no observed market calibration | 0.2 | Authored |
| Flag probability for negative latent value | Bernoulli probability conditional on a negative full-period discounted integration return | 0.12 | Authored |
| Flag probability for nonnegative latent value | Bernoulli probability conditional on a nonnegative full-period discounted integration return | 0.04 | Authored |
| Annual discount rate | Fraction per year from event year zero; no terminal value | 0.1 | Authored |
| Annual synergy ramp | Fractions of full run-rate synergy in years one, two and three | [0.25, 0.6, 1.0] | Authored |
| Annual integration-cost allocation | Fractions of total integration cost paid in years one, two and three | [0.6, 0.4, 0.0] | Authored |
| Heavy purchase accounting: Lower identified-intangible fraction | Recognised finite-life intangible amount divided by paid price | 0.45 | Authored case override |
| Heavy purchase accounting: Upper identified-intangible fraction | Recognised finite-life intangible amount divided by paid price | 0.65 | Authored case override |
| Heavy purchase accounting: Premium Gaussian location | Fraction of the pre-premium price base before the stated floor | 0.5 | Authored case override |
| Heavy purchase accounting: Maximum contingent-payout fraction | Maximum model liability payout divided by paid price | 0.2 | Authored case override |
| Heavy purchase accounting: Lower inventory step-up fraction | Positive acquired-inventory uplift divided by paid price | 0.02 | Authored case override |
| Heavy purchase accounting: Upper inventory step-up fraction | Positive acquired-inventory uplift divided by paid price | 0.06 | Authored case override |
| Heavy purchase accounting: Lower contract-liability charge fraction | Authored deferred-revenue haircut divided by paid price | 0.01 | Authored case override |
| Heavy purchase accounting: Upper contract-liability charge fraction | Authored deferred-revenue haircut divided by paid price | 0.04 | Authored case override |
| Market swing: Common calendar-shock standard deviation | Annual cash-flow-return fraction of the pre-deal asset base | 0.03 | Authored case override |
| Market swing: Sector calendar-shock standard deviation | Annual cash-flow-return fraction of the pre-deal asset base | 0.04 | Authored case override |
| Optimistic reporting: Signed plan-difference credit weight | Dimensionless fraction of plan minus actual synergy, which can have either sign | 0.8 | Authored case override |
| Optimistic reporting: Positive cash-change attribution weight | Dimensionless fraction of positive observed cash-flow change credited by the tracker | 0.6 | Authored case override |
| Strong initial performance, faster reversion: Initial abnormal-performance mean component | Cash-flow-return fraction at event year zero before the zero-year innovation | 0.02 | Authored case override |
| Strong initial performance, faster reversion: Initial abnormal-performance standard-deviation component | Cash-flow-return fraction contributed by the initial draw at event year zero; total variation also includes its innovation | 0.025 | Authored case override |
| Strong initial performance, faster reversion: Annual abnormal-performance persistence | Dimensionless autoregressive coefficient | 0.4 | Authored case override |
| Asset scale | USD million; lognormal median and natural-log standard deviation | 500; 0.6 | Authored |
| Calendar and sector support | Calendar years minus one through five; five sectors; three acquisition vintages | 7; 5; 3 | Authored |
| Control support | Exactly twenty controls in each sector/vintage cell; five closest pre-period scores | 300 total; 20 per cell; 5 selected | Authored |
| Integration-cost floor | Years of the normalised annual cash-flow scale | 0.03 | Authored |
| Premium floor | Fraction of the pre-premium price base | 0.05 | Authored |
| Observation mechanism | Logistic index: intercept plus standardised latent undiscounted value plus standardised log assets | Intercept 1.0; value loading 1.0; size loading 0.4 | Authored |
| Synthetic early-signal loadings | Loadings on standardised latent value; residual coefficient is square root of one minus loading squared | 0.3; 0.5; 0.7 | Authored |
| Full scenario and cost experiments | Generated cohorts per case/loading sharing primitive draws within each panel | 60 deals; 500 scenario replications; 300 cost replications | Authored |
| Observation-window experiment | Years one, one to two, one to three and two to three from the same three-year state | 60 deals; 300 replications | Authored |
| Cohort-size experiment | Nested acquirer prefixes with the same supported control population | 15, 30, 60, 120, 240 deals; 400 replications | Authored |
| Selection experiment | Latent completed populations; all seven full/observed/weighted rows | 120 deals; 400 replications | Authored |
| Random-number seed | Separate panel and channel identifiers are in the reproduction registry | 20261014 | Authored |
| Combined scenario | All four individual scenario overrides above applied jointly | Heavy accounting; market swing; optimistic reporting; stronger initial performance/faster reversion | Authored |
| Worked other identifiable net assets | USD million; simplified single-step, wholly-owned allocation | 0 | Authored |
MatchPoint analysis. Every value is an authored model input; none is an observed rate or a market convention. All fractions retain their stated denominator. The normalised cash scale, asset base and paid price are distinct. No empirical calibration is claimed.
Several features of real integrations are deliberately absent. The model has no tax, no foreign exchange translation, no change of control of the reporting perimeter, no spillover of integration effects to the acquirer's legacy business and no correlation between deal quality and acquirer capability. Each would change the levels and some would change the ranking. Their absence keeps the experiment readable. A transaction team that wishes to test a measure on its own deals should add the features that matter to its structure, and should state each as an input in the same way.
The relationship between the target and the proxies is specified by the same constructed data-generating process. The experiment therefore examines sensitivity within that process. The inputs are uncalibrated modelling assumptions. A favourable correlation demonstrates conditional behaviour in the experiment; external validity requires evidence on actual acquisitions. A single numerical ranking cannot settle the choice of a measure across industries, reporting frameworks and transaction structures.
12 Reconcile a hypothetical acquisition's cash and accounting paths
The deterministic worked example uses a combined pre-deal asset base of USD 500 million and a pre-deal operating-cash proxy of USD 60 million. The hypothetical consideration is USD 195.0 million; the original model assigns USD 58.5 million to newly identified intangibles. This is a simplified constructed case, with the detailed acquisition-accounting boundary and omitted balance-sheet items stated in its assumptions. Its purpose is to reconcile model cash and accounting differences. It supplies no valuation or purchase-price-allocation conclusion for a real acquisition. The simplified goodwill residual assumes zero other pre-existing identifiable net assets and no non-controlling or previously held interest. It omits deferred tax and other balance-sheet items; its residual is not a complete real-deal purchase-price allocation.
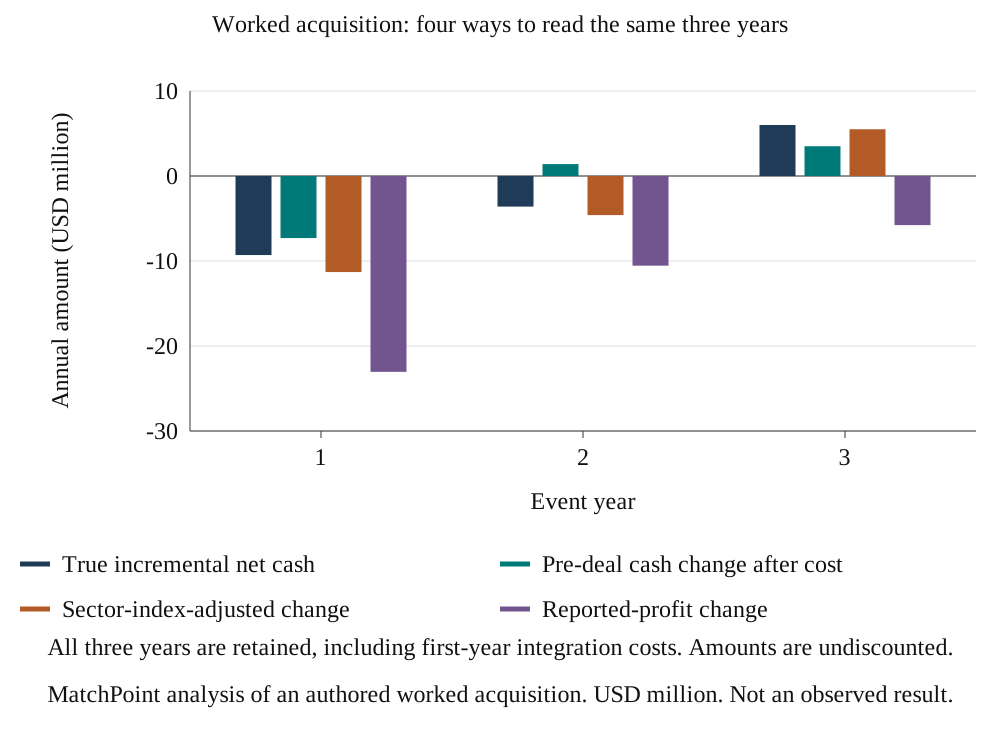
Table 5 sets out the ledger year by year. The first row is the counterfactual cash flow and the fourth is the true incremental cash. The remaining rows show how the unadjusted cash change and the reported profit change are built up from it, so that every difference between them can be named.
| USD million | Close | Year 1 | Year 2 | Year 3 |
|---|---|---|---|---|
| Counterfactual cash flow, no integration | 60.0 | 62.0 | 65.0 | 57.5 |
| Synergy cash flow | 0.0 | 1.5 | 3.6 | 6.0 |
| Integration cash cost | 0.0 | -10.8 | -7.2 | 0.0 |
| True incremental net cash | 0.0 | -9.3 | -3.6 | 6.0 |
| Market and reversion component | 0.0 | 2.0 | 5.0 | -2.5 |
| Cash change after integration cost | 0.0 | -7.3 | 1.4 | 3.5 |
| Amortisation and step-up depreciation | 0.0 | -8.1 | -8.1 | -8.1 |
| Inventory and contract-liability authored charges | 0.0 | -5.8 | 0.0 | 0.0 |
| Earnout liability remeasurement | 0.0 | -1.8 | -3.9 | -1.2 |
| Acquisition expense | -3.9 | 0.0 | 0.0 | 0.0 |
| Reported operating-profit change | -3.9 | -23.0 | -10.6 | -5.8 |
MatchPoint analysis of an authored worked acquisition. USD million. Rounded display. Years follow completion; the first column shows closing-year acquisition costs.
In equations 2a and 2b, the reported operating-profit-change proxy applies to event years one through three. C_i0 is the pre-deal operating-cash proxy, K_it is the separately recorded integration cost and A_it is the model's accounting-charge sum. Am denotes amortisation, Dp depreciation of an asset uplift, Inv inventory expense, Dr the contract-liability revenue effect and Eo an earn-out liability remeasurement. The first-year placement of inventory and contract-liability effects is an authored convention; no actual reporting classification or contractual cash settlement is inferred. The closing-period acquisition expense is separately visible in the ledger and excluded from this integration target.
The worked example's undiscounted three-year net integration cash is USD -6.9 million. Its unadjusted cash change is USD -2.4 million, its sector-index-adjusted cash change is USD -10.4 million and its operating-profit-change proxy is USD -39.4 million. Those figures are decomposed in the worked ledger and Figure 1. The corresponding discounted integration amount is separately recorded in the numerical supplement. All are constructed amounts under the stated boundary.
Scroll horizontally to read the figure at full size. You can also open the full-size figure.
MatchPoint analysis of an authored worked acquisition. USD million. Not an observed result.
The industry-adjusted figure is closer to the true value than the unadjusted figure over three years in this case, but it is still short by the fading of the unusually strong pre-deal level, which the sector benchmark does not remove and the matched-control adjustment is designed to remove. The case is authored to show that each adjustment repairs one distortion and leaves another; it is not evidence about the frequency of either.
13 Express benchmark adjustments in consistent units
The benchmark experiment uses an unchanged pre-deal level, a model-known sector/calendar systematic index and five performance-matched controls. The systematic index is a synthetic reference with information specified by the model; it is not an observed industry median. The matched comparator uses only pre-period performance within the same sector and completion vintage. Its fixed candidate-control design and the reuse of controls across deals are disclosed in the method register. The selected literature motivates examining prior-performance matching [10].
In equations 3a and 3b, w_t is the stated discount factor, A_i0 is the fixed pre-deal asset base and y is a cash-flow proxy expressed as a fraction of its own opening asset base. Both measures are consequently dimensionless fractions of opening assets. Multiplying a measure by A_i0 converts it to the corresponding currency estimate. The counterfactual subtraction and the observed deal change use identical dates, windows and discount factors. The model's matching rule, candidate pool and any benchmark information unavailable in practice must be disclosed explicitly. Here b_kt is the specified sector benchmark in return units, and j(i) identifies the jth control selected for deal i. This indexed notation preserves the matching operation without embedding a separate set-membership test in the displayed sum.
14 Compare ranking statistics within the constructed base case
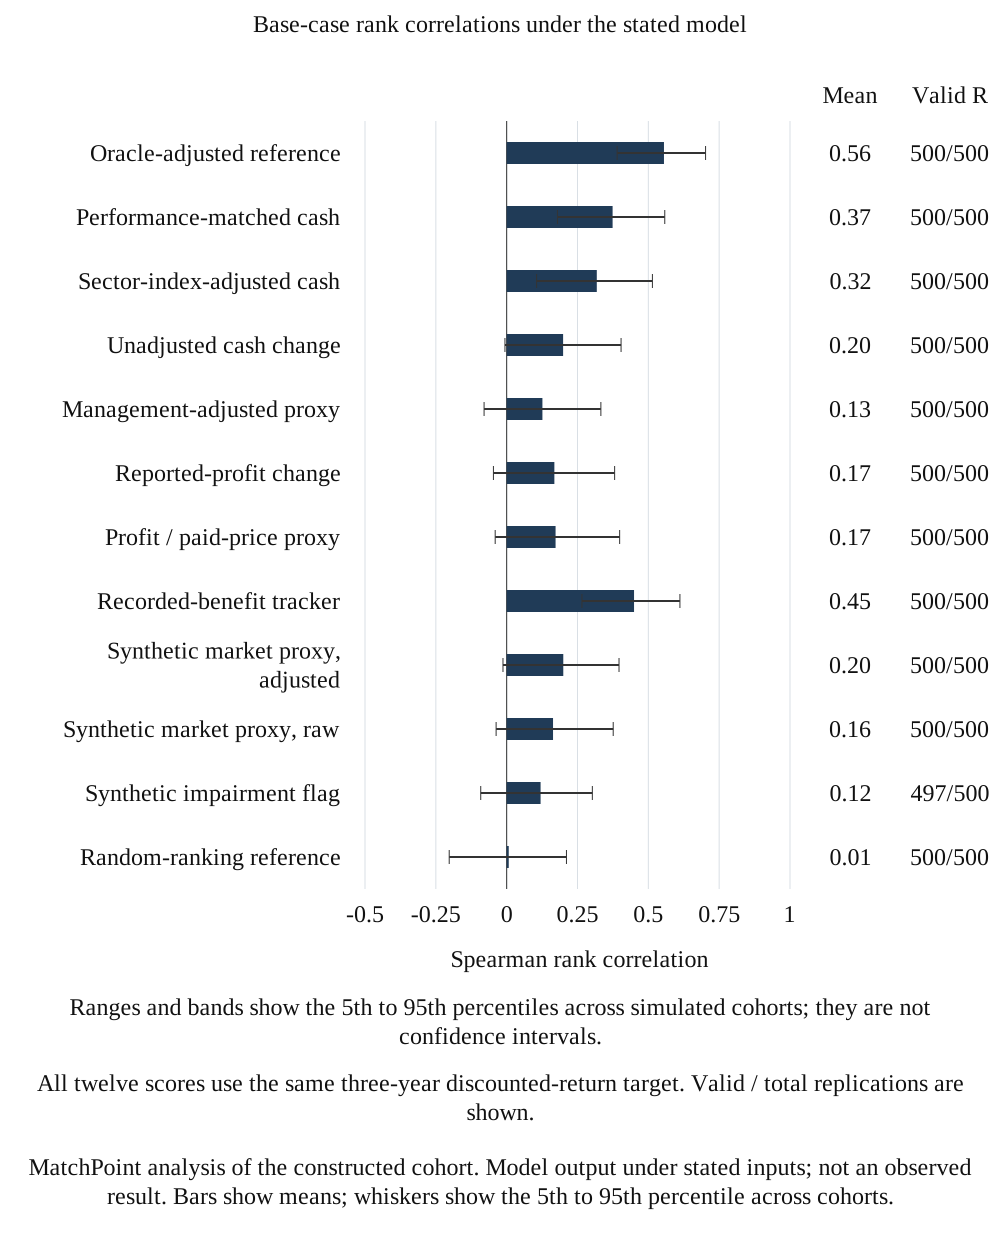
The experiment reports Spearman rank correlation with the defined discounted integration outcome and a top-quartile overlap statistic. An oracle-adjusted reference removes specified systematic effects using model information unavailable to a practitioner. It is a comparison series with a chosen noise process. It is not a mathematical upper bound on rank correlation, and another measure can exceed its correlation in a constructed case. A random-order series provides a separate chance reference.
In equations 4a and 4b, rho_s is the Spearman rank correlation across a constructed cohort, and Top_k selects the k highest values using the stated tie convention. Here q is one quarter and k is the smallest positive integer at least qN. The mean random-overlap expectation is consequently k/N for a fixed independent selection of k deals. Table 6 and Figure 2 report empirical replicate variation alongside the defined model references. The oracle-adjusted reference uses counterfactual information unavailable in an observed acquisition.
| Measure | Mean rank correlation | Cohort p05 to p95 | Mean MCSE | Valid R | Top-k hit |
|---|---|---|---|---|---|
| Oracle-adjusted reference | 0.56 | 0.39 to 0.70 | 0.0043 | 500 | 53% |
| Cash change, five same-sector/vintage performance-matched controls | 0.37 | 0.18 to 0.56 | 0.0052 | 500 | 43% |
| Sector-index-adjusted cash | 0.32 | 0.11 to 0.51 | 0.0054 | 500 | 40% |
| Cash change against observed pre-deal level | 0.20 | -0.01 to 0.40 | 0.0057 | 500 | 34% |
| Authored management-adjusted operating proxy | 0.13 | -0.08 to 0.33 | 0.0057 | 500 | 31% |
| Reported operating-profit-change proxy | 0.17 | -0.05 to 0.38 | 0.0057 | 500 | 32% |
| Reported-profit-change proxy relative to price paid | 0.17 | -0.04 to 0.40 | 0.0057 | 500 | 33% |
| Recorded positive synergy and attribution, relative to plan | 0.45 | 0.27 to 0.61 | 0.0049 | 500 | 45% |
| Synthetic market proxy, adjusted | 0.20 | -0.01 to 0.40 | 0.0058 | 500 | 34% |
| Synthetic market proxy, raw | 0.16 | -0.04 to 0.38 | 0.0056 | 500 | 32% |
| Synthetic latent-value-dependent impairment-status flag | 0.12 | -0.09 to 0.30 | 0.0052 | 497 | 26% |
| Random-ranking reference | 0.01 | -0.20 to 0.21 | 0.0057 | 500 | 26% |
MatchPoint analysis of the constructed cohort. Model output under stated inputs; not an observed result. Mean over 500 cohorts of 60 deals; 5th to 95th percentile across cohorts. Fixed full-three-year discounted return target; central model dispersion is not a confidence interval. k=ceil(0.25N).
Scroll horizontally to read the figure at full size. You can also open the full-size figure.
MatchPoint analysis of the constructed cohort. Model output under stated inputs; not an observed result. Bars show means; whiskers show the 5th to 95th percentile across cohorts.
The base-case statistics describe only the recorded model configuration and replicate distribution. Top-quartile overlap reports how frequently the selected set intersects the defined model outcome's top set. Its chance expectation depends on the selected integer set size and cohort size. The empirical replicate percentiles describe variation across the constructed cohorts; they are not confidence intervals for the ranking of measures in actual acquisitions.
Under the base assumptions, the mean rank correlation is 0.37 for performance-matched cash, 0.32 for sector-index-adjusted cash and 0.17 for the operating-profit-change proxy. The gross tracker gives 0.45 and the oracle-adjusted reference 0.56. The paired matched-cash-minus-profit difference is 0.21 in this model. These summaries refer to the defined discounted per-asset target. They describe the recorded experiment and its information assumptions; a field comparison requires acquisition records and a justified comparison design.
15 Keep monetary levels separate from ranking performance
A ranking statistic describes ordering across deals. The monetary estimate also needs a level and timing convention. The revised experiment reports the corresponding currency totals using each deal's fixed opening asset base and the same observation window and discount convention as the integration estimand. The model register states any deliberately separate undiscounted calculation. A board can then reconcile both the source of an adjustment and the numerical object being compared.
| Measure | PV USDm | PV gap USDm | Undiscounted USDm | Undiscounted gap USDm |
|---|---|---|---|---|
| Oracle-adjusted reference | -50.3 | -5.5 | 14.2 | -6.5 |
| Cash change, five same-sector/vintage performance-matched controls | -105.8 | -61.0 | -55.0 | -75.7 |
| Sector-index-adjusted cash | -369.5 | -324.7 | -378.6 | -399.2 |
| Cash change against observed pre-deal level | -388.9 | -344.1 | -401.7 | -422.4 |
| Authored management-adjusted operating proxy | 506.8 | 551.6 | 619.4 | 598.7 |
| Reported operating-profit-change proxy | -2,302.3 | -2,257.5 | -2,669.7 | -2,690.4 |
| True same-period integration target | -44.8 | 0.0 | 20.7 | 0.0 |
Author's constructed-model analysis. USD million; years one to three discounted to completion using the stated annual factor. Undiscounted cash, where separately shown, is explicitly labelled. All comparable estimates use the same fixed opening-asset conversion.
Table 7 records each model proxy's cohort total and its signed difference from the defined target in USD million. The same opening-asset conversion, window and discount convention apply to the comparable cash amounts. An adjusted management proxy can also include a constructed pipeline credit, whose timing and definition are separately disclosed. The corresponding differences identify the effects of the implemented model components; their magnitude supplies no estimate of misstatement in actual acquisition accounts.
A measure may preserve an ordering while systematically overstating or understating amounts. A denominator can also change a ranking without changing any external cash receipt. These distinctions matter when a scorecard is read beside a budget, a price-paid comparison or a contractual calculation. The model tests defined analytical proxies; it does not test the legal interpretation of a particular agreement or establish the validity of a payment decision.
16 Apply explicitly constructed stress cases to the measurement channels
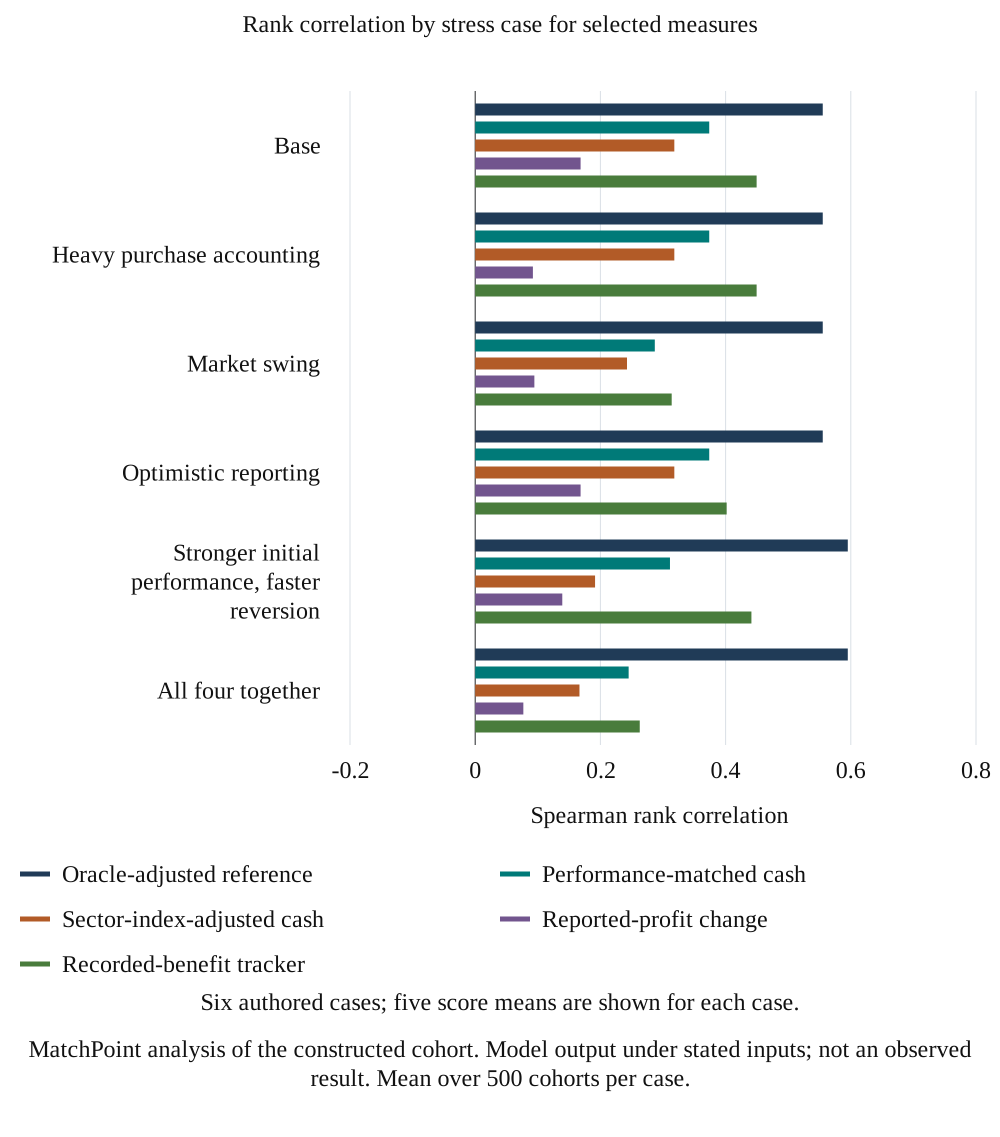
The stress design changes selected assumptions about acquisition-accounting charges, market and sector movements, optimistic management attribution and pre-deal performance persistence. A combined case applies those specified changes together. Table 8 and Figure 3 report their conditional results. The final model register defines the exact variants and simulation scope. No stress frequency, severity or joint probability has been estimated from observed acquisitions.
| Measure | Base | Heavy purchase accounting | Market swing | Optimistic reporting | Strong initial performance, faster reversion | All four together |
|---|---|---|---|---|---|---|
| Reported operating-profit-change proxy | 0.17 | 0.09 | 0.09 | 0.17 | 0.14 | 0.08 |
| Reported-profit-change proxy relative to price paid | 0.17 | 0.11 | 0.09 | 0.17 | 0.14 | 0.07 |
| Cash change against observed pre-deal level | 0.20 | 0.20 | 0.10 | 0.20 | 0.15 | 0.09 |
| Sector-index-adjusted cash | 0.32 | 0.32 | 0.24 | 0.32 | 0.19 | 0.17 |
| Cash change, five same-sector/vintage performance-matched controls | 0.37 | 0.37 | 0.29 | 0.37 | 0.31 | 0.25 |
| Authored management-adjusted operating proxy | 0.13 | 0.13 | 0.07 | 0.06 | 0.10 | 0.03 |
| Recorded positive synergy and attribution, relative to plan | 0.45 | 0.45 | 0.31 | 0.40 | 0.44 | 0.26 |
| Synthetic market proxy, adjusted | 0.20 | 0.20 | 0.17 | 0.20 | 0.20 | 0.17 |
MatchPoint analysis of the constructed cohort. Model output under stated inputs; not an observed result. Mean over 500 cohorts of 60 deals in each case.
Scroll horizontally to read the figure at full size. You can also open the full-size figure.
MatchPoint analysis of the constructed cohort. Model output under stated inputs; not an observed result. Mean over 500 cohorts per case.
The heavy-accounting case records mean rank correlations of 0.09 for the operating-profit-change proxy, 0.20 for unadjusted cash and 0.37 for matched cash. In the market-swing case, the corresponding unadjusted, sector-index-adjusted and matched cash statistics are 0.10, 0.24 and 0.29. The optimistic-reporting case gives 0.06 for the management-adjusted proxy and 0.40 for the tracker. In the stronger-initial-performance/faster-reversion case, sector-index-adjusted cash and matched cash give 0.19 and 0.31. The combined case gives 0.25, 0.26 and 0.08 for matched cash, the tracker and the profit proxy respectively. These are model-conditional rank statistics under the exact case registry.
17 Distinguish model diagnostics from checks available to a transaction team
The diagnostic table decomposes variation using the experiment's known latent integration outcome and constructed drivers. It helps explain why the model's measures change across cases. Several columns use information unavailable to an analyst of a real acquisition, including the true counterfactual or true integration value. These are simulation diagnostics. They cannot be offered as an immediately computable causal test on a client's ledger.
| Case | Accounting spread / value spread | Market-change spread / value spread | Sector-adjusted change / pre-deal strength correlation | Management-adjustment spread / value spread | Earn-out charge / value correlation |
|---|---|---|---|---|---|
| Base | 1.96 | 4.34 | -0.58 | 0.68 | 0.21 |
| Heavy purchase accounting | 4.09 | 4.34 | -0.58 | 0.68 | 0.21 |
| Market swing | 2.05 | 11.95 | -0.43 | 0.68 | 0.09 |
| Optimistic reporting | 1.96 | 4.34 | -0.58 | 1.06 | 0.21 |
| Strong initial performance, faster reversion | 1.89 | 4.34 | -0.88 | 0.68 | 0.16 |
| All four together | 4.21 | 11.95 | -0.76 | 1.06 | 0.08 |
MatchPoint analysis of the constructed cohort. Model output under stated inputs; not an observed result. Mean over 500 cohorts. Columns 2, 3 and 5 are ratios of standard deviations to the standard deviation of realised value; column 4 is a correlation; column 6 is a correlation. Latent simulation diagnostics. Spread is the across-deal standard deviation on the common full-period discounted-return scale; correlations are Pearson correlations. These quantities are not directly available from a field ledger.
A transaction team can observe accounting reconciliations, documented add-backs and pre-period operating measures within the records it lawfully holds. It can also examine sensitivity to explicitly stated benchmarks. Those observable checks can identify inconsistencies or challenge an attribution. They require their own validation before being used to identify a cause of weak performance. A negative relationship with pre-deal performance can have several explanations, including mean reversion and omitted characteristics.
The proposed board pack labels each diagnostic by its information requirement. A model-only diagnostic remains in the technical appendix or sensitivity discussion. An operational exception identifies the actual source record, the calculation and the reviewer. This separation keeps an interpretable decomposition of the constructed experiment from acquiring an unsupported empirical status.
18 Test the interaction between gross synergy claims and delivery cost
The synergy tracker records gross actions relative to a constructed plan and omits specified cash costs. Its relation to net integration value therefore changes when the cost-synergy relationship changes. Table 10 varies that relationship under the model's assumptions. The result illustrates a measurement boundary: a gross-benefit tracker and a net-cash outcome use different numerators and can rank the same deals differently.
| Measure | Cost loading 0.0 | Cost loading 0.6 | Cost loading 1.2 | Cost loading 1.8 |
|---|---|---|---|---|
| Oracle-adjusted reference | 0.70 | 0.57 | 0.39 | 0.30 |
| Cash change, five same-sector/vintage performance-matched controls | 0.51 | 0.38 | 0.24 | 0.18 |
| Recorded positive synergy and attribution, relative to plan | 0.48 | 0.45 | 0.34 | -0.02 |
| Reported operating-profit-change proxy | 0.26 | 0.16 | 0.09 | 0.11 |
MatchPoint analysis of the constructed cohort. Model output under stated inputs; not an observed result. Mean over 300 cohorts of 60 deals. The cost slope is the authored coefficient of integration cost, in years of baseline cash flow, on the synergy share; the base value is 0.6.
The reported cost-slope variants show how the model's tracker, matched cash measure and oracle-adjusted reference respond to those authored changes. The oracle-adjusted series retains its own noise and is not an upper bound. The experiment supplies no estimated cost slope for actual acquisitions. A practical scorecard can retain gross actions, associated cash costs and the resulting net-cash estimate in separately reconcilable columns.
19 Interpret later windows as different integration-cash estimands
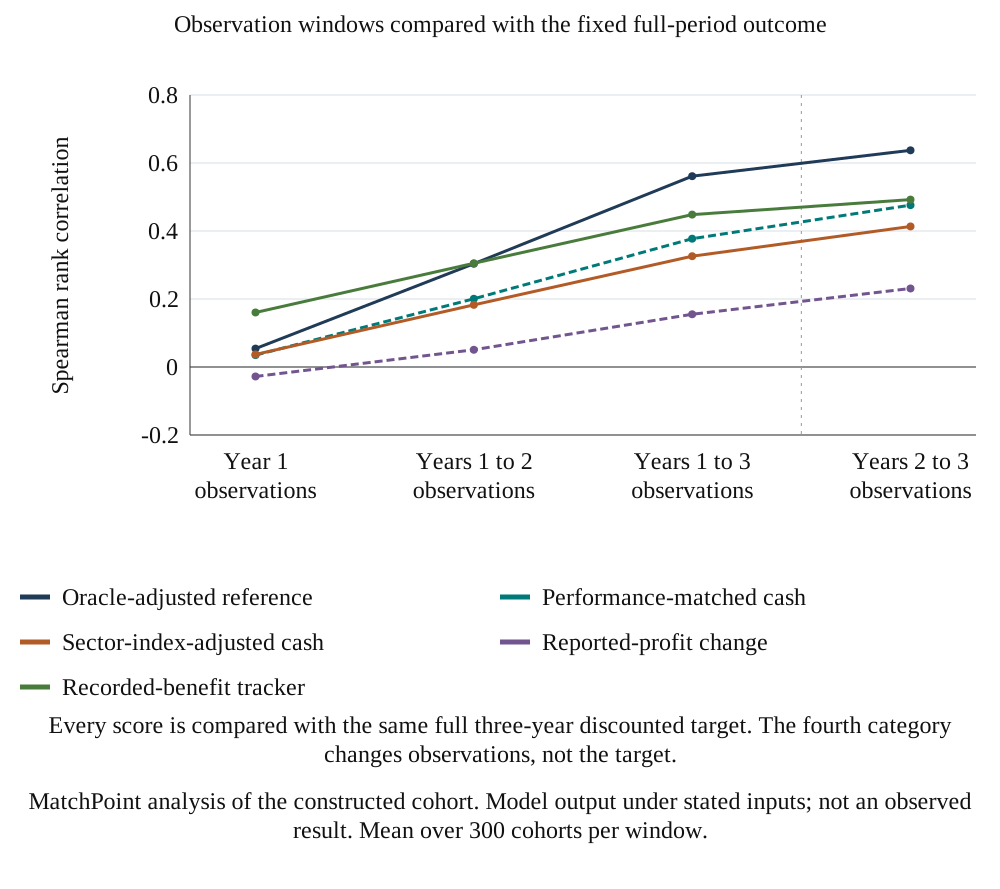
The observation-window experiment examines years one, one through two, one through three, and two through three after completion. It reports agreement against the fixed full-three-year discounted integration outcome and separately against each window's own outcome. These are named panels with different questions. The same primitive simulated deal history supplies all windows. The omitted-year-one bridge retains its integration cost and any early disruption.
| Measure | After year 1 | After year 2 | After year 3 | Years 2 to 3 only |
|---|---|---|---|---|
| Reported operating-profit-change proxy | -0.03 | 0.05 | 0.16 | 0.23 |
| Cash change against observed pre-deal level | 0.01 | 0.09 | 0.19 | 0.26 |
| Sector-index-adjusted cash | 0.04 | 0.18 | 0.33 | 0.41 |
| Cash change, five same-sector/vintage performance-matched controls | 0.03 | 0.20 | 0.38 | 0.48 |
| Recorded positive synergy and attribution, relative to plan | 0.16 | 0.31 | 0.45 | 0.49 |
| Oracle-adjusted reference | 0.05 | 0.30 | 0.56 | 0.64 |
Author's constructed-model analysis. The same complete primitive history supplies all four windows. The primary comparison uses the fixed full-three-year discounted integration outcome; separately identified results use each window's own outcome. Replicate-distribution percentiles and Monte Carlo standard errors are distinct statistics. Fixed full-period target.
| Measure | After year 1 | After year 2 | After year 3 | Years 2 to 3 only |
|---|---|---|---|---|
| Reported operating-profit-change proxy | 0.20 | 0.14 | 0.16 | 0.24 |
| Cash change against observed pre-deal level | 0.13 | 0.13 | 0.19 | 0.27 |
| Sector-index-adjusted cash | 0.26 | 0.24 | 0.33 | 0.43 |
| Cash change, five same-sector/vintage performance-matched controls | 0.27 | 0.27 | 0.38 | 0.50 |
| Recorded positive synergy and attribution, relative to plan | -0.05 | 0.14 | 0.45 | 0.54 |
| Oracle-adjusted reference | 0.38 | 0.39 | 0.56 | 0.67 |
Author's constructed-model analysis. Each column uses its own stated cash window and target. The same simulated history supplies these measurements. Full-period cash and first-year costs remain separately recorded; these columns do not estimate one common outcome. Separate within-window target; excluded year-one cash is retained in the full ledger.
Figure 4's primary panel compares the candidate measurements against the same full-period target. Its supporting table also records the within-window targets and statistics. Empirical replicate percentiles and Monte Carlo uncertainty receive distinct labels. Synergy ramp-up, initial costs and the discount convention are constructed inputs. Their effect on a later observation window is consequently conditional on the model.
Scroll horizontally to read the figure at full size. You can also open the full-size figure.
MatchPoint analysis of the constructed cohort. Model output under stated inputs; not an observed result. Mean over 300 cohorts per window.
A later-window result can have a different sign from the full-period outcome. In the deterministic model example, net first-year cash is negative USD 9.3 million and later years sum to positive USD 2.4 million, leaving negative USD 6.9 million over all three years before discounting. These are author-constructed quantities subject to the revised model's arithmetic check. The board pack retains both the later-window and transaction-to-date results.
20 Report replicate variability across the chosen cohort sizes
The cohort-size experiment compares selected numbers of constructed acquisitions while preserving the stated data-generating process and benchmark design. It reports the mean rank statistic, empirical replicate percentiles and the frequency with which one selected proxy ranks more closely to the model outcome than another. The final model register states the candidate-control pool and replication count used across sizes.
| N | Profit mean | Profit p05 to p95 | Matched mean | Matched p05 to p95 | Paired-gap MCSE | Ahead frequency |
|---|---|---|---|---|---|---|
| 15 | 0.14 | -0.33 to 0.54 | 0.34 | -0.13 to 0.70 | 0.0143 | 76% |
| 30 | 0.14 | -0.19 to 0.47 | 0.35 | 0.05 to 0.61 | 0.0102 | 87% |
| 60 | 0.15 | -0.07 to 0.37 | 0.37 | 0.17 to 0.57 | 0.0070 | 94% |
| 120 | 0.16 | 0.00 to 0.32 | 0.38 | 0.22 to 0.51 | 0.0049 | 98% |
| 240 | 0.17 | 0.06 to 0.27 | 0.38 | 0.27 to 0.47 | 0.0034 | 100% |
MatchPoint analysis of the constructed cohort. Model output under stated inputs; not an observed result. Mean and 5th to 95th percentile over 400 cohorts at each size. The last column is the share of cohorts in which matched cash has the higher rank correlation. Fixed 300 supported controls; nested primitive prefixes pair sizes. Frequencies and model ranges do not define field power or a minimum sample.
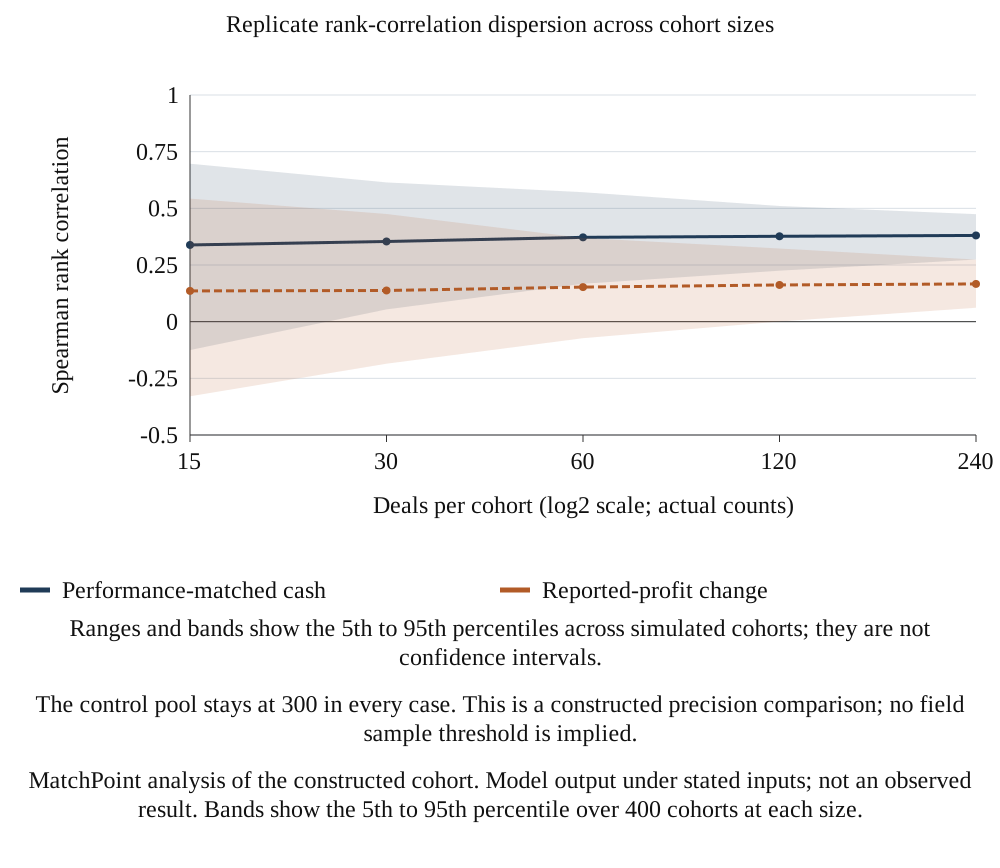
Scroll horizontally to read the figure at full size. You can also open the full-size figure.
MatchPoint analysis of the constructed cohort. Model output under stated inputs; not an observed result. Bands show the 5th to 95th percentile over 400 cohorts at each size.
These frequencies and percentile widths describe the constructed experiment. They do not establish a minimum of sixty or 120 acquisitions for a real study, prove that a smaller acquirer cannot learn from its history, or constitute a statistical-power calculation for an empirical treatment effect. A real sample-size analysis needs a specified estimand, design, clustering, effect size, missingness assumptions and error criteria. A pilot can inform those inputs before a larger consented study is designed.
21 Expose selective observation and the limits of weighting
The selective-observation experiment lets the probability of a deal remaining observed depend on constructed outcome and size. It then compares the full cohort with the observed subset and explicitly defined weighted estimators. The simulated mechanism includes outcome information that a practitioner cannot directly recover. Its purpose is to expose the sensitivity of a reported mean to that mechanism, including the possibility that weights based on inadequate predictors leave substantial bias.
In equations 5a and 5b, o_i indicates observation, v_i is the constructed integration outcome, x_i is the stated size characteristic and the coefficients define the observation mechanism. The displayed inverse-probability calculation is a normalised weighted mean. Its use for actual missing outcomes requires identification assumptions and adequate probabilities of observation. The selected treatment-effects reference provides background for weighting methods [13]; it does not validate this missing-deal model or its proposed operational use.
Table 14 and Figure 6 report the full-population mean, the unweighted observed-sample mean and five weighted sensitivity estimates over 400 constructed cohorts. The weighted estimates use size alone, size with each of three synthetic signal loadings, or the model-known observation probability. The outcome is explicitly the undiscounted three-year net integration cash return per pre-deal asset. Valid replicate counts, fit exclusions and weight diagnostics accompany the estimates.
| Estimator | Mean latent cash return | Mean bias, pp | Estimate MCSE, pp | Valid R |
|---|---|---|---|---|
| Full latent population, unavailable in a field study | 0.06% | 0.00 | 0.0067 | 400 |
| Observed sample, unweighted | 0.44% | 0.38 | 0.0080 | 400 |
| Observed sample, fitted size weights | 0.45% | 0.39 | 0.0079 | 400 |
| Observed sample, size and synthetic early signal loading 0.3 | 0.42% | 0.36 | 0.0078 | 400 |
| Observed sample, size and synthetic early signal loading 0.5 | 0.36% | 0.30 | 0.0076 | 400 |
| Observed sample, size and synthetic early signal loading 0.7 | 0.28% | 0.21 | 0.0074 | 400 |
| Observed sample, known latent observation-probability weights | 0.07% | 0.01 | 0.0099 | 400 |
MatchPoint analysis of the constructed cohort. Model output under stated inputs; not an observed result. Mean over 400 cohorts of 120 deals. Realised value is undiscounted cash less integration cost, years one to three, as a percentage of the pre-deal asset base. Latent undiscounted per-asset return; selection/loading assumptions do not establish empirical missingness identification.
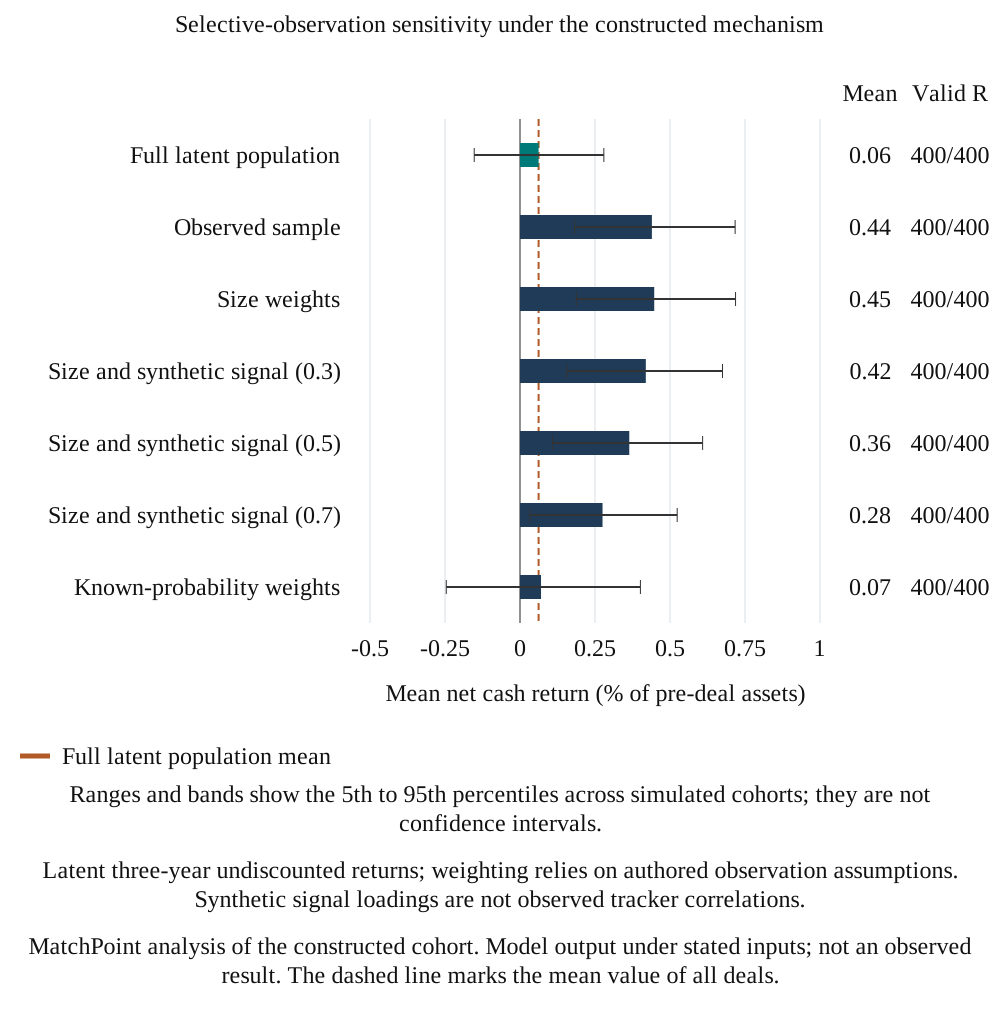
Scroll horizontally to read the figure at full size. You can also open the full-size figure.
MatchPoint analysis of the constructed cohort. Model output under stated inputs; not an observed result. The dashed line marks the mean value of all deals.
An early score generated from the latent integration outcome is a synthetic sensitivity variable. It is not an observed year-one tracker and is labelled accordingly. A reference using the true observation probability uses model knowledge unavailable to a practitioner. Bias reductions in this experiment remain conditional on those constructions. A real register should retain failed, divested and closed workstreams and disclose missing observations; a weighting exercise requires its own support and sensitivity analysis.
22 Specify the records and identification assumptions for an empirical study
A subsequent empirical study would need a dated acquisition register, consistent cash and accounting records, workstream histories and a defined comparison design. The target population and the treatment of signed but uncompleted deals must be specified separately from completed integrations. An uncompleted acquisition has no post-completion integration outcome under the paper's definition. Failed or divested completed integrations remain part of the applicable completion cohort with their observed history and missingness recorded.
| Element | Specification | Purpose |
|---|---|---|
| Unit and register | All eligible completed integrations in a defined window; separate signed/uncompleted population | Define the target population and retain failed or divested completed cases |
| Timestamps | Signing, completion, close of measurement period, each reported figure and each restatement | Fix what was known when |
| Cash ledger | Monthly operating cash of the acquired business, integration spend and acquisition-accounting items, reconciled to reported profit | Separate cash from accounting |
| Counterfactual | A prespecified sector series and a feasible performance-matched control rule using pre-outcome information | Avoid post-hoc benchmarks |
| Management records | Tracker entries as filed, with plan, delivered actions and attribution rule | Test the tracker against cash |
| Randomised slice | Where an acquirer runs several comparable integrations, random assignment of one measurement or reporting practice | Estimate the assigned reporting-practice effect under stated design assumptions |
| Sample design | Pilot-informed power or precision analysis for a prespecified question | Avoid importing a model-specific cohort threshold |
| Data governance | Authorised records, relevant legal basis, confidentiality and counterparty permissions where needed | Confirm transaction-specific lawful access with specialist advice |
MatchPoint proposed design. The data-protection and confidentiality statutes of the relevant jurisdiction were not reviewed for this paper and must be confirmed by counsel.
A randomised reporting-practice pilot could estimate the effect of that assigned practice under the conditions of its design. It would answer a different question from the effect of acquiring or integrating a business. Observational and quasi-experimental designs may also be considered where their assumptions can be examined. None is automatically valid for the records available to an acquirer. Selection, spillovers, measurement changes and the interaction between management decisions and later results need explicit treatment.
The proposed analysis plan identifies the estimand, observation window, unit of analysis, comparison rule, missing-data treatment and primary outcomes before results are inspected. Data access, confidentiality, applicable legal bases and counterparty permissions require specialist confirmation. The study can report a feasibility pilot before making any claim about sample size or generalisable outcomes. The present paper has obtained none of those transaction records and reports no completed empirical validation.
23 Reconcile the board pack to its underlying records
A board paper on integration value should show four things side by side: the cash ledger of the combined business with the integration cost shown separately; the reconciliation from that ledger to reported profit, with each acquisition-accounting item named; the counterfactual with its benchmark and matching rule; and the tracker, labelled as management's record. The paper should say which window is counted, which year-one items are provisional under the measurement-period rules [1], and which published subtotals meet the applicable management-defined performance-measure definition and require the relevant reconciliation under the entity's reporting framework. IFRS 18 applies to annual periods beginning on or after 1 January 2027, with earlier application permitted; entity-specific adoption and measure classification require confirmation [6, 7].
The board pack separates the reconciled recorded cash, the estimated incremental amount and sensitivity to the selected comparison path. The constructed experiment reports conditional differences in rank statistics and monetary estimates across its named cases. Table 9 decomposes those cases using model-known information, including quantities unavailable on an observed acquisition. A transaction team would need separately validated observable checks and transaction-specific evidence to investigate possible explanations. The proposed operational register identifies the source records, reviewer and unresolved attribution for each material claim.
The proposed operational register can be implemented with conventional data tools or evaluated with AI-assisted extraction. Each accepted amount retains its source reference, calculation rule and human sign-off. The paper reports no measured reduction in labour, error or cost from either approach. A separate controlled pilot is needed to evaluate such an implementation. The practical sections specify how to keep extraction, arithmetic and attribution decisions traceable.
24 Use the proposed framework within the transaction's actual decision rights
Before completion, the proposed measurement charter records the original investment case, cash boundary, benchmark rule and available records. At completion, it preserves opening identifiers, the funds-flow reconciliation, accounting history and integration budgets. The subsequent scorecard reports operational actions, accounting effects, external cash, estimated incremental cash and unresolved attribution as distinct evidence states.
After the first anniversary, the review can extend the observation window and examine whether benefits persist. The full-period integration costs and original case remain visible. Changes in counterfactual, perimeter or forecast receive dated approval. A contractual earn-out, bonus or covenant calculation continues to use its applicable definition, adjustment rules and dispute process. The analytical integration-value estimate supplies a separately reconciled input where relevant.
The proposed governance process ends each material review with a decision, a named owner and the evidence needed to reconsider it. A workstream may continue, change or close. Its historical costs and outcomes remain in the appropriate acquisition cohort. Further investigation is a concrete option when missing records or unresolved attribution could change the decision. The framework's use and outcomes require evaluation on the firm's own transactions.
25 State reproducibility controls, validation limits and the next evidence step
The scientific run records its configured inputs, seeds, calculations, intermediate results and numerical checks. The controls test the stated identities and the correspondence of model outputs with their labels. They include consistent units, timing, benchmark scope, deterministic worked-case arithmetic and the presentation of replicate variability. A passed control establishes the checked property of this implementation; it supplies no empirical calibration of the acquisition process.
| Scientific control | Actual executions | Largest residual | Tolerance |
|---|---|---|---|
| Constant Spearman is undefined | 1 | Not applicable | logical |
| Invalid raw Spearman inputs remain undefined | 6 | Not applicable | logical |
| Average rank tie identity | 1 | 0.000000000000 | 0.0 |
| Standard normal CDF at zero | 1 | 0.000000000000 | 0.0 |
| Cost allocation sums to one | 1 | 0.000000000000 | 1e-15 |
| Authored ramp is declared | 1 | Not applicable | logical |
| Random tie hit expectation at N=3 | 1 | 0.000000000000 | 1e-12 |
| Random tie hit expectation at N=4 | 1 | 0.000000000000 | 1e-12 |
| Worked profit/cash bridge | 1 | 0.000000000000 | 1e-12 |
| Worked full-period cash includes first-year cost | 1 | 0.000000000000 | 1e-12 |
| Worked allocation with explicit other-net-assets assumption | 1 | 0.000000000000 | 1e-12 |
| Earnout remeasurement telescopes without claiming settlement cash | 1 | 0.000000000000 | 1e-12 |
| Noiseless index adjustment removes market change | 1 | 0.000000000000 | 1e-12 |
| Noiseless supported matching removes market change | 1 | 0.000000000000 | 1e-12 |
| Noiseless cash change contains the baseline-adjusted market component | 1 | 0.000000000000 | 1e-12 |
| Repeated pure measure projection: Oracle-adjusted reference | 1 | 0.000000000000 | 0.0 |
| Repeated pure measure projection: Cash change, five same-sector/vintage performance-matched controls | 1 | 0.000000000000 | 0.0 |
| Repeated pure measure projection: Sector-index-adjusted cash | 1 | 0.000000000000 | 0.0 |
| Repeated pure measure projection: Cash change against observed pre-deal level | 1 | 0.000000000000 | 0.0 |
| Repeated pure measure projection: Authored management-adjusted operating proxy | 1 | 0.000000000000 | 0.0 |
| Repeated pure measure projection: Reported operating-profit-change proxy | 1 | 0.000000000000 | 0.0 |
| Repeated pure measure projection: Reported-profit-change proxy relative to price paid | 1 | 0.000000000000 | 0.0 |
| Repeated pure measure projection: Recorded positive synergy and attribution, relative to plan | 1 | 0.000000000000 | 0.0 |
| Repeated pure measure projection: Synthetic market proxy, adjusted | 1 | 0.000000000000 | 0.0 |
| Repeated pure measure projection: Synthetic market proxy, raw | 1 | 0.000000000000 | 0.0 |
| Repeated pure measure projection: Synthetic latent-value-dependent impairment-status flag | 1 | 0.000000000000 | 0.0 |
| Repeated pure measure projection: Random-ranking reference | 1 | 0.000000000000 | 0.0 |
| Zero latent-value spread gives undefined diagnostic | 1 | Not applicable | logical |
| Five controls for every analysed deal | 6900 | Not applicable | logical |
| All matches retain sector | 6900 | Not applicable | logical |
| All matches retain vintage | 6900 | Not applicable | logical |
| Five distinct controls per deal | 6900 | Not applicable | logical |
| Matches are five closest pre-period scores | 6900 | Not applicable | logical |
| Integration effect is observed-minus-no-integration path | 6900 | 0.000000000000 | 1e-12 |
| Profit proxy equals net cash change less accounting items | 6900 | 0.000000000000 | 1e-12 |
| Full discounted target recomputes | 6900 | 0.000000000000 | 1e-12 |
| Undiscounted full target retains year-one remainder | 6900 | 0.000000000000 | 1e-12 |
| Discounted full target retains year-one remainder | 6900 | 0.000000000000 | 1e-12 |
| Market-change diagnostic includes baseline subtraction | 6900 | 0.000000000000 | 1e-12 |
| Finite positive dollar asset scales | 6900 | Not applicable | logical |
| Finite generating paths | 6900 | Not applicable | logical |
| Earnout valuation probabilities in unit interval | 6900 | Not applicable | logical |
| Finite-life amortisation component identity | 6900 | 0.000000000000 | 1e-12 |
| Finite candidate scores | 13800 | Not applicable | logical |
| Discounted dollar/return scaling: Oracle-adjusted reference | 6900 | 0.000000000000 | 1e-09 |
| Discounted dollar/return scaling: Cash change, five same-sector/vintage performance-matched controls | 6900 | 0.000000000000 | 1e-09 |
| Discounted dollar/return scaling: Sector-index-adjusted cash | 6900 | 0.000000000000 | 1e-09 |
| Discounted dollar/return scaling: Cash change against observed pre-deal level | 6900 | 0.000000000000 | 1e-09 |
| Discounted dollar/return scaling: Authored management-adjusted operating proxy | 6900 | 0.000000000000 | 1e-09 |
| Discounted dollar/return scaling: Reported operating-profit-change proxy | 6900 | 0.000000000000 | 1e-09 |
| True discounted dollar/return scaling | 6900 | 0.000000000000 | 1e-09 |
| Window projections share full target exactly | 1200 | 0.000000000000 | 0.0 |
| Finite valid selection estimates | 2800 | Not applicable | logical |
| Selection weight ESS is in sample bounds | 2800 | Not applicable | logical |
| Authored observation probabilities have strict support | 400 | Not applicable | logical |
| Full-population selection reference has zero self-error | 400 | 0.000000000000 | 0.0 |
| Six numeric chart datasets | 1 | Not applicable | logical |
| Seven source-scoped accounting rows | 1 | Not applicable | logical |
MatchPoint analysis. Model output under stated inputs; not an observed result. Executed identities, support and statistic handling only. Finite ranking directions are results, not required pass gates.
The constructed cohort, accounting charge sizes, market processes, management attribution and selective-observation mechanism are assumptions. The oracle-adjusted reference uses information unavailable on real acquisitions, and rank-correlation comparisons are conditional on the defined target. Current primary accounting texts and the November 2026 staff consultation inform their specified factual scope. Selected older academic sources are used with their documented version and reading limits. Applicable entity reporting and contractual requirements need confirmation.
The next empirical step is a feasible, permissioned acquisition register with a prespecified measurement design. The accompanying operational templates define the proposed cash ledger, customer cohort, responsibilities, timeline and benefit evidence. A pilot can test whether those records reconcile and whether meaningful comparison data are available. The paper supplies that preparation and its constructed sensitivity analysis; it reports no observed acquisition-performance result.
26 Test the benchmark through alternative explanations and an unresolved-value range
The counterfactual is a specified comparison whose credibility depends on the information used to build it. The proposed review starts with the mechanism in the acquisition case. A shared purchasing platform should affect the prices, quantities or transaction costs of identified purchases. A cross-selling plan should affect orders from identified customers. A systems migration may affect operating cost, service quality, customer retention and the cash required to deliver the change. The benchmark is selected to address the relevant mechanism and the principal alternative explanations.
A performance-matched control can still differ from the acquired business in its product mix, contract duration, capital needs or exposure to a customer. The proposed matching register therefore records the variables available before the outcome window, the candidate pool, exclusion rules and the selected controls. It also records why a candidate was rejected. Matching on a post-acquisition result would use information influenced by the outcome under review. The proposed design freezes the rule and the pre-period inputs before reading that result.
The paper recommends a bounded sensitivity pack chosen before reviewing the headline benefit. It can include the original pre-deal plan, a sector comparator and a performance-matched comparator where the required information is available. The pack reports the same cash perimeter, dates and cost treatment under each benchmark. A change in the estimated benefit is then attributable to the comparison method displayed beside it. Selecting whichever benchmark produces the largest saving would remove that interpretive discipline.
The sensitivity pack can distinguish three sources of uncertainty. Cash-record uncertainty concerns missing or disputed amounts and dates. Counterfactual uncertainty concerns the path the business would have followed without the integration action. Boundary uncertainty concerns which activities, costs and periods belong in the calculation. Each category has a proposed owner and a resolution action. A single percentage adjustment to all benefits can conceal these different problems, so the proposed board pack identifies material items individually.
An unresolved-value range is an analytical sensitivity under stated cases. Its endpoints can be calculated by varying the named counterfactual or disputed inputs within the documented scenarios. It is labelled with those scenarios and the quantities held constant. The range is not presented as a statistical confidence interval unless a separate statistical design supports that interpretation. A narrow range can reflect narrow assumptions, and a broad range can reflect poor information or a genuinely contested causal mechanism. Both require explanation before a funding or performance decision.
The team can also use negative-control checks where a suitable unaffected activity is available. For example, the proposed procurement review can compare an unaffected product family with the same supplier over the same period. A similar price decline in both families would challenge a simple integration-only explanation. The validity of that check depends on the claim that the second family was unaffected and faced comparable market conditions. The reviewer documents that claim and any reason the proposed control may itself have changed.
A positive performance result remains compatible with alternative explanations until the design addresses them. The proposed process reports the observed cash improvement, the estimated incremental component and the unresolved portion separately. It records whether a comparison is descriptive, model-adjusted or supported by a stronger identification design. The board can then act on the evidence it has while retaining the uncertainty that matters to the decision. Obtaining additional records is a specific next action when they could change that decision.
27 Keep integration delivery separate from acquisition return and price paid
The integration programme is one component of an acquisition's economics. The buyer also commits consideration, transaction costs and potentially further capital. A cash benefit delivered by an integration action can be real while the acquisition's total return remains disappointing at the price paid. The proposed reporting structure therefore retains an integration-delivery schedule and an acquisition-return schedule with a transparent bridge between them. Each schedule names its valuation date and cash-flow boundary.
In a hypothetical comparison, two otherwise identical businesses each produce USD 10 million of incremental integration cash in the stated window. Buyer A pays USD 100 million and Buyer B pays USD 200 million for their respective acquisitions. The same USD 10 million cash amount is ten per cent and five per cent of those prices before considering any other cash flows. That arithmetic illustrates a denominator choice. It does not estimate an acquisition return because the illustration omits standalone operating cash, transaction costs, future investment, financing, taxes and exit value.
The proposed dashboard shows the currency amount alongside any normalised rate. A rate using opening assets supports a comparison of delivery relative to an operating scale. A rate using purchase price supports a different comparison whose denominator also reflects negotiated price and transaction structure. A share of the original synergy plan addresses delivery against a management forecast. These rates can rank the same transactions differently. Their labels and formulas remain visible so that a reader can identify the question each rate actually addresses.
The selected cash window also changes the estimand. A years-two-and-three window measures incremental cash within those later years. A transaction-to-date window includes the initial integration cost and any early disruption. Presenting the later-window result with the complete cash bridge makes the distinction explicit. A board can examine persistence after the first anniversary and still assess the costs incurred to reach that point. An attractive later window by itself supplies no complete acquisition valuation.
Value at a later review date requires the cash flows still expected after that date to be treated as forecasts under specified assumptions. Already realised cash belongs to the historical schedule and can be accumulated or discounted according to the stated convention. Forecast cash uses a separate valuation schedule with its own risk, investment and terminal assumptions. The proposed scorecard presents any combination as a reconciliation of historical and prospective quantities. It records changes to the original investment case as dated changes.
This design supports a more specific allocation of remedial work. A disappointing integration-delivery figure prompts examination of operating actions, costs, dependencies and attribution. A satisfactory delivery figure alongside a disappointing total acquisition return prompts examination of the original purchase economics and the remaining business outlook. Both analyses may be needed on the same transaction. The paper's constructed measurement experiment addresses the integration schedule within its stated model; it does not establish the total return or fair value of any acquisition.
28 Reconcile customer retention, price, volume and margin on a fixed cohort
A revenue-synergy workstream needs a customer cohort whose membership is fixed before its outcomes are inspected. The proposed register identifies customers present at completion, customers first won after completion, contracts transferred from the acquirer, and customers sold or removed from the reporting perimeter. A renamed account or migrated billing identifier keeps its original cohort identity. This separation allows a reader to distinguish retained-customer performance from new business and perimeter changes. It also makes explicit which records are missing when the acquired brand disappears.
Retention is reported at several levels because each answers a different question. Customer-count retention describes how many opening-cohort customers remain under the defined activity rule. Gross revenue retention follows the opening cohort while excluding expansion revenue according to a stated convention. Net revenue retention includes expansion within that cohort. Each calculation needs a reference period, a treatment of credits and refunds, and a rule for customers with no opening revenue. The paper proposes reporting those definitions beside the figures. It supplies no universal retention threshold for an acquisition or industry.
A count of retained customers alone leaves the cash question open. A customer can remain active while buying less, receiving extended payment terms or moving to a lower-margin product. The workstream therefore links retention to invoiced revenue, contribution after the selected direct costs, collections, credit losses and the working capital committed to serving the customer. Finance reconciles the aggregate to the same perimeter used for the cash ledger. Differences caused by invoices raised before completion and collected later are recorded as timing movements, with the underlying sale and collection periods preserved.
For a homogeneous product or a sufficiently narrow customer segment, a two-factor revenue bridge can allocate the interaction between quantity and price symmetrically. Let q0 and p0 be baseline quantity and price, and q1 and p1 their actual counterparts. The proposed volume contribution is the quantity change multiplied by the average of the two prices; the price contribution is the price change multiplied by the average of the two quantities. Their sum equals the observed revenue change exactly. This arithmetic allocation supports reconciliation. Causal interpretation still depends on the counterfactual and the quality of the quantities and prices.
For example, a hypothetical product starts with 100 units sold at USD 10 and ends with 110 units sold at USD 12. Revenue rises from USD 1,000 to USD 1,320. The symmetric volume component is USD 110 and the price component is USD 210. Their USD 320 total is an accounting identity for this invented example. Attributing USD 110 to cross-selling would require additional evidence that integration caused the quantity change. Sector demand, a competitor exit, a pre-existing sales pipeline and changes in product quality remain possible explanations to test.
A cross-selling claim has a proposed evidence ladder: an identified customer opportunity, a contract or order, delivery, an invoice, and an external receipt. Every stage retains its own date and amount. An order that replaces an existing product can create cannibalisation, and a discount offered to retain a customer can reduce the contribution of another workstream. The shared register links such effects so that the combined cash calculation includes both the gain and its associated cost. The commercial owner explains the customer mechanism; finance checks the numerical reconciliation.
Customer concentration and contractual changes also affect interpretation. A retained strategic customer may account for most of the opening cohort's revenue. A contract extension can shift cash across periods without establishing a higher lifetime contribution. The board pack therefore shows both the aggregate and the contribution of material accounts under the approved confidentiality policy. A disclosed concentration measure helps a reviewer understand whether the apparent improvement depends on a small number of relationships. Its interpretation remains conditional on those contracts and the firm's risk appetite.
29 Separate working-capital releases from recurring operating improvements
A cash-conversion workstream can produce a large first-year receipt by collecting old receivables, reducing inventory or extending supplier terms. The proposed ledger displays the resulting stock release separately from recurring changes in operating contribution. It records the opening balance, the ending balance, the relevant trading volumes and the cash received or paid. A recurring annual benefit is a different quantity from a one-time release of a balance-sheet stock. The charter specifies the period over which each amount is measured and keeps their units explicit.
The working-capital bridge is built on matched trading conditions. Lower receivables can reflect faster collection, falling revenue, a sale of receivables, a customer write-off or a change in the reporting perimeter. Lower inventory can accompany improved scheduling, lost production capacity, a stock disposal or a supplier consignment arrangement. Higher payables can reflect negotiated terms, a changed purchase mix or an overdue liability. The workstream owner records which explanation is supported by invoices, purchase orders, payment records and operating volumes. Unexplained changes remain in the reconciliation.
A hypothetical illustration makes the distinction useful. Assume a business reports annual credit sales of USD 36.5 million and uses a stated 365-day convention. A reduction of ten days in the receivables cycle corresponds to USD 1 million at that unchanged sales level. That USD 1 million is a constructed stock-release calculation. Repeating the same ten-day improvement in every future year would require further reductions in the collection cycle. If the business sustains the new level, the original release remains in the historical cash ledger while any recurring financing-cost effect is measured separately under its own assumptions.
Supplier finance and receivables sales require a financing bridge. Cash received from a financing arrangement changes liquidity, fees and risk allocation. The analysis records proceeds, repayments, fees, recourse and any retained exposure under the chosen boundary. It also maintains the relevant reporting and contractual classifications for specialist review. A favourable year-end bank balance can coexist with a future repayment or a later collection shortfall. The board should be able to trace both through the same dated schedule.
The persistence test follows the balance after the claimed release. The proposed tracker reports monthly receivable, inventory and payable movements for a defined observation period, with seasonality and changes in trading volumes visible. A subsequent rebuild receives its own entry. This allows the investment committee to distinguish a sustained operating change from a transfer of cash between dates. It also provides a way to examine whether a procurement saving was accompanied by increased inventory, reduced service quality or higher customer credits.
Tax and capital expenditure add further boundaries. A pre-tax operating model leaves tax relief, loss utilisation and deferred-tax accounting outside its estimated benefit unless those items are explicitly added with advice and evidence. Deferring necessary maintenance can raise near-term cash and create later investment needs. The proposed capital schedule shows both the actual payment and the deferred obligation or operational risk under review. It avoids translating a short measurement window into a claim about total acquisition value.
30 Build the measurement timetable from completion through the second full review
The proposed timetable begins before completion because later analysts need the information available when the acquisition decision was made. The investment committee records its rationale, intended operating changes, baseline sources and planned integration costs. The register distinguishes signing from completion and records the part of a calendar year included in each reporting period. An acquisition completed late in the financial year has a short first reporting period; its first anniversary and the end of its first annual reporting period are different dates.
Day One is a control handover in this proposed design. Finance records cash, debt, customer and supplier identifiers, provisional accounting items, integration budgets and access responsibilities. Each workstream receives a unique benefit identifier that follows its entries into the cash ledger. The owner also identifies dependencies on other workstreams. A technology migration that depends on a customer consent or a licence transfer records that dependency before the programme starts treating the forecast benefit as deliverable.
Early reviews concentrate on whether records reconcile and whether assumptions remain usable. A missing billing extract or an unreconciled completion balance is raised as a measurement issue with a named resolution owner. The team preserves the original acquisition case and prepares a separate current forecast. Later changes to market conditions, the integration plan or the reporting perimeter receive dated versions. The acquisition case remains available for evaluating the original decision; the current forecast supports the next operating decision.
At the first-anniversary review, the accounting lead identifies which acquisition-date estimates were provisional, when their measurement periods ended and what adjustments were made. The team continues tracking other accounting estimates and reporting changes under the applicable rules. The proposed second-year review adds a longer cash window and tests the original counterfactual against the information actually available. It presents first-year costs and results alongside later results, so that the longer review retains the economic burden of the initial integration.
| Stage | Required measurement output | Review decision |
|---|---|---|
| Before completion | Dated acquisition case, counterfactual rule, perimeter and cost definition | Approve the measurement charter and record unresolved data access |
| Day One | Opening identifiers, cash bridge, provisional-item log and benefit IDs | Assign owners and preserve the completion baseline |
| First monthly closes | Ledger reconciliation, missing-data log and realised versus forecast columns | Resolve access and accounting differences before aggregation |
| First quarterly review | Customer cohorts, workstream dependencies and attribution challenges | Approve revised actions while retaining the original case |
| First anniversary | Full-window cash bridge, measurement-period history and counterfactual sensitivity | Assess the evidence available for each benefit claim |
| Second-year review | Extended cash record, persistence checks and revised uncertainty ranges | Continue, change or close workstreams under the firm's decision rights |
| After divestment or closure | Exit costs, proceeds and retained records within the stated boundary | Close the register with a reason and preserve the evidence trail |
Proposed governance timetable. These stages are design choices, not statutory deadlines or universal integration durations.
A dashboard can retain all these dates in its metadata while showing a simple reader-facing progression. Each benefit moves through forecast, contract or action, accounting entry, cash receipt or avoided payment, and attributed incremental cash. A transition requires the evidence named in the charter. Different workstreams can be at different stages at the same review. The timetable therefore supports a portfolio of evidence states without implying that every completed action has already produced a cash outcome.
31 Assign decision rights for the reconciliation, the counterfactual and the cash claim
The proposed responsibility matrix separates operating delivery from financial measurement and independent challenge. The workstream lead owns the action and the operational records. Finance owns reconciliation to the cash ledger and the classification of accounting adjustments. The designated board or investment-committee sponsor approves the measurement charter, material changes and the response to the reported results. An independent reviewer challenges attribution and evidence under an agreed scope. The matrix supplements the firm's existing authorities and contractual duties.
Accountability for a benefit requires more than an owner name. The register records who can change the baseline, who can approve a substitution of controls, who signs the cash reconciliation and who resolves a disagreement. A procurement lead can confirm a new supplier price while finance identifies a rise in the volume purchased. The counterfactual owner evaluates how much of the price movement follows a market decline. The sponsor receives the reconciled result and any unresolved allocation. This arrangement makes the source of each judgement visible.
| Task | Delivery lead | Finance owner | Sponsor | Independent reviewer |
|---|---|---|---|---|
| Operate the integration action | Responsible | Consulted | Informed | Informed |
| Reconcile cash and accounting | Consulted | Responsible | Informed | Challenge within scope |
| Define the counterfactual rule | Consulted | Responsible | Accountable approval | Challenge before outcome review |
| Change perimeter or baseline | Explain request | Document and reconcile | Accountable approval | Review material changes |
| Claim a realised benefit | Provide records | Responsible numerical sign-off | Accept or query under delegated authority | Challenge attribution |
| Interpret earn-outs or covenants | Consult legal and contract owners | Provide the agreed calculation | Follow existing contractual authorities | Review only if appointed |
| Close a failed or divested workstream | Provide closure evidence | Preserve the cash record | Accountable programme decision | Challenge completeness |
Proposed organisational design. Responsible and Accountable describe the proposed workflow; they do not confer legal authority, amend contracts or substitute for assurance.
Independence also has a practical boundary. A reviewer who helped create the integration case can disclose that role and define the limits of a later challenge. The proposed process logs differences between the workstream submission, finance's reconciliation and the challenged figure. It retains all three when they remain unresolved. A single consolidated number can then be accompanied by the issues whose resolution would change it, with decision rights and due dates visible.
The board's actions follow its mandate and the transaction's documents. The measurement framework can support a decision to investigate, revise a forecast or change a workstream. It supplies no automatic right to withhold an earn-out, alter employee compensation or substitute a new covenant calculation. A transaction-specific legal and accounting review is required when the proposed scorecard interacts with those obligations. The cash ledger remains an evidence input to that review.
32 Use a synergy tracker that reconciles each claim to dated cash
A proposed benefit register keeps the original plan, current forecast and cash evidence in separate fields. Every entry contains a benefit ID, workstream, owner, counterfactual rule, baseline period, action date, cash date, currency, gross benefit, associated costs, working-capital effect and attribution status. A cross-reference points to the supporting contract, invoice, journal or bank record. A second reference links dependencies and possible overlaps with other workstreams. The register's schema is fixed before the team calculates portfolio totals.
Consider a hypothetical supplier-consolidation entry. The approved comparison uses the same product specification and a defined purchase quantity. The workstream records a lower supplier price, implementation costs and the actual invoices paid. It also records inventory purchased in advance, any rebates contingent on future volumes and customer credits caused by service disruption. The attributed cash calculation includes the effects inside the charter's perimeter and window. The proposed register displays a separate estimate when a material market-price change affects the counterfactual.
A benefit can pass documentary checks and still carry attribution uncertainty. An invoice proves a charged price and a payment record supports a cash date. Neither establishes what the price would have been without the acquisition. The tracker therefore distinguishes a reconciled cash observation from an estimated incremental benefit. For a material claim, the reviewer sees the result under the pre-agreed benchmark and under a stated alternative benchmark. Any difference is presented as a model sensitivity with its assumptions attached.
| Field group | Minimum content | Acceptance evidence |
|---|---|---|
| Identity and boundary | Benefit ID, owner, perimeter, currency and observation window | Approved measurement charter and identifier map |
| Original case and forecast | Signed-off baseline, original plan and dated current forecast | Preserved acquisition case and version history |
| Operational delivery | Action, dependency, implementation date and status | Contract, order, system or operating record |
| External cash | Gross receipt or avoided payment, cash date and ledger reference | Invoice/payment evidence reconciled to finance records |
| Costs and overlaps | Integration spend, capital payments, working-capital movements and linked benefits | Cost bridge and duplicate-allocation review |
| Attribution | Counterfactual method, sensitivity, reviewer and unresolved assumptions | Documented benchmark and signed challenge record |
| Closure | Continue, revise, failed, divested or complete; reason and final date | Sponsor decision and preserved historical ledger |
Proposed register schema. It contains no actual Matchpoint client, acquisition or realised-benefit data.
The total displayed to the board is reproducible from those rows. The proposed aggregation includes each benefit once, applies the specified cash dates and discount convention, and deducts associated costs once. It records the treatment of disputed claims and displays the unallocated cash reconciliation. Benefits shared between business units receive one parent identifier and an allocation whose parts sum to the parent total. Corporate overhead savings also require a recorded external cost change or a transparent resource-use definition.
Closure status is preserved when an initiative disappoints. A workstream that stops before producing its planned benefit keeps its actual costs and any partial results in the cohort. A divested business retains the observations available until the defined exit boundary, together with the missing later observations. The team documents how those cases enter each reported mean, ranking or cash total. This operational register supplies the records from which a subsequent empirical study could be designed; it does not establish that such a study has already been conducted.
33 Read a hypothetical procurement bridge from payment records to attributed cash
A hypothetical procurement workstream illustrates the proposed board reconciliation. Every amount in this example is an author-selected assumption in USD million for the same annual period and a fixed purchase quantity. The baseline supplier payments are 36.0 and the actual payments are 30.0, producing a recorded payment difference of 6.0. The agreed market-price comparator accounts for 2.0 of that difference. The estimated gross integration contribution is consequently 4.0 under that comparator. Documentary confirmation of the payment difference and credibility of the comparator remain separate evidence questions.
The programme also pays 1.2 of transition operating costs and 0.8 for integration capital expenditure in the period. A reduction in the inventory balance releases 0.5 of cash, which the example assumes is fully collected within the same window. The ledger records an observed net cash improvement of 4.5: the 6.0 payment difference, less 1.2 of operating payments and 0.8 of capital payments, plus 0.5 of working-capital release. The calculation excludes tax, financing and foreign exchange by construction. Its comparison with bank and ledger records follows those boundaries.
The estimated integration contribution after the market-price adjustment is 2.5 in the same period. The proposed board pack therefore displays 4.5 as the reconciled net-cash comparison and 2.5 as the estimated incremental amount under the selected counterfactual. It also displays the gross integration estimate of 4.0, the transition payments of 1.2, the capital payment of 0.8 and the stock release of 0.5. Each has a defined place in the bridge. A cash series already net of those costs receives no additional deduction for the same payments.
Assume the accounts also contain an acquired-intangible amortisation expense of 0.3. That non-cash charge belongs in the accounting-to-cash reconciliation. It creates no extra cash payment in this example. The integration capital payment of 0.8 remains an actual cash use even if its accounting expense is recognised over a longer period. The reviewer traces both through their own schedules so that an accounting add-back is not mistaken for a cash benefit and a capitalised payment is retained in the cost boundary.
An alternative stated comparator might attribute 4.0 of the supplier payment difference to the market. Holding the other assumptions constant then reduces estimated incremental cash from 2.5 to 0.5. The resulting 0.5-to-2.5 range is a sensitivity across two explicitly selected comparison paths. It contains no probability statement. The board can ask which price evidence could narrow that disagreement, identify its owner and decide whether obtaining it could change the proposed action.
The 0.5 inventory release is a one-time stock movement in this example. A forecast of a recurring procurement benefit needs its own quantity, price, service-quality and investment assumptions. The hypothetical period's 2.5 amount also needs a timing convention before it is compared with a present-value target. For an assumed payment date at the end of year two and a ten per cent annual discount rate, its completion-date value is approximately 2.066. The annual amount, the discounted amount and a future run-rate forecast remain separately labelled.
34 Use AI-assisted reconciliation with traceable inputs and human sign-off
AI-assisted extraction and reconciliation are proposed implementation options for the register. Candidate tasks include matching supplier aliases, classifying invoice descriptions, extracting contract dates and highlighting a tracker entry whose claimed cash date conflicts with the ledger. Each task needs an explicit input, an output definition and a review criterion. The paper has measured no productivity gain, reconciliation accuracy or realised benefit from an AI implementation. A cost or quality claim would require a separately designed and recorded evaluation.
A controlled workflow begins with permissioned source records and a test set that the implementation team can lawfully use. The proposed system retains document identifiers, extracted fields, timestamps and the version of the extraction rule or model. It keeps a link from each accepted field to its source location. The reviewer can inspect the contract clause, invoice line or ledger row that supported the value. Where the system cannot find adequate evidence, it returns the field as unresolved for human review.
The arithmetic is performed by a deterministic calculation layer after source fields have been accepted. Currency conversion, discounting, ledger joins and duplicate checks use versioned rules. The model that extracts a description has no authority to invent a missing cash amount or approve an attribution. Finance signs off the reconciled numerical input and the designated reviewer challenges the incremental interpretation. A later source correction triggers a versioned recalculation whose difference from the prior accepted output remains available.
A pilot evaluation can measure field-level accuracy, false matches, missed records, reviewer time and the cost of resolving exceptions on a held-out set. Materiality and error tolerance are agreed before testing. The pilot also includes difficult cases such as duplicate supplier names, reversed payments, multicurrency invoices and amendments that supersede a contract. Results are reported with the test-set composition and the scope excluded from the pilot. An implementation decision follows the observed results and the organisation's controls.
NIST's AI Risk Management Framework is a voluntary risk-management reference, and NIST also publishes a generative-AI profile [14]. The process proposed here uses that general risk-management context while keeping its transaction-specific controls and acceptance decisions explicit. It makes no claim of NIST certification or of a validated AI-generated counterfactual. Confidential transaction material stays within the organisation's authorised data environment and access policies.
35 Preserve the original case while interpreting later value and contractual outcomes
The original acquisition case and the later operating forecast serve separate decisions in the proposed framework. The first records why the buyer approved the deal using information available at that time. The second records what management currently expects and plans to do. A new forecast can incorporate a changed market, a revised integration plan or a divestment. The original case remains preserved so that later reviewers can assess the acquisition decision without a rewritten historical baseline.
A board may need to evaluate three questions together: how the acquired business has performed, how much of that performance can reasonably be attributed to integration, and what action is justified now. The evidence for each is different. Reported accounting results and reconciled cash support the first question within their definitions. The counterfactual and sensitivity analysis address the second. The third also depends on future costs, risks, options, decision rights and contractual obligations. The paper proposes showing the questions in separate sections of the board pack.
A contract-linked calculation uses the measure, period, adjustment rules and dispute process in the applicable documents. An integration-value estimate can be presented as a separate analytical schedule where useful. It cannot by itself amend agreed earn-out terms or establish a different legal entitlement. Specialist review is especially important where a proposed adjustment affects both a contractual payment and the estimated integration benefit. The proposed register preserves the calculation under each definition and reconciles the difference.
This separation also limits the use of a late-window result. A favourable year-two cash window can accompany substantial first-year costs. A revised business perimeter can make continuing operations look stronger while disposing of a disappointing workstream. The proposed reporting pack therefore carries the complete transaction-to-date cash bridge alongside the chosen analytical window and retains closed initiatives. The result is an explicit record of what was measured, what remains uncertain and which decisions the available evidence can support.
References
- Australian Accounting Standards Board. AASB 3 Business Combinations, Compilation 6, 30 June 2026; prepared 1 October 2026. Applies to annual periods beginning 1 July 2026 to before 1 January 2027; incorporates relevant amendments through 15 December 2022. Selected provisions reviewed; Australian Tier 1/Tier 2 and entity applicability require confirmation. https://standards.aasb.gov.au/sites/default/files/2026-10/AASB3_08-15_COMPdec22_07-26.pdf
- Australian Accounting Standards Board. AASB 136 Impairment of Assets, Compilation 5, 30 June 2026; prepared 13 October 2026. Applies to annual periods beginning 1 July 2026 to before 1 January 2029; amendments through 28 January 2026. Selected goodwill allocation and impairment provisions reviewed. https://standards.aasb.gov.au/sites/default/files/2026-10/AASB136_08-15_COMPjan26_07-26.pdf
- IFRS Foundation, IASB staff paper. Business Combinations, Disclosures, Goodwill and Impairment: Cover Paper, Agenda Paper 18, September 2026 meeting. Staff paper; does not represent the views of the Board. https://www.ifrs.org/content/dam/ifrs/meetings/2026/september/iasb/ap18-cover-paper.pdf
- IFRS Foundation, IASB staff paper. Updating subsequent performance information, Agenda Paper 18A, September 2026 meeting. Staff paper; background and redeliberation status read. https://www.ifrs.org/content/dam/ifrs/meetings/2026/september/iasb/ap18a-updating-subsequent-performance-information.pdf
- IFRS Foundation. Business Combinations, Disclosures, Goodwill and Impairment, official project page. Retrieved 9 November 2026 UAE; displayed redeliberation status, 23 September 2026 Board entry and later advisory consultation links. https://www.ifrs.org/projects/work-plan/goodwill-and-impairment/
- Australian Accounting Standards Board. AASB 18 Presentation and Disclosure in Financial Statements, June 2024. Australian standard corresponding to IFRS 18; paragraphs 117 to 124 reviewed; IASB text not reviewed. https://aasb.gov.au/admin/file/content105/c9/AASB18_06-24.pdf
- IFRS Foundation. IFRS 18 Presentation and Disclosure in Financial Statements, standard overview page. Effective date as shown; accessed 14 October 2026. https://www.ifrs.org/issued-standards/list-of-standards/ifrs-18-presentation-and-disclosure-in-financial-statements/
- Financial Accounting Standards Board. Accounting Standards Update No. 2021-08, Business Combinations (Topic 805): Accounting for Contract Assets and Contract Liabilities from Contracts with Customers, October 2021. United States GAAP; summary, provisions and effective dates reviewed. https://storage.fasb.org/ASU_2021-08.pdf
- Healy, P. M., Palepu, K. G. and Ruback, R. S. Does Corporate Performance Improve After Mergers? NBER Working Paper 3348, May 1990. Selected sections of the retained primary PDF reviewed; current retrieval unsuccessful. Original download date unverified. The later published article was not reviewed. https://www.nber.org/system/files/working_papers/w3348/w3348.pdf
- Barber, B. M. and Lyon, J. D. Detecting abnormal operating performance: the empirical power and specification of test statistics. Journal of Financial Economics 41(3), 1996, pp. 359-399. Selected abstract, method and recommendations reviewed in the university faculty-hosted journal copy. https://leeds-faculty.colorado.edu/bhagat/BarberLyon1996.pdf
- Lyon, J. D., Barber, B. M. and Tsai, C.-L. Improved methods for tests of long-run abnormal stock returns. Journal of Finance 54(1), 1999, pp. 165-201. Abstract reviewed; full text not read. https://ideas.repec.org/a/bla/jfinan/v54y1999i1p165-201.html
- Li, K. K. and Sloan, R. G. Has goodwill accounting gone bad? Review of Accounting Studies 22, 2017, pp. 964-1003. Publisher/RePEc abstract reviewed; full article not reviewed. https://link.springer.com/article/10.1007/s11142-017-9401-7
- Hirano, K., Imbens, G. W. and Ridder, G. Efficient Estimation of Average Treatment Effects Using the Estimated Propensity Score. NBER Technical Working Paper 251, March 2000. Retained primary abstract/introduction reviewed; current retrieval unsuccessful. Later Econometrica publication is bibliographic context. https://www.nber.org/system/files/working_papers/t0251/t0251.pdf
- National Institute of Standards and Technology. AI Risk Management Framework, official programme overview and links to AI RMF 1.0 and the Generative AI Profile. Voluntary framework; accessed 9 November 2026 UAE. https://www.nist.gov/itl/ai-risk-management-framework
- IFRS Foundation staff. Subsequent performance information, Capital Markets Advisory Committee Agenda Paper 3, November 2026. Selected slides 1-21 reviewed. Staff/advisory consultation; expressly not IASB views or decisions. https://www.ifrs.org/content/dam/ifrs/meetings/2026/november/cmac/ap3-subsequent-performance-information.pdf
About the Author
Chennakeshav (CK) is a corporate finance and investment banking executive with 25+ years of global experience in deal origination, structuring and execution across M&A, growth capital and corporate strategy. He has led value-creation mandates for founders, corporates and funds — bridging the boardroom view to hands-on execution and close.
His career spans Morgan Stanley, HSBC, Lloyds Banking Group, EWEC, ADQ portfolio companies and Emirates Growth Fund, across TMT, real estate, fintech, deeptech, cleantech, infrastructure and energy. He has partnered with C-suite leaders, private equity and venture funds, sovereign wealth funds and family offices to finance complex fund raises and scale-up ventures, and has led M&A due diligence, post-merger integration and business-transformation initiatives to create value.
At Matchpoint Partners he is Managing Partner, leading the firm's corporate finance, M&A and capital-raising practice. He holds an MBA from London Business School, an engineering degree from VTU and a Master of Laws (LLM, in progress) from UCL London.
An active start-up mentor, CK mentors at Techstars, DIFC FinTech Hive, Startup Grind, Founder Institute and IN5, serves as Entrepreneur Mentor in Residence (EMiR) at London Business School, and judges the Entrepreneurship World Cup.
https://www.linkedin.com/in/ckadya/
https://www.matchpoint-partners.com/team/ck-adya.html
Disclaimer
This paper is part of a continuing series on the structure of private and alternative markets. The views expressed are the author's own. The paper is for information only, describes market structure in general terms, and does not constitute investment, legal, tax or regulatory advice or a recommendation in respect of any security, vehicle or counterparty.
