

1 Allocating Retention Capacity After Completion
At completion, an acquirer takes responsibility for customer relationships that support its investment case. Sales ownership, pricing and the contracting entity may change on different schedules. This paper studies a specific allocation decision: which accounts should receive limited senior retention capacity during the first eighteen months? Revenue is a transparent baseline for that decision. Contract rights, dependence on an individual and planned commercial changes supply additional information whose value needs to be tested against the actions available to the buyer.
The framework separates exposure from saveability. Exposure is the revenue that is expected to be lost if nothing is done. Saveability is the part of that loss that a defined package of actions removes. An account can be highly exposed and unsaveable, for example when the customer has become a competitor of another customer of the acquirer. An account can also be modestly exposed and cheap to protect, for example when a consent right can be cleared before completion. A ranking that confuses the two spends scarce capacity on the wrong accounts.
The paper combines a selective legal, accounting and empirical review with an authored experiment using 300 constructed books of 600 accounts. Four practical rules are compared with expected random selection and a fully informed benchmark that maximises the defined intervention benefit. The experiment uses no customer data from a transaction. Its contribution is a transparent comparison of contract evidence, relationship signals, pricing choices and register limitations under stated assumptions. These mechanisms and the proposed operating workflow require empirical testing before a buyer treats the simulated gains as evidence for its own acquisition.
Two published Matchpoint papers already supply the wider operating architecture. The Post-Acquisition Customer Continuity Office links contractual action, relationship ownership, pricing, service, billing, revenue and cash through a customer-level record and first-100-days cadence [13]. Customer Retention during Integration develops the early-warning, diagnosis, intervention and customer-continuity-certificate workflow [14]. The decision here is the allocation of a fixed protection capacity across accounts. The experiment separates expected exposure from the benefit of a defined package, compares four practical rankings with model benchmarks, tests a partly read register and examines loyalty-linked price assignment. Those numerical results are authored tests of that narrower decision. Customer registers, consent calendars, relationship handovers and early-warning governance form the established context; this paper claims no new operating framework or observed retention improvement.
2 Measuring Annualised Revenue Exposure over Eighteen Months
For each account the model records annual revenue at completion and estimates the share exposed by month eighteen. Exposure combines complete exit with reduced purchases by a customer that remains. It is an annualised revenue-at-risk measure evaluated over an eighteen-month event window; it is not eighteen months of cumulative lost cash flow, discounted value or accounting impairment. The bank-merger study discussed in Section 7 examines relationship changes over six to eighteen months [7], which informs the choice of window without validating its use for every acquisition. The model treats a fixed-term pathway with more than eighteen months remaining as closed to expiry-related exit during the window. Other contractual routes to termination are outside that simplification.
A book of customers loses some revenue whether or not a transaction occurs. The model therefore reports the loss in two ways: the total, and the deal-attributable part, defined as the total less the loss that would remain if every deal-related driver were removed. In the base case the total is 13.6% of revenue, of which 6.9% is baseline and 6.6% is deal-attributable. Roughly 49% of the loss would therefore be assigned to the deal. Any real study must construct the same comparison, and the next sections show how much that construction matters.
The outcome is gross and defensive. It does not count new sales to retained customers, price increases collected from customers who stay, or margin. A published study of business-to-business salesperson changes finds that disruption reduced revenue from previously sold products while raising revenue from newly sold products, so a gross loss is not a net effect [9]. The measure used here answers the retention question only, and a transaction model should net it against the commercial upside separately. In the model the planned uplift reaches 35% of accounts, so the price harmonisation that raises revenue from loyal accounts is the same action that drives part of the counted loss, and Section 15 sets the two against each other.
Three counting conventions keep the measure usable in practice. Revenue is counted at the account level, so that a customer served through several contracts is one account and a consent right in any one of them is recorded against it. A credit note or a temporary price concession given to keep the account is not counted as a loss, but it is recorded, because it is the cost of protection. An account that is migrated to the acquirer's ledger keeps its identifier, so that the same account can be followed before and after the transfer.
For a valuation or acquisition-finance model, the revenue-exposure output is an intermediate input. A proposed bridge would map each account to contribution margin, working-capital behaviour, service cost and the timing of any replacement revenue. It would then compare cash flows under alternative retention actions using the valuation date and discounting conventions of the transaction model. This paper does not make that bridge numerically. Applying the gross exposure percentages directly to enterprise value, EBITDA or purchase consideration would introduce assumptions that the experiment has not tested.
The same discipline applies to concessions. A six-month rebate, a permanent list-price waiver and an additional service commitment have different economic lives. Their account records should separate committed cash cost, contingent cost and a possible future renewal effect. Finance should specify whether a price is quoted before or after rebates and whether tax, pass-through expenditure or usage variation affects the denominator. Consistent definitions allow a retention decision to be reviewed after completion without rewriting its original baseline.
3 Contract and Commercial Trigger Timelines
The first trigger is consent or a contractual control-change event. A relevant clause or applicable transfer rule may give a customer a decision at completion, subject to the transaction structure, notice provisions and governing law. The model places the associated response in months zero to three, so 100% of its consent-attributed loss occurs by month three. This is an authored timing convention. An account without that particular right may still have renewal, termination, breach-related or other options; the operative contract and applicable law require separate review.
The second trigger is a price change. Harmonising two price lists changes what some accounts pay, but the change reaches the account only at the next invoice cycle or renewal, and usually after a notice period. The model places the response in months four to nine after completion. The third trigger is a change of account owner, either an internal reassignment or the departure of the representative who held the relationship. The model places the response in months three to twelve for reassignment and months two to eight for the departure of a representative who can solicit the account. These windows are authored; no source supplies them.
Under the authored windows, 34% of deal-attributed loss occurs by month three and 93% by month twelve. Those patterns are diagnostic hypotheses. Clustering after completion can motivate a consent review; clustering after a price notice can motivate a pricing review. Timing alone cannot identify a cause because notices, owner changes, service failures and seasonality can coincide. A dated event log supports competing explanations and checks against unaffected accounts. An undated record cannot recover the ordering reliably. Section 21 develops the proposed evidence design.
4 Contract Transfer and Customer Consent
The official text of Federal Decree-Law No. (25) of 2025 records issuance on 1 October 2025, Official Gazette No. 809 of 14 October 2025 and commencement on 1 June 2026 [1]. Article 2 of the promulgating decree repeals Federal Law No. (5) of 1985, and Article 3 specifies commencement. Article 4 of the attached Civil Transactions Law addresses non-retroactivity unless the law provides otherwise. Application to earlier facts, acts or disputes therefore requires a transitional analysis. Article 19 also makes governing-law analysis relevant. The discussion here concerns the provisions cited and supplies no opinion on a particular agreement, free-zone regime or foreign-law contract.
The articles on the transfer of an obligation distinguish two cases. A creditor may assign a right unless law, the parties' agreement or the nature of the obligation prevents it, and the validity of the assignment does not depend on the debtor's consent (Article 405). The assignment is not enforceable against the debtor or a third party unless the debtor accepts it or is notified (Article 407). A debtor may transfer an obligation on the same limits, but the assignment of a debt is concluded only with the consent of both the assignee and the creditor (Article 418). If the creditor refuses, expressly or by silence after a reasonable period, the original debtor is not discharged (Article 419) [1].
For a supplier, assignment of a receivable and transfer of a duty to perform engage different questions. The cited provisions allow assignment of a right subject to their limits and acceptance or notice rules, while transfer of an obligation involves the consents described above. A share purchase ordinarily leaves the contracting entity unchanged, making any contractual control-change provision a distinct review item. An asset transaction requires an agreement-by-agreement transfer analysis; some contracts may remain with the seller or require a different arrangement. Counsel should confirm the governing law, contractual restrictions, consents, notices and transaction mechanics. The paper offers a general reading of the cited provisions, without a case-law analysis. Its assumed twenty per cent consent-right share is a model input, with no claim about market prevalence.
| Pathway | What moves | Customer's position | Source |
|---|---|---|---|
| Assignment of a right (the supplier's receivable) | Right to payment | Validity does not need consent; enforceable against the customer only once accepted or notified | Articles 405, 407 |
| Assignment of a debt (the supplier's duty to supply) | Obligation to perform | Concluded only with the consent of assignee and creditor; refusal leaves the original supplier bound | Articles 418, 419 |
| Silence after notice | Obligation to perform | Treated as refusal once a reasonable period has expired | Article 419(3) |
| Prohibition by agreement or by nature of the obligation | Either | Check the source of the restriction; contractual agreement can address contractual limits only where the governing law permits | Articles 405, 418 |
| Purchase of shares | Nothing; the contracting entity is unchanged | Assignment articles generally not engaged; review any contractual change-of-control term and other applicable requirements | Contract terms |
| Earlier facts and acts | Transactions or contractual facts preceding commencement | Transitional and governing-law review required; no contract-specific conclusion is made here | Articles 4 and 19; promulgating Articles 2 and 3 |
General reading of the cited UAE provisions [1], subject to governing law, transitional rules, contract terms and counsel review. The transaction structure determines whether a right, obligation or control-change clause is engaged.
5 Account Ownership and Relationship Dependence
Shi and colleagues report a difference-in-differences study of a Fortune 500 business, with an adjustment for selection, in which sales-representative departures were associated with annual sales losses of 13.2% to 17.6% at affected customers [10]. Their abstract reports that existing representatives generally limited the loss more effectively than new hires and that relevant industry experience mattered. Only the abstract was reviewed for this paper. These estimates concern that study and its identification assumptions. They are not customer-loss rates for acquisitions, the GCC or the buyer whose accounts are being evaluated.
Schmitz and colleagues examine four years of data on 2,040 customers of a European logistics company [9]. The accepted manuscript's main results report 6.8% lower total revenue on average, comprising 28.8% lower resale revenue and 52.2% higher revenue from newly sold products. Its introduction uses different percentages, so this paper follows the main-results estimates. The published abstract's conditional improvement exceeding 29% depends on the previous firm-level relationship and its management by the incoming salesperson; it is not the average result for all disrupted accounts. The study supports separating lost existing sales, new sales and context-dependent net performance. Its figures supply no acquisition-specific coefficient, and the manuscript cautions against treating proactive relationship disruption as a certain route to growth.
The enforceability of a restraint requires a separate legal assessment. For workers within the scope of the federal private-sector labour regime, Article 10 permits a non-competition condition where the work gives access to clients or work secrets, and requires limits in time, place and type of work to the extent necessary to protect legitimate business interests. The period cannot exceed two years after expiry of the contract; the condition is null where the employer terminates in breach of the decree-law, and the specified claim is barred one year after discovery of the violation [2]. Article 12 of the executive regulations places the burden of proving alleged damage on the employer, addresses employer-attributable termination and written release, and sets exemptions for agreed compensation of no more than three months' wages with the previous employer's written consent, probationary termination and specified in-demand occupational categories [3]. These provisions establish conditions and limits, not an observed reduction in customer-following behaviour. The model's 35% reduction is authored.
Customer-contact records can contain personal data because the individuals are directly or indirectly identifiable. Where the federal Personal Data Protection Law applies, Article 5 requires lawful, purpose-limited and proportionate processing, and Article 6 governs consent when consent is the basis relied upon [4]. Article 4 sets exceptions to the consent prohibition; an acquisition does not by itself establish the appropriate basis for every use. Article 2 excludes specified government, sector-regulated health and banking or credit data, and free-zone entities with special personal-data legislation. The applicable regime, purpose, permitted recipients and access should therefore be checked separately for analysis and customer outreach. The paper does not determine the current executive-regulation or regularisation position. For the proposed register, unavailable or impermissible contact data is recorded as a limitation, rather than as proof of low dependence or permission for outreach.
6 Pricing Integration and Switching Costs
Homburg and Bucerius report a survey of 232 horizontal acquisitions examining marketing-integration extent, speed, cost savings and market-related performance [11]. The abstract reports a positive relationship between integration extent and cost savings alongside an adverse relationship with market-related performance, and a stronger connection between market-related and financial performance than between cost savings and financial performance. This motivates examining commercial integration alongside the cost case. It supplies no customer-churn rate and does not isolate the effect of a particular repricing policy, owner change or consent process.
The bank-merger studies add a mechanism that matters for the design. The authors of the Norwegian study read their evidence as suggesting that, when a merger harms borrowers, firms with low switching costs switch banks while similar firms with high switching costs remain locked in to the relationship [8]. A study of Belgian small firms separates borrowers with one banking relationship from those with several, and distinguishes staying, dropping and switching. Borrowers with several relationships were less harmed because they could hedge against a relationship ending [7]. Both support two features of the model: a second source makes exit and wallet reduction easier, and a high switching cost converts potential exit into lock-in.
A contractually restricted customer can still change purchasing behaviour within the rights and obligations of its agreement. The experiment permits wallet reduction through a second source even when its simplified expiry pathway is closed during the window. This is a modelling assumption. A live register should document minimum-purchase obligations, exclusivity, termination rights, renewal dates, technical dependencies and available alternatives before classifying either an exit or a reduction in purchases as feasible. The cited studies provide no population prevalence for those features.
7 Customer Evidence from Bank Mergers
The Belgian study used a credit register of firm-bank relationships from 1997 to 2003. In the working-paper version read for this paper, borrowers of target banks had a longer-term discontinuation rate that was 8.5 percentage points higher than similar borrowers of non-merging banks, measured over the six to eighteen months after a merger. Borrowers of acquiring banks were less likely to lose the relationship, and overlap borrowers were less likely still. Single-relationship borrowers of target banks were 9.8 percentage points more likely to be dropped, and only slightly more likely to switch. The average discontinuation rate in the sample was 11.1% [7]. The published article appeared in the Review of Financial Studies in 2011; the numerical estimates cited here are attributed to the October 2009 working paper.
The Norwegian study reports an average loss of approximately 0.8% of borrower equity value when an announcement identified the borrower's bank as a target, with a larger estimate for smaller borrowers in mergers of two large banks [8]. Its working-paper abstract and introduction describe changes in relationship exit as well as announcement effects. These are study-specific results from bank consolidation. Together with the Belgian evidence they motivate examining the acquired book, customer alternatives and the distinction between an exit and a switch; they supply no general estimate for commercial customer retention.
The outcomes and settings differ from annualised customer-revenue exposure in this experiment. The cited bank-merger results measure relationship status or borrower equity value. They do not calibrate the experiment's owner-change or price-harmonisation terms. They motivate examining the acquired book and customer alternatives, with no source-derived parameter. The model's baseline loss of 6.9% and its deal-attributable loss of 6.6% are authored magnitudes, without calibration to the Belgian discontinuation rate or the Norwegian exit rates.
8 Accounting Records and Customer Materiality
The January 2012 accompanying examples for IFRS 3 discuss recognition of acquired customer contracts and related relationships under the contractual-legal criterion, including cases where separate sale is restricted. Examples IE26 to IE28 also distinguish possible useful lives and describe relationships arising through regular contact [6]. These examples accompany the standard and are not part of its normative requirements. This paper uses the dated examples to motivate a linked customer record. It makes no current accounting-recognition or impairment conclusion for a particular acquisition; those require the applicable current standard and transaction facts.
Paragraph 34 of AASB 8 requires specified major-customer disclosures when a single external customer accounts for at least ten per cent of the entity's revenue [5]. The total and reporting segments are disclosed without requiring the customer's identity. Entities known to be under common control are considered together for this test. Paragraph 2 sets the standard's scope around publicly traded debt or equity and specified public-issuance filings; the threshold is not a universal disclosure duty for every private business. The cited compilation operates for the periods specified in its official record, including periods beginning on or after 1 July 2021 and before 1 January 2027. A buyer can use an appropriately defined concentration flag in its private analysis without implying that this disclosure rule applies to every target.
Table 2 proposes the account record needed for this analysis. Accounting recognition and major-customer disclosures can identify relationships or concentrations warranting attention, subject to the reporting entity's applicable standards. They do not predict an individual account's retention probability. A lost relationship may prompt a separate impairment assessment, which this paper does not perform. The register should retain the basis of each accounting or contractual designation and avoid using a public disclosure threshold as an intervention rule.
These sources justify the inputs as categories. The legal texts supply the consent mechanics, the labour texts supply the limits on restraints, the empirical studies supply the direction of the owner-change, switching-cost and acquired-book effects, and the accounting texts supply the record. None supplies a coefficient or a population rate. The experiment therefore draws its categories from these sources and sets every magnitude by authorship, and Section 20 states that limit again where the results could be mistaken for observation.
| Record | Required information | Decision supported |
|---|---|---|
| Contract basis | Counterparty entity, term, termination and change-of-control clauses, assignment limits | Whether the customer can leave or must consent at completion |
| Relationship holder | Named owner, share of contacts and meetings held by that person, restraint terms | Dependence on one person and the follow risk |
| Commercial change | Planned price change, effective date, notice period and renewal date | Price exposure and its clock |
| Alternatives | Second source, switching cost, technical or regulatory lock-in | Ability to leave or to reduce purchases |
| Conflict | Whether the customer competes with the acquirer or another customer | Exposure that protection cannot remove |
| Materiality | Revenue, share of revenue, major-customer flag under the segment standard | Value at stake |
| Data use | Source and purpose of contact data | Permitted outreach |
Proposed record. Entries describe information to obtain; they are not findings about a particular acquisition.
9 Constructing the Customer-Book Experiment
Each constructed book holds 600 accounts with annual revenue drawn from a lognormal distribution, which gives a total of about USD 164.8 million per book and places 43% of revenue in the largest tenth of accounts. Contract pathways are assigned at random: a consent right on change of control, a fixed term with free transfer, an evergreen contract with short notice, and order-by-order trade. A pathway is open to exit inside the window for 83% of accounts on average. Each account also has a loyalty score, a switching-cost score, a dependence score, a second-source flag and a conflict flag.
Owner changes, representative departures and price uplifts are generated by stated rules. Uplifts are assigned more often to accounts with higher constructed loyalty, producing the selection mechanism examined in Section 18. Table 3 records authored inputs chosen for transparent stress testing. No coefficient, prevalence or intervention effect is estimated from observed customer data. The equations below determine every account outcome within this experiment.
In Equation 1, z_i is the pressure to leave on account i, u_i the planned price uplift in percentage points, R_i the indicator that the owner changes, d_i the dependence on the current owner, F_i the indicator that the owner leaves the seller, kappa the share of the follow effect removed by an enforceable restraint, k_i the consent-right indicator, c_i the channel conflict indicator, m_i the second-source indicator, s_i the switching cost and ell_i the loyalty. The beta terms are the authored coefficients. O_i equals one when the pathway is open inside the window, and P_i is the probability of exit.
In Equation 2, psi_i is the share of purchases a staying customer moves elsewhere, psi_0 a baseline of two per cent, lambda a pass-through of one half, q_i the pressure expressed as a probability even for accounts whose pathway is closed, V_i annual revenue and L_i the expected revenue lost. A locked-in account that has a second source can therefore still reduce its purchases. Accounts whose pathway is open, 83% on average, carry both exit and wallet reduction; the remainder carry only wallet reduction inside the window, and that reduction is larger where a second source exists.
| Input | Value | Status |
|---|---|---|
| Accounts per constructed book; books | 600; 300 | Authored |
| Annual revenue per account | Lognormal, median USD 150 thousand, log standard deviation 1.1 | Authored |
| Contract pathways (consent right; fixed term; evergreen; order by order) | 20%; 35%; 25%; 20% | Authored |
| Remaining fixed term; window counted | 1 to 36 months; 18 months after completion | Authored |
| Owner change; of which departure from the seller | 35%; 40% of changes | Authored |
| Authored attenuation of departure-follow pressure | 35% of the follow effect removed | Authored |
| Price uplift: coverage; size | About 35% of accounts; 3 to 10 points, assigned more often to loyal accounts | Authored |
| Channel conflict; second source in place | 10%; 40% | Authored |
| Log-odds coefficients: price, owner, follow, consent, conflict, second source, switching, loyalty | 0.10 per point; 1.2; 1.0; 1.0; 1.1; 0.6; -1.4; -1.2 (intercept -2.2) | Authored |
| Wallet reduction among stayers | 2% plus 0.5 times the pressure for second-sourced accounts | Authored |
| Protection package | Owner terms times 0.25; consent term times 0.30; no price concession | Authored |
| Retention capacity | 60 accounts (10%); sweep 20 to 240 | Authored |
| Observation error in the rules | Dependence and switching: standard deviation 0.15; second source flipped 20% | Authored |
| No customer-level data from any transaction | None used | Stated |
Authored inputs. Every value is an assumption of the constructed experiment and none is taken from a transaction or a source.
10 Baseline Exposure by Contract Pathway
Table 4 reports annualised endpoint exposure by contract pathway. Across the constructed books it is 13.6% of revenue, or USD 22.33 million per book. Consent-right accounts show 24.6% exposure within their segment, fixed-term accounts 8.5%, evergreen accounts 12.5% and order-by-order accounts 12.7%. The uniform one-to-thirty-six-month remaining-term assumption leaves about half the fixed-term accounts closed to expiry-related exit within eighteen months. Consent-right accounts hold 20% of revenue and 36% of expected exposure under these inputs. The ratios pool revenue across books; they are not averages of the account loss percentages.
Figure 1 splits each bar into the baseline part and the five deal drivers. Consent is the largest single driver for the consent-right segment, as the model assumes, and price and owner change are visible in every segment that they reach. The comparison between pathways follows from the authored coefficients and the assumed shares. It does not show that consent-right accounts churn more in practice. It shows that if the assumed option exists and is used at the assumed rate, the exposure concentrates where the option sits.
| Contract pathway | Share of accounts | Share of revenue | Annualised exposure, % of segment revenue | Share of all expected loss | Deal-attributable loss, % of segment revenue |
|---|---|---|---|---|---|
| Consent right on change of control | 20% | 19.7% | 24.6% | 35.9% | 16.9% |
| Fixed term, free transfer | 35% | 34.9% | 8.5% | 21.9% | 3.0% |
| Evergreen, short notice | 25% | 25.0% | 12.5% | 23.1% | 4.8% |
| Order by order | 20% | 20.3% | 12.7% | 19.1% | 5.0% |
Constructed model output under authored inputs. Pathway or segment ratios pool revenue and exposure across 300 books. These ratios are not averages of account percentages or field estimates.
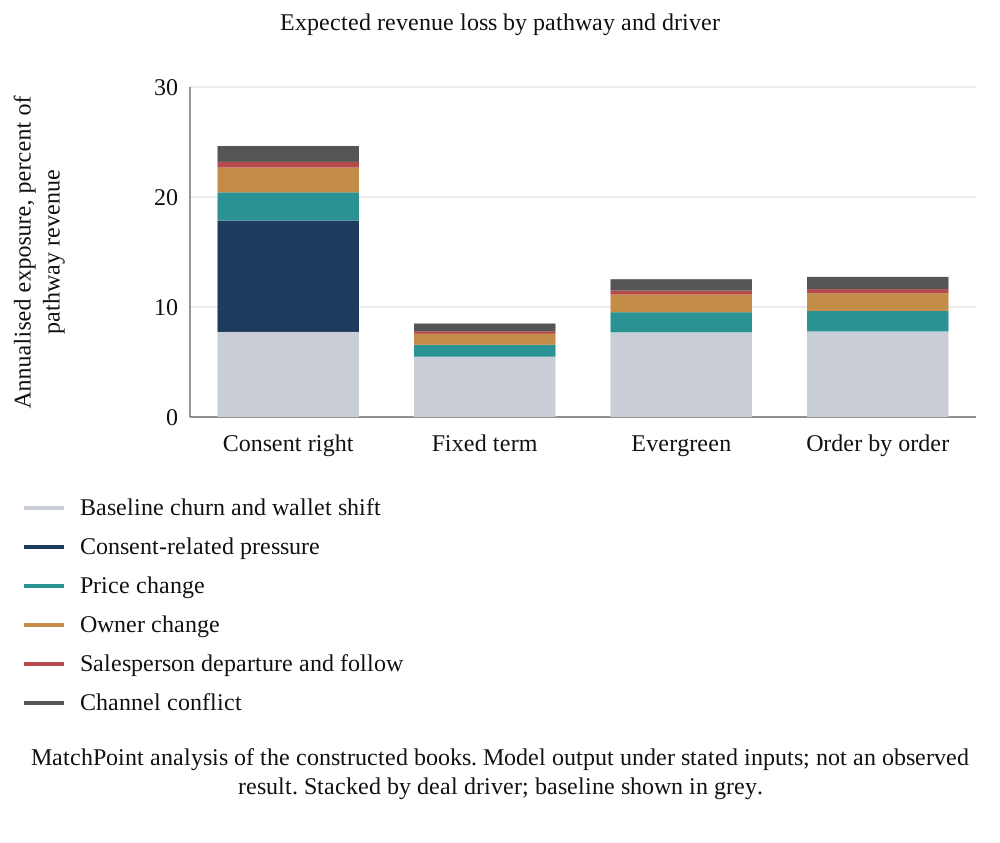
MatchPoint analysis of the constructed books. Model output under stated inputs; not an observed result. Stacked by deal driver; baseline shown in grey.
The contract field adds information absent from a revenue-only list. Its usefulness depends on the right, the feasible action and the cost of obtaining it. A consent discussion or an owner transition may be considered before completion only where permitted and operationally feasible; neither timing nor success is assumed for a live transaction. In this experiment the consent-related package effect is fixed by authorship, which favours a contract rule when that effect is strong. The sensitivity in Section 14 tests the consequence of removing that assumed attenuation.
11 Relationship Dependence and Repricing Exposure
Table 5 reads the same books by relationship and price. Among accounts whose owner changes, expected loss rises from 13.9% of revenue when dependence on the owner is low to 22.2% when it is high. Among accounts with a planned uplift of six points or more the expected loss is 18.3% of revenue, against 11.8% for accounts with no uplift. The uplift reaches 35% of accounts in the base case. These are model differences produced by the authored coefficients, and the gradient across dependence bands follows directly from the owner and follow terms in Equation 1.
| Segment | Share of revenue | Annualised exposure, % of segment revenue |
|---|---|---|
| Owner changes; Low dependence (below 0.33) | 11.5% | 13.9% |
| Owner changes; Middle (0.33 to 0.55) | 11.9% | 17.5% |
| Owner changes; High (0.55 or more) | 11.3% | 22.2% |
| No uplift | 64.6% | 11.8% |
| Uplift below 6 points | 15.3% | 14.8% |
| Uplift of 6 points or more | 20.1% | 18.3% |
Constructed model output under authored inputs. Pathway or segment ratios pool revenue and exposure across 300 books. These ratios are not averages of account percentages or field estimates.
The deal-attributable loss can be allocated to the drivers in proportion to their positive contributions to the pressure to leave. In the base books consent accounts for 30%, price for 26%, owner change for 23%, departure and follow for 5% and channel conflict for 15% of the deal-attributable loss. The allocation is an accounting convention and not a causal decomposition, because the drivers interact through the same logistic function. The consent share is large partly because the authored consent coefficient of 1.0 applies to every consent-right account from completion, and a smaller coefficient would move weight to price and owner change.
Within the constructed experiment, the exposure effect of an uplift varies with the account's second source, switching cost and loyalty. The same nominal uplift can produce a larger modelled loss when these inputs create greater scope to exit or reduce purchases. These differences support an account-level sensitivity review of the authored assumptions. They establish no observed pricing response or implementation cost for a buyer. Section 15 makes the separate retained-revenue comparison, before margin, delivery effort and repeated pricing behaviour.
12 Timing Assumptions and Loss Attribution
Figure 2 allocates the model's annualised deal-attributed endpoint exposure over authored monthly windows. Consent-related exposure is assigned to months zero through three, giving 100% allocated by month three. For the total deal-attributed exposure, the allocated shares are 34% by month three, 57% by month six and 93% by month twelve. The curve distributes expected exposure using the stated attribution rule and timing windows. It does not simulate observed exit dates or integrate monthly cash losses. Its shape is a hypothesis for comparison with a dated record, without an empirical timing estimate.
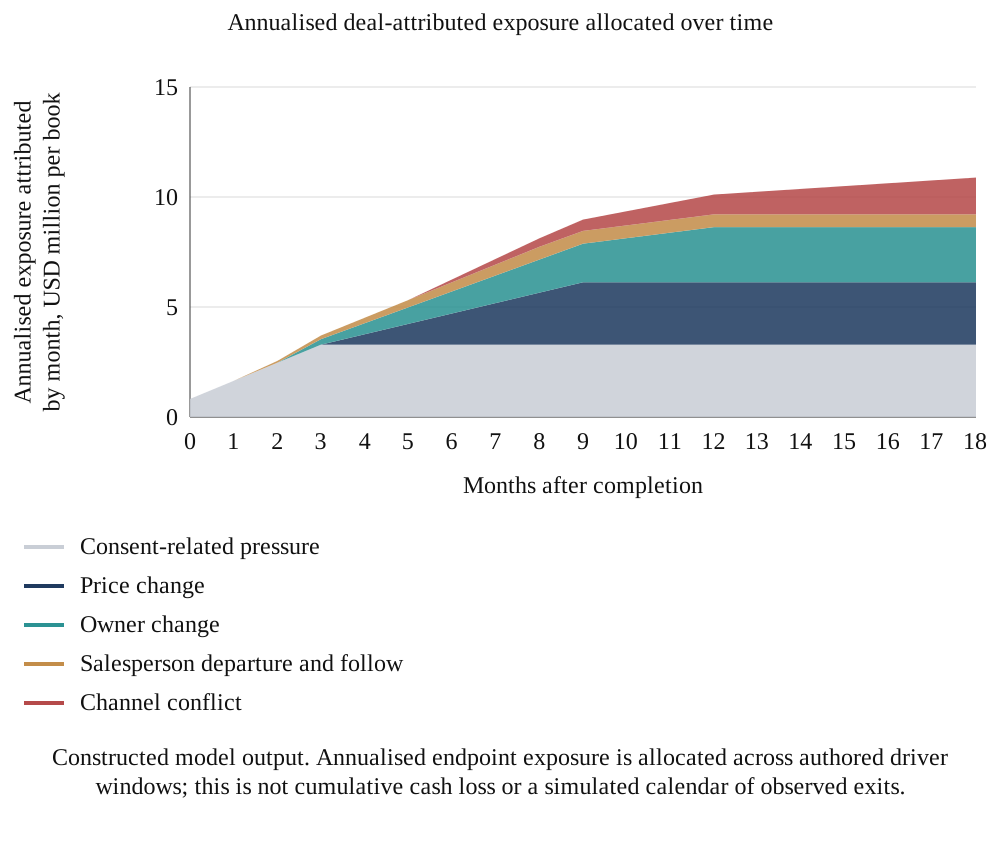
Constructed model output. Annualised endpoint exposure is allocated across authored driver windows; this is not cumulative cash loss or a simulated calendar of observed exits.
The authored timing pattern suggests a proposed monitoring checklist. A buyer observing early exits could examine consent events alongside owner changes, service failures and other contemporaneous events; exits following price notices could prompt a pricing review alongside competing explanations. This experiment does not establish which cause should be investigated first in an observed transaction. A dated record of each trigger, exit and reduction in purchases would support that assessment. The following sections examine incomplete records.
The deal-attributed curve subtracts the model's authored baseline from total annualised endpoint exposure. That baseline is 6.9% of annual revenue with the five deal-related pressure terms removed while the remaining account features and pathway indicator are retained. It is a constructed counterfactual, not a measured pre-completion churn rate or a cumulative loss over eighteen months. A live attribution study requires its own defensible comparison. The package benefit is calculated separately as the difference between expected exposure without and with the package; it is not the removal of every post-completion loss.
13 Protection Packages and Account-Selection Rules
The authored protection package changes two model terms and includes no price concession. A continuity action multiplies owner-change and departure-follow pressure by 0.25; a consent-related action multiplies consent pressure by 0.30. These are assumed residual-pressure multipliers. They are not measured treatment effects, evidence that consent has legally been obtained, or a guarantee of retention. Channel conflict, second sourcing and switching costs remain unchanged. The experiment values the reduction in gross annualised revenue exposure at a fixed capacity of 60 accounts, or 10% of a book. It initially assigns no delivery cost to the package, a limitation addressed below.
In Equation 3, L_i(0) and L_i(1) are expected losses without and with the package. S is the selected account set, enumerated once each in any order as s_1 through s_(n_S); n_S is the selected count. W(S) is their total gross benefit, W_rand the expected benefit from random selection of the same size and W_orc the benefit from selecting the largest true intervention benefits. C(S) expresses the share of improvement between those two benchmarks. The random reference equals zero and the fully informed reference equals one by construction. The exposure oracle uses the generating model's loss information but need not maximise intervention benefit.
| Rule | What it ranks by | What it misses |
|---|---|---|
| Random order | Nothing; expected value of any selection of the same size | Expected reference; individual or deliberately weak selections can perform below it |
| Revenue rank | Annual revenue | Contract rights, dependence, price and conflict |
| Contract-rights list | Accounts with a recorded consent right first, then revenue | Accounts without a recorded right; unread contracts look free of rights |
| Relationship dependence | Revenue times the observed dependence of accounts whose owner changes | Consent, price and conflict |
| Exposure points | Revenue times one plus points for contract pathway (three for a consent right, two for evergreen or order-by-order, one for fixed term), high dependence where the owner changes, uplift of five points or more, conflict, a second source and low switching cost | Interactions; weights are set by authorship, not by fitting |
| Exposure oracle | True expected loss | Whether the loss can be saved |
| Saveable oracle | True benefit of the package | Full-information upper bound for the stated separable fixed-account-count objective |
Rules defined for this constructed experiment. The fully informed saveable benchmark bounds gross intervention benefit at fixed capacity. The exposure oracle is a separate information-rich ranking and is not an intervention optimum.
Table 6 defines the rules. The practical rules are observed with error. Dependence and switching cost carry noise with a standard deviation of 0.15, and the second-source flag is wrong for one account in five. The points are integers and are not tuned to the coefficients. This keeps the rules from being a restatement of the generating equation, although the premise that all of them measure real features is shared. The consent flag, by contrast, is observed without error when a contract has been read, which favours the contract-rights list in the base case and is relaxed in the register stress case.
A proposed commercial allocation would replace the zero-cost, equal-capacity simplification with the actual resources required. One account may need counsel and a consent negotiation; another may need a technically qualified successor or a service remediation programme. Account count is therefore an initial capacity unit. A buyer can instead track hours by specialist, cash cost and contractual deadlines, then compare feasible action bundles. The present ranking experiment supplies no optimal resource allocation when actions compete for different skills, have different durations or interact across customers.
A practical sensitivity schedule can retain an account for review when its preferred action changes under a modest alteration to switching cost, legal pathway or implementation effort. Such a schedule would show which assumptions drive a choice and which documents or conversations could resolve them. It should distinguish a verified contract term, an account manager's assessment, a management estimate and an unresolved fact. The buyer can then choose whether to obtain more information, make a reversible intervention or accept the remaining exposure within its approval policy.
The exposure score awards one authored point when an observed second source is present, aligning that direction with the positive second-source pressure term in the generator. Its integer weights are uncalibrated and are not fitted to customer outcomes. An empirical implementation would need a separately defined development and evaluation process. The available package leaves the second source unchanged, so identifying exposure through this field does not establish that the package can save the associated revenue.
Equation 3 applies when W_orc exceeds W_rand. If all intervention benefits are zero or equal so that the denominator is zero, the normalised capture measure is undefined and should not be reported as zero. Expected random selection has W_rand=(K/n) times the sum of account benefits, with K selected from n accounts. It is a reference rather than a lower bound: a weak selection can have negative capture, and an individual random draw can lie above or below its expectation. The fully informed bound assumes separable benefits and the same fixed count for every rule.
14 Comparing Selection Rules at Fixed Capacity
Table 7 reports results at a capacity of 60 accounts. Capture is calculated book by book and averaged; it is not generally the ratio obtained from average benefits. Expected random selection saves USD 0.579 million of annualised revenue per book before implementation cost, compared with USD 4.277 million for the fully informed benchmark. Revenue ranking reaches USD 2.493 million and 51% of above-random headroom; contract ranking reaches USD 3.243 million and 72%. Relationship dependence captures 62% and exposure points 65%. Across-book central ninety per cent ranges are 34% to 66% for revenue ranking and 51% to 77% for points. These ranges describe variation in the authored books, without estimating uncertainty for an observed acquisition.
| Selection rule | Gross protection benefit, USD million per book | Share of all expected loss held | Above-random headroom captured | 5th to 95th percentile of capture |
|---|---|---|---|---|
| Random order | 0.579 | 10% | n/a | n/a |
| Revenue rank | 2.493 | 43% | 51% | 34% to 66% |
| Contract-rights list | 3.243 | 31% | 72% | 56% to 84% |
| Relationship dependence | 2.901 | 31% | 62% | 46% to 75% |
| Exposure points | 3.013 | 47% | 65% | 51% to 77% |
| Exposure oracle | 3.698 | 53% | 84% | 77% to 90% |
| Saveable oracle | 4.277 | 44% | n/a | n/a |
Constructed model output. Gross annualised revenue saved before delivery cost, USD million per book. Capture is (rule minus expected random) divided by (fully informed benefit minus expected random), averaged over 300 books. The range describes the authored book distribution, not a field confidence interval.
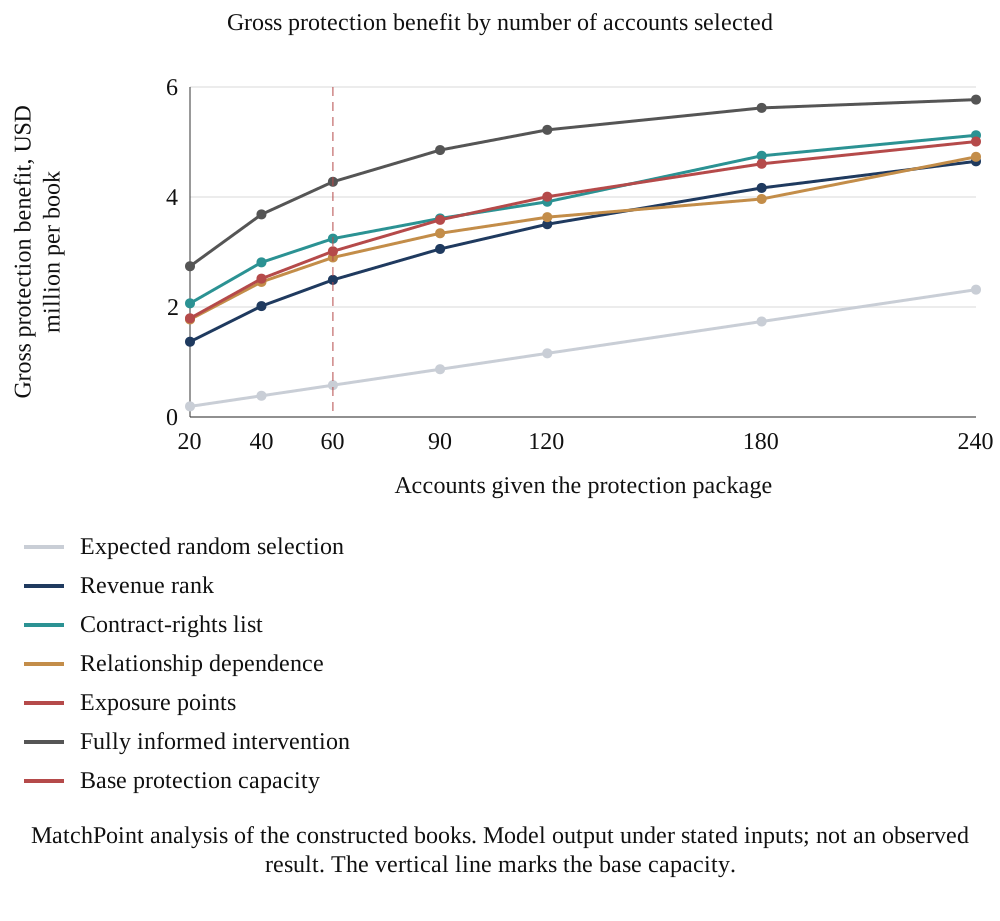
MatchPoint analysis of the constructed books. Model output under stated inputs; not an observed result. The vertical line marks the base capacity.
The exposure benchmark holds 53% of expected loss and reaches 86% of the fully informed intervention benefit; the intervention optimum holds 44% of loss. Those are different objectives. Revenue ranking holds 43% of loss and captures 51% of above-random intervention headroom. Exposure points hold 47% and capture 65%, while the contract rule holds 31% and captures 72%. A high share of loss under review does not by itself establish that the chosen package can recover it.
The base ranking result depends on the defined intervention and measurement system. Contract evidence is complete in the baseline and the package multiplies consent pressure by 0.30 and owner-related pressure by 0.25. Those term multipliers are not probability reductions, measured intervention effects or proof that consent has legally been obtained. The practical rules use authored weights and noisy relationship observations. A transaction team can test whether the assumed actions and information are available before considering the ranking. The isolated no-consent-effect sensitivity below shows that changing one mechanism can reverse the ordering.
Paired comparisons retain the same book for each rule. Points, contract ranking and relationship dependence outperform revenue ranking in 100%, 95% and 85% of books, respectively. Contract ranking outperforms points in 76%, while relationship dependence outperforms points in 43%. These are conditional simulation frequencies. The dependence and points rules should not be described as equivalent solely from overlapping ranges. The stress cases change their ordering, and the capacity comparison in Figure 3 changes the question from selecting sixty accounts to selecting a larger share of the book.
A further mechanism sensitivity holds the books, capacity and all other package assumptions fixed while changing the consent-term multiplier from 0.30 to 1.00, removing that intervention effect. Gross benefits per book become USD 0.873 million for contract ranking, USD 1.319 million for revenue ranking, USD 1.606 million for points and USD 2.232 million for relationship dependence. The base contract-rule lead reverses. This authored boundary supports making the proposed intervention explicit before adopting a ranking. It does not estimate how often consent work succeeds or how effective a commercial continuity action is in practice.
15 The Economics of an Account-Level Price Waiver
The price decision uses a separate consistent revenue comparison. V_i is annual revenue before uplift, L_i(u_i) the expected exposure with the uplift and L_i(0) the exposure with no uplift. Expected revenue retained under the uplift is multiplied by 1+u_i/100. The comparison includes exit and reduced wallet among surviving accounts. It is evaluated without the continuity-consent package. Margin, delivery cost, timing of cash collection and customer lifetime value remain outside this annualised revenue test.
In Equation 4, G_i=L_i(u_i)-L_i(0) is the reduction in exposure from waiving the uplift. Expected retained revenue with the waiver is R_i(0)=V_i-L_i(0); with the uplift it is R_i(u_i)=(1+u_i/100)[V_i-L_i(u_i)]. Their difference equals G_i minus (u_i/100)[V_i-L_i(u_i)]. A positive difference favours the waiver on this revenue basis. The right-hand charge is therefore uplift that would be collected on retained purchases under the uplift, including the effect of wallet reduction. Charging uplift on gross no-uplift survival would answer a different question.
Across the same 300 waiver books, 45% of uplifted accounts have a positive expected revenue difference from the waiver. They hold 45% of planned uplift value measured on the original annual-revenue base. Gross exposure saved averages USD 3.479 million per book, while uplift collected under the uplift path averages USD 3.126 million. Their difference is USD 0.352 million in favour of a blanket waiver under these particular inputs; the charge-to-gain ratio is 0.90. This is a simulated annualised revenue result before implementation costs and margin. It does not establish that a blanket price freeze is commercially optimal. An account-level decision can also differ once contribution margins, delivery effort, negotiation and repeat pricing behaviour enter the comparison.
16 Stress Cases and Changes in Rule Ordering
Four stress cases change one feature of the base books. Aggressive repricing raises the share of accounts reached and the size of the uplift. Sales-team attrition raises the owner-change rate to sixty per cent and the share of changes that are departures to sixty per cent. Consent-heavy contracts raise the share of accounts with a consent right to forty per cent. A 70% register leaves the books unchanged but lets the buyer read only seven in ten contracts. Table 8 reports the loss and its mix, and Table 9 the capture of the four practical rules.
| Case | Annualised exposure, % revenue | Deal-attributable, % revenue | Of it, by month 3 | Price share | Owner change and departure share | Consent share |
|---|---|---|---|---|---|---|
| Base | 13.6% | 6.6% | 35% | 26% | 28% | 31% |
| Aggressive repricing | 16.7% | 9.8% | 26% | 45% | 21% | 23% |
| Sales-team attrition | 15.6% | 8.7% | 31% | 21% | 41% | 25% |
| Consent-heavy contracts | 16.5% | 9.3% | 47% | 21% | 23% | 44% |
| Register 70% read | 13.6% | 6.6% | 35% | 26% | 28% | 31% |
Constructed model output under authored inputs. Exposure, attribution and timing are averaged over 100 books per case. The selection comparison in Table 9 uses 300 books. Independently drawn base summaries can therefore differ from earlier tables.
| Case | Revenue rank | Contract-rights list | Relationship dependence | Exposure points |
|---|---|---|---|---|
| Base | 49% | 72% | 62% | 64% |
| Aggressive repricing | 50% | 72% | 62% | 64% |
| Sales-team attrition | 55% | 66% | 69% | 70% |
| Consent-heavy contracts | 58% | 82% | 60% | 72% |
| Register 70% read | 49% | 53% | 62% | 61% |
Constructed model output under authored inputs. Capture is the gain between the random and fully informed intervention benchmarks at a capacity of 60 accounts, averaged over 300 books per case. The draws differ from Table 7.
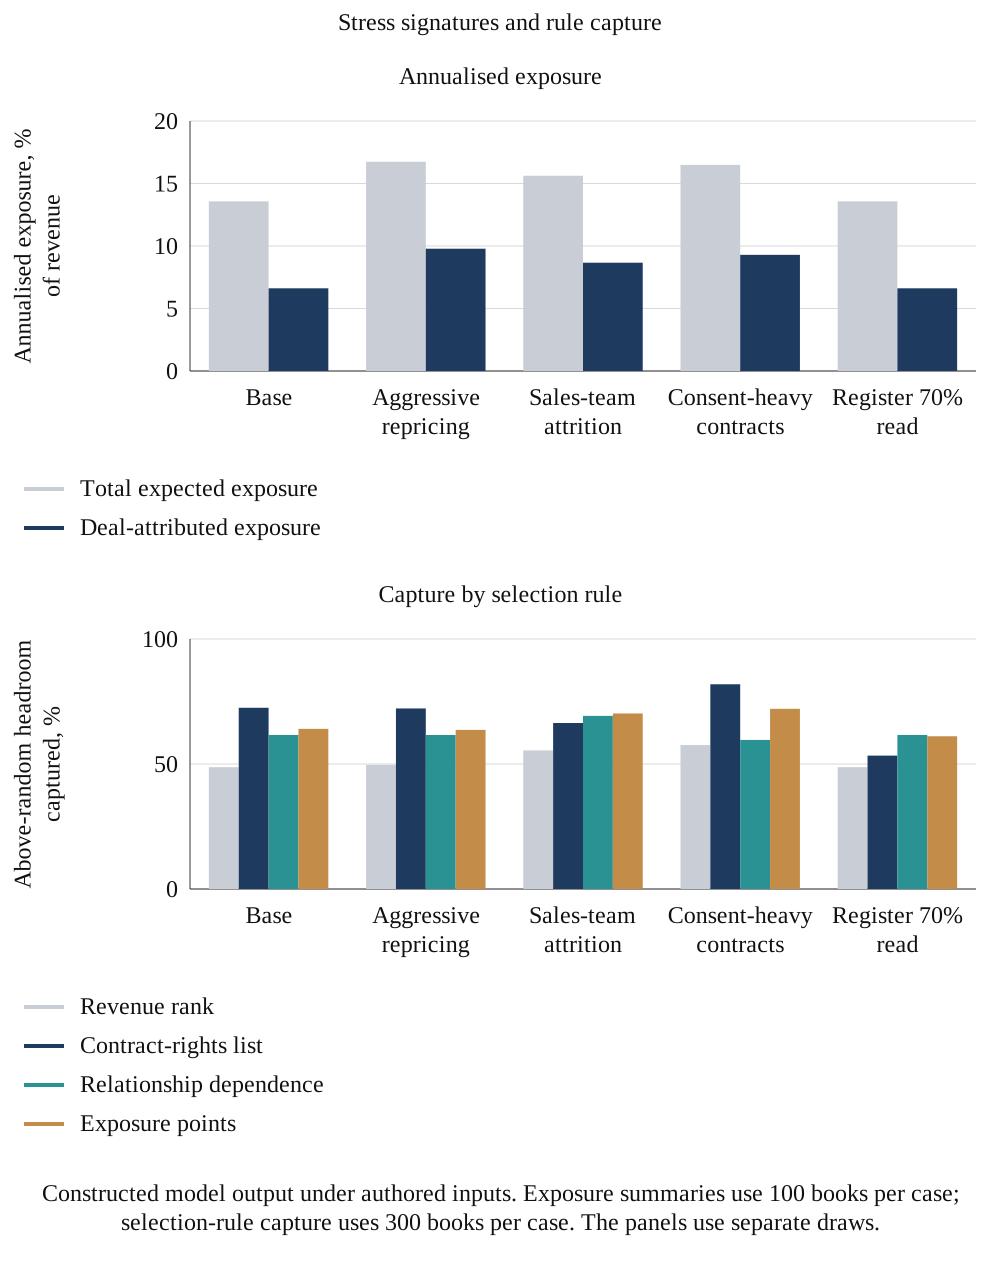
Constructed model output under authored inputs. Exposure summaries use 100 books per case; selection-rule capture uses 300 books per case. The panels use separate draws.
Figure 4 shows both panels. Each case has a diagnostic. Aggressive repricing lifts the expected loss from 13.6% to 16.7% of revenue and the price share of the deal-attributable loss from 26% to 45%, while the rule capture barely moves. Attrition lifts the owner-change and departure share from 28% to 41% and moves the lead to the dependence and points rules. Consent-heavy contracts move 47% of the deal-attributable loss into the first three months and raise the contract list's capture to 82%. The 70% register leaves the loss unchanged and lowers the contract list's capture from 72% to 53%.
The stress outputs provide candidate explanations to examine against a transaction log. Base deal-attributed exposure is 6.6% of annual revenue, compared with 9.8% under aggressive repricing, 8.7% under attrition and 9.3% in the consent-heavy case. Early loss and a high consent share occur together because the experiment assigns consent pressure to an early window. Similar timing in an observed transaction would require evidence separating consent from service disruption, buyer actions and other events. The constructed attribution labels cannot establish the cause of an observed exit.
The cases are changed one at a time, and two of them reverse the ordering of the practical rules: attrition puts the dependence rule ahead of the contract list (69% against 66%), and the 70% register puts both the dependence rule and the points ahead of it. A transaction may contain several interacting changes. This experiment has not tested their joint timing or demonstrated an observed two-wave exit pattern. The separate cases can inform competing hypotheses for a dated event log. Attribution in a live transaction would require its own comparison and assessment of concurrent events.
17 Contract-Register Coverage and Information Quality
The contract-rights list is only as good as the register behind it. In the model, an unread consent right looks like a free-transfer contract. Figure 6 (coverage panel) varies the share of contracts read, on a separate draw of books, so the full-register value differs by a point from Table 7. The contract list captures 50% of the achievable gain when no contract is read, which is close to the revenue rank because the list then reduces to revenue order, falls to 40% when half are read and rises to 63% at 85% and 73% when all are read. The exposure points score changes from 56% to 65% over the same range.
The dip reflects the combination of a rigid priority rule and selective visibility of rights. When half the contracts are read, every known consent-right account receives priority, including small accounts, ahead of larger unread accounts. It does not show that information itself is harmful. In the tested coverage grid, the contract rule first exceeds the directionally corrected points rule at complete coverage. The eighty-five-per-cent row should not be treated as a universal threshold. A proposed operational response is to retain Unknown states, report revenue-weighted coverage and evaluate how a review queue changes decisions before adopting a fixed reading order.
Machine reading of contracts could widen coverage, and its value would be measured by recall on consent and termination clauses in a sample checked by lawyers. The experiment does not test any such tool and reports no accuracy. It shows only that coverage is a first-order input to the value of the contract list. Coverage should also be reported by value: reading the largest hundred contracts may cover most of the revenue and few of the accounts, and the ranking of the remainder then relies on the other signals.
Operationally, an unread agreement should remain Unknown. The stress experiment deliberately maps an unread consent right to the free-transfer category to test a harmful information failure. A live register should retain separate states for document missing, document received, extraction pending, clause unclear, counsel reviewed and action completed. Combining these states with a negative consent flag would hide the very uncertainty the stress case exposes. Coverage can be reported by account count, annual revenue, concentration tier and upcoming decision date, with the denominator and document version recorded.
A proposed review queue can prioritise an unresolved high-value agreement close to its consent or notice deadline, while preserving lower-value customers whose legal or operational dependency makes delay consequential. The model does not calculate the value of information or prove an optimal reading order. To test a queue, the team could record the prior uncertainty, review effort, resulting classification and whether the new information changed the planned action. That creates evidence of decision value without treating the number of documents processed as a retention outcome.
18 Selective Repricing and Observational Estimates
Selective price assignment can distort an observational comparison. This model assigns uplifts more often to accounts with higher constructed loyalty, whose exit propensity is lower through another term. The resulting treated-versus-untreated difference understates the model effect under the chosen inputs. A live pricing policy may select customers for different reasons, so the direction of bias requires evidence about its actual allocation process. The experiment specifies one mechanism to make that identification problem visible.
In Equation 5, U_i is uplift assignment, gamma_0 and gamma govern its probability and ell_i is constructed loyalty. H counts only proxy-loyalty quintiles containing at least two uplifted and two non-uplifted accounts. Within those retained groups, n_g^1 counts uplifted accounts and y_g^1 and y_g^0 are the two mean exit rates. The denominator sums the retained uplifted count. Omitted strata can change the population represented by the estimate relative to the all-uplifted model effect. Reference [12] identifies the original propensity-score literature as methodological background; this experiment stratifies directly on a noisy loyalty proxy and neither estimates a propensity score nor verifies control of confounding.
| Assignment strength | True effect, points | Naive, large book | Stratified on proxy | Stratified on true loyalty | Naive, 600 accounts, 5th to 95th | Stratified, 600 accounts, 5th to 95th |
|---|---|---|---|---|---|---|
| 0.0 | 5.36 | 5.61 | 5.61 | 5.61 | 1.4 to 9.6 | 1.3 to 9.4 |
| 2.2 | 5.18 | 4.41 | 4.85 | 5.11 | -0.2 to 8.4 | 0.2 to 9.1 |
| 4.0 | 4.90 | 3.49 | 4.17 | 4.79 | -0.9 to 7.7 | 0.0 to 8.6 |
MatchPoint analysis of the constructed books. Model output under stated inputs; not an observed result. Percentage points of exit probability. The large book has 60,000 accounts; the small books have 600, 300 repetitions.
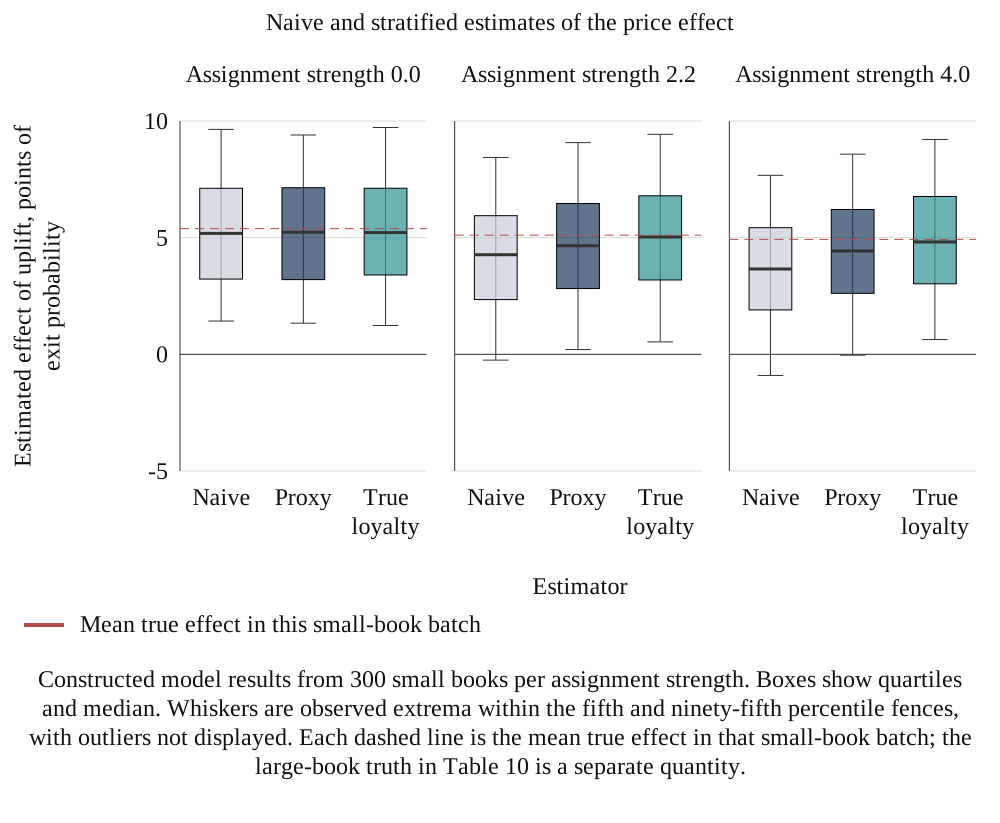
Constructed model results from 300 small books per assignment strength. Boxes show quartiles and median. Whiskers are observed extrema within the fifth and ninety-fifth percentile fences, with outliers not displayed. Each dashed line is the mean true effect in that small-book batch; the large-book truth in Table 10 is a separate quantity.
Table 10 and Figure 5 compare estimators under the specified assignment mechanism. With no loyalty-assignment link, the large-book naive estimate is 5.61 points against a true effect of 5.36. At the base strength, the true effect is 5.18 points, the naive estimate 4.41 and the proxy-stratified estimate 4.85; the latter closes 57% of the naive error for that draw. With stronger selection the naive estimate is 3.49 against 4.90, and the proxy closes 48%. Adjustment using true loyalty gives 5.11 at the base strength. It is an information benchmark available inside the simulation, not a statistical ceiling: grouping can leave residual imbalance and realised estimates retain sampling error. Other assignment and confounding mechanisms may produce different biases, including sign reversals; they are outside this experiment.
19 Sample Size, Uncertainty and Identification
Smaller account logs produce wider estimate distributions in this constructed experiment. Table 11 repeats the stratified estimate for logs of 100 to 1,600 accounts with 400 repetitions each. With 100 accounts the 5th to 95th percentile range is 21.9 points wide, and 24% of estimates are at or below zero although the true effect is positive. With 400 accounts the range is 10.2 points and 7% of estimates are at or below zero. With 800 accounts the range runs from 1.3 to 8.3 points and excludes zero, and with 1,600 accounts it is 5.4 points wide and 0% are at or below zero.
| Accounts | Mean stratified estimate, points | 5th to 95th percentile | Width, points | Estimate at or below zero | Within half of the true effect |
|---|---|---|---|---|---|
| 100 | 4.84 | -5.1 to 16.8 | 21.9 | 24% | 30% |
| 200 | 4.52 | -3.3 to 13.0 | 16.3 | 20% | 38% |
| 400 | 4.64 | -0.4 to 9.8 | 10.2 | 7% | 58% |
| 800 | 4.85 | 1.3 to 8.3 | 7.0 | 1% | 74% |
| 1600 | 4.69 | 2.0 to 7.5 | 5.4 | 0% | 86% |
Constructed results from 400 independent-account repetitions per tested size. Central simulation ranges describe the estimator distribution, not confidence intervals for one field log. Widths use full-precision endpoints before rounding. The within-half metric compares each estimate with the mean true effect for that sample-size block.
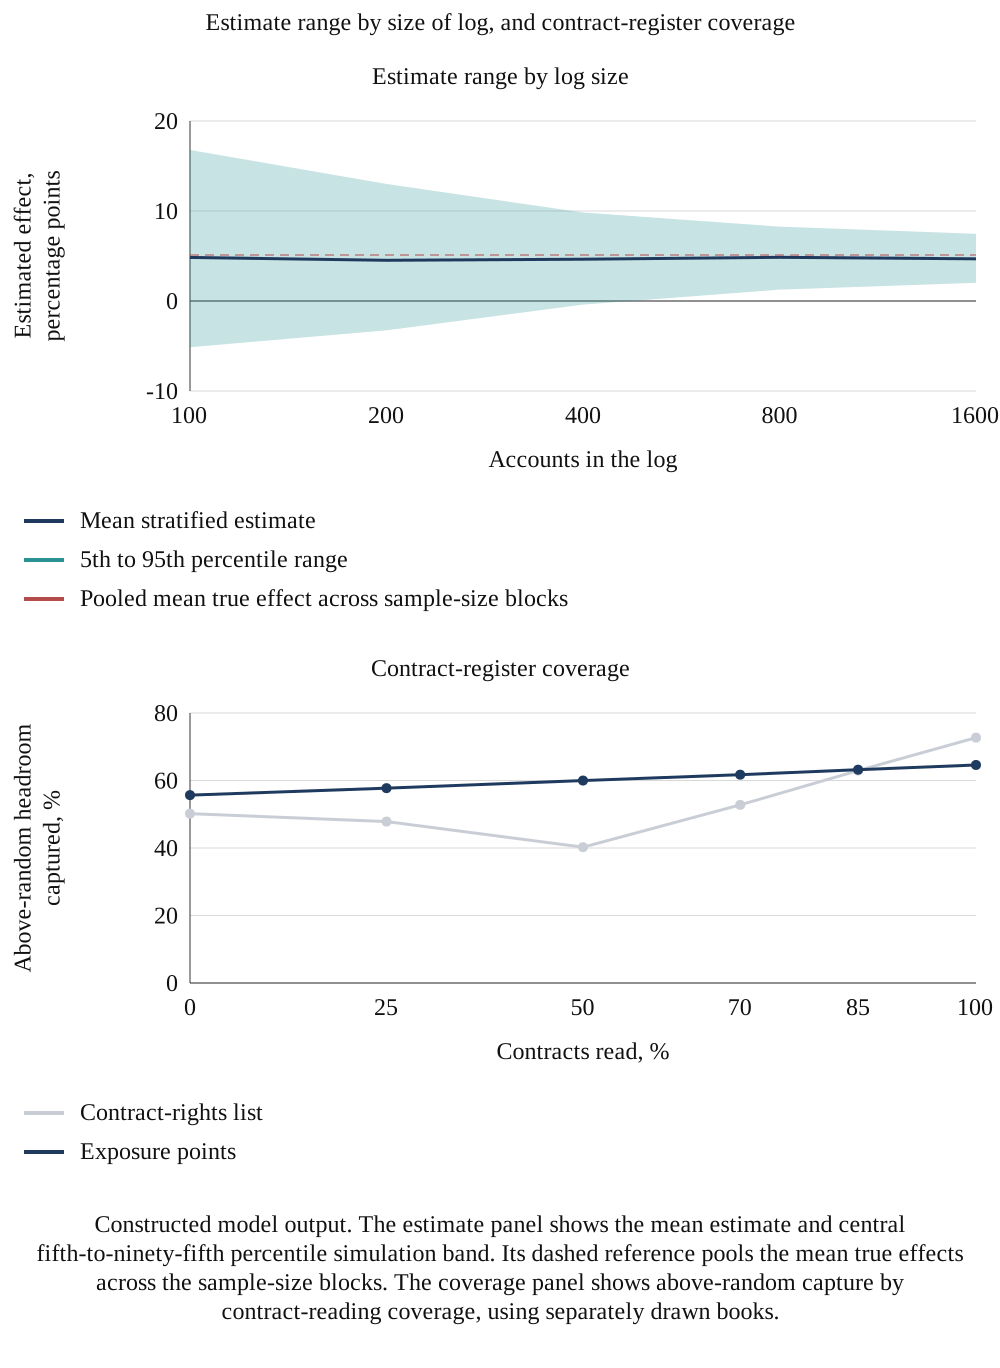
Constructed model output. The estimate panel shows the mean estimate and central fifth-to-ninety-fifth percentile simulation band. Its dashed reference pools the mean true effects across the sample-size blocks. The coverage panel shows above-random capture by contract-reading coverage, using separately drawn books.
Sampling uncertainty and identification both matter. With 400 accounts the constructed mean estimate of 4.64 points is near its model truth, while 58% of estimates fall within half of that truth. This is a property of the specified effect, event rates, assignment and estimator. It cannot establish a universal requirement of 800 accounts or show that bias is negligible in an observed book. A reported price effect should include its comparison group, uncertainty interval, overlap diagnostics and confounding assumptions. Pooling acquisitions can increase the count while introducing differences in customer mix, policies and reporting; deal indicators alone do not resolve those differences.
The support rule also matters at small sample sizes. In a separate exact readback of the hundred-account block, eleven of four hundred replications omit at least one quintile because it lacks two treated or two comparison accounts. Mean retained treated coverage is approximately 99.92%, with a minimum of 96.67%. These are diagnostics of this constructed block. The estimator renormalises to the retained treated population; it does not recreate outcomes for omitted support. A real study should report its own exclusions and the corresponding change in target population, with a sensitivity assessment where the excluded accounts are commercially material.
20 Reproducibility Controls and Model Boundaries
The outcomes in the model are generated from the same features that the rules use. The rules are therefore tested against a world in which their premise is true: that consent rights, owner dependence, price and conflict drive exit. The results show how much each rule recovers if that is so, how the ordering changes under stated stress, and how much a real log would be distorted by the way price increases are assigned. They do not show that consent rights or owner changes drive exit in any real book, and they provide no rate of customer loss.
The corrected numerical engine executes 1,545 assertions in 41 message families, summarised in Table 12. Most are repeated conditions within book-level loops. They check ranges, specified dominance comparisons, attribution reconciliation, timing allocation, stress direction, the price-waiver identity and restoration of the consent multiplier after its isolated sensitivity. These source assertions are separate from independent arithmetic review. They test the stated calculations and chosen seeded cases, with no comparison against observed customer outcomes or proof that the model premises hold in practice.
| Control | Result |
|---|---|
| Assertions passed | 1,545 in 41 families |
| Probabilities and losses | Every exit probability lies in the unit interval; every expected loss lies between zero and revenue |
| Reconciliation | Revenue and loss by pathway sum to the totals; driver shares sum to one; timing curves end at the attributed loss and never fall |
| Protection | The package never raises expected loss in any account |
| Dominance | At the base capacity, the fully informed intervention benefit dominates each rule in every book; capacity-sweep means also satisfy the bound |
| Reference normalisation | Capture is one for the fully informed selection and zero for expected random selection; weaker selections may be negative |
| Stress directions | Repricing raises the price share; attrition raises the owner share; consent-heavy contracts bring losses earlier; an unread register lowers the contract list's capture |
| Constructed adjustment checks | Seeded naive and adjusted estimates satisfy the specified closeness comparisons; these checks establish no universal ranking of estimators |
| Sample size | The estimate range narrows at every step in the size of the log |
| Repeatability | The same seed yields the same books |
| Price-waiver identity | Expected no-uplift revenue minus expected uplift revenue equals exposure saved minus uplift on purchases retained under the uplift |
| Mechanism boundary | Removing consent attenuation while holding other inputs fixed reverses the base contract-rule lead in this generator |
Reproducibility checks in the retained numerical engine. A passed assertion verifies the stated calculation within the authored model; it is not empirical validation. Runtime depends on the execution environment.
This experiment evaluates the behaviour of a stated system. Its practical contribution is a reproducible separation of annualised exposure, intervention benefit, contract-register information and repricing selection. Model percentages should be cited as conditional simulation outputs with their inputs. The arithmetic controls do not validate the legal reading, coefficient choices, the effectiveness of an intervention or its suitability for a live acquisition. Those questions require the evidence and professional review described in the following sections.
21 A Prospective Customer-Retention Evidence Design
The proposed observational unit is the account at completion, followed monthly through an agreed horizon, initially eighteen months to align with the model. The register would link contract basis, consent events, notices, price effective dates, owner changes, purchase reductions, exits and revenues using stable identifiers. Data access and reuse require a lawful basis and purpose assessment [4]. The scenario-specific sample-size results in Table 11 are planning illustrations. A live study requires its own assessment of effect size, event incidence, overlap, account and deal clustering, attrition and the intended estimator before a target count is selected.
Table 13 proposes an evidence design with assignment decisions recorded before outcomes are inspected. Where the buyer, legal advisers and commercial leadership consider it appropriate, eligible accounts could enter a prospectively approved comparison of usual practice and a defined additional action. Any randomisation would require a defensible eligibility policy, customer safeguards and suitable approvals. When allocation is observational, the register should record the reasons for intervention, including expected loyalty, strategic importance, relationship concerns and capacity restrictions. Adjustment can use measured reasons; unmeasured differences remain a limitation.
| Element | Specification | Reason |
|---|---|---|
| Unit and window | Account, from completion to month 18, with monthly revenue | Matches the outcome definition |
| Triggers | Dated consent, price and owner events with type | Separates the three clocks |
| Contract data | Clause-level extraction checked by lawyers, with coverage reported | Register completeness drives the value of the list |
| Baseline | Matched accounts from an unaffected book or the pre-deal period | Supports comparison with background changes, subject to the validity of the comparison |
| Assignment | Randomised slice of eligible accounts; otherwise recorded reason | Supports assessment of selection; recorded reasons alone do not establish comparability |
| Sample and effective information | Prospective power and precision analysis using transaction-specific event rates, overlap and clustering; 800 is only a constructed scenario result | Raw account count does not establish identification or precision |
| Consent and privacy | Lawful basis, purpose limitation, anonymised analysis file | Data-protection law |
| Analysis plan | Prespecified outcomes, estimators, uncertainty intervals, holdout ranking and sensitivity analyses | Makes later changes and selective reporting visible |
Proposed design. No such study has been run by the author.
Data and AI methods are candidates for assisting clause extraction, account linkage and contact-dependence review. Each task needs a defined benchmark and an authorised data route before its output enters the decision process. The model evaluates no software, extraction accuracy or productivity benefit. The workflow below specifies proposed acceptance controls for a future deployment; it makes no empirical claim about a particular tool.
For AI-assisted contract work, counsel should first define a clause taxonomy that separates assignment of rights, transfer of obligations, change of control, termination, renewal, pricing notice and confidentiality or data-use restrictions. The extraction record should carry the exact quoted passage, page or paragraph locator, document identifier, counterparty legal entity and version date. A summary without its supporting passage cannot establish that a right exists, that no restriction exists or that an amendment has superseded it. The final legal classification remains subject to the designated reviewer.
A proposed benchmark would use a held-out set of agreements independently reviewed to an agreed standard. It would assess missed material clauses, false positive flags, entity-linkage errors and unsupported conclusions separately. Performance should also be weighted by the value and timing of affected decisions. A high overall extraction score can coexist with a missed clause on a concentrated customer. The workflow should permit abstention and escalation when a scanned page is unreadable, cross-references are unresolved or the documents conflict. No benchmark score or efficiency estimate is supplied here.
An authorised deployment also needs access control, retention limits and a record of which contractual material may enter which system. Customer agreements and personal contact data should be minimised to the task, with approval for any external processing or cross-border route. Testing can begin with appropriately permitted material. Prompt and model versions, extraction changes and reviewer corrections can be logged so that a later account decision can be traced to the actual document and method used. These are proposed governance controls, with applicability requiring legal and information-security review.
Account linkage requires its own test. A legal entity may have several trading names, buying locations and finance-system codes, while a group may contain genuinely separate purchasers. The analyst should reconcile the account identifier against contracts, invoices and the agreed consolidation perimeter. Merging separate buyers can conceal differing consent rights; splitting one buyer can understate concentration. A proposed exception queue records uncertain matches, their supporting documents and the person authorised to resolve them. Linkage confidence should not be converted into a legal conclusion.
The prospective analysis should define exit, reduction in wallet, price concession and new-product revenue before follow-up begins. It should record acquisitions, divestments and changes in account perimeter during the window. A customer whose full eighteen-month follow-up is unavailable must have that limitation retained. Seasonal purchase patterns, exceptional orders, currency conversion and changes in invoicing entities can otherwise resemble behavioural change. The statistical plan should specify treatment of these observations and distinguish complete follow-up results from shorter-window interim reporting.
To assess an intervention causally, the comparison requires a reason that otherwise comparable accounts experienced different treatment. The recorded allocation rule, treatment date and eligibility criteria support that assessment. Balance and overlap checks can identify observed differences and poorly represented groups; they cannot rule out unrecorded selection. Inference should account for common shocks within accounts, sales teams and acquisitions where relevant. A prespecified sensitivity analysis can vary outcome definitions, windows and comparison groups, with changes and missingness disclosed. Transaction-specific review is needed to choose estimators and intervals.
An out-of-sample ranking test can separate learning from evaluation. The rule and intervention definition should be fixed using the designated development data, then assessed on accounts or acquisitions kept outside that process. Reporting should include the capacity constraint, treatment actually delivered, missing register fields and uncertainty around the gain. A ranking that identifies high exposure has answered a different question from a ranking that identifies a causal response to protection. The empirical design must preserve that distinction before claiming an intervention benefit.
22 Board Reporting and Transaction Decisions
A board or investment committee report can show annualised exposure and intervention options separately, alongside revenue by contract pathway, consent status and register coverage. It should identify material concentrations using the applicable reporting basis [5] and show the action, owner, cost and remaining uncertainty for each proposed tier. In the constructed attribution, consent carries 30% of deal-associated exposure, owner changes 23%, departure-follow pressure 5%, price 26% and channel conflict 15%. Those shares describe the authored decomposition and are not an empirical breakdown of a buyer's customers.
Table 14 lists the items. The report should present the loss as a range with its identification status. If the buyer has estimated a price effect from its own log, the range should be shown with the size of the log, and the report should state that increases may have been assigned to loyal accounts. If the estimate comes from another deal, that fact should be stated. A figure such as a retention target should be labelled as a plan, with the assumptions listed, and not as a forecast.
| Item | What to state | Why it matters |
|---|---|---|
| Contract coverage | Share of revenue under contracts that have been read, by pathway | Unread contracts look free of consent rights |
| Consent exposure | Revenue with a consent or termination right on change of control and its status | Largest source of early exits in the model |
| Owner dependence | Revenue where the owner changes and dependence is high, with restraint terms | Follow and continuity risk |
| Price | Planned uplift by account, effective dates and break-even test | Synergy against retention |
| Capacity and rule | Accounts protected, selection rule and what it ignores | Exposure is not saveability |
| Identification status | Whether effects come from this book, another deal or assumption | Avoids a point estimate presented as proof |
Proposed reporting items. The items describe information to present, not findings.
The exposure map also bears on the terms of the transaction. Where a named large account holds a consent right, counsel may consider whether obtaining that consent should be a condition of completion, whether part of the price should depend on it, or whether the seller should bear a defined share of the loss if the customer leaves within a stated period. These are options to be assessed by the parties and their advisers. The model supplies the size of the exposure that each option would address under its inputs, and it does not indicate which option is appropriate.
A proposed board bridge connects the commercial record to the deal model in stages: annualised revenue exposure, expected contribution impact, proposed intervention cost, timing and remaining uncertainty. It can show management's base, adverse and recovery assumptions without presenting them as observed outcomes. Where the same expected improvement already appears in a sales synergy or procurement-funded service initiative, the bridge should identify that linkage so the deal case does not count it twice. This paper offers the structure, with no quantified enterprise-value or financing benefit.
For concentrated accounts, transaction parties may discuss conditions, consents, price mechanics, representations or a defined allocation of loss with their advisers. The choice depends on enforceability, negotiating power, transaction economics and what can actually be observed during the relevant period. A customer leaving after completion does not by itself establish that the seller breached an obligation or that the transaction caused the loss. Any contractual metric should define the account perimeter, measurement period, exclusions, dispute process and responsibility for commercial decisions. The model does not recommend particular legal terms.
23 A Proposed Retention Operating Sequence
A proposed operating sequence begins with the contracts of material accounts, reviewed for consent, termination and assignment terms where access and transaction-stage restrictions permit. The team would record document coverage and unresolved questions before relying on the investment-case assumptions. It would also identify accounts with a concentrated personal relationship and a planned owner change, name a proposed continuity owner and obtain advice on any departing representative's restraint terms under the applicable labour regime [2, 3]. The experiment has not established an optimal live-transaction sequence.
The proposed third step is an account-level pricing review. A second source or low switching cost motivates closer investigation of customer alternatives; neither establishes that an uplift should be waived. The buyer should compare the expected contribution under each feasible price path with implementation costs and uncertainty. The fourth step is to log the events and decisions from inception. In this model a waiver clears the stated revenue comparison for 45% of uplifted accounts. That result is conditional on its coefficients and baseline pricing assumptions, with no promise of retention.
At the tested capacity of a tenth of the book, the base contract ranking leads the other practical rules under the stated package and complete-register assumptions. This result can motivate a proposed account-review plan using contract evidence, relationship dependence, revenue and documented uncertainty. A live allocation requires evidence about the action actually available, delivery resources and register quality. The no-consent-effect and incomplete-register sensitivities show that the base ranking is conditional. The experiment supplies no universal account-selection sequence or finding that delivery cost necessarily becomes the binding constraint at a larger capacity.
| Workstream | Accountable role | Evidence and handoff |
|---|---|---|
| Contract pathway and consent | Legal lead | Reviewed clauses, governing-law qualification, required action and deadline |
| Relationship continuity | Commercial lead | Named account owner, transition plan, customer contact authority and completion evidence |
| Price-path economics | Finance lead | Consistent retained-revenue and contribution comparison, concessions and approval |
| Data and AI-assisted review | Data owner with legal and security review | Permitted inputs, linked document evidence, benchmark exceptions and human sign-off |
| Integration coordination | Integration lead | Dependencies, action capacity, escalation and dated status |
| Investment-case reconciliation | Deal sponsor | Exposure, delivery cost, financing assumptions and any overlap with synergy claims |
Illustrative operating design for transaction-specific adaptation. Roles are proposed responsibilities, not a description of an implemented client programme.
The sequence can be organised around transaction gates rather than a single completion date. Before signing, the team identifies material contracts, unresolved access questions and assumptions in the investment case. Between signing and completion, it records any permissible consent or transition actions, respecting applicable information-sharing restrictions. At completion, responsibility for account ownership and unresolved actions is confirmed. During the first reporting cycles, actual notices, concessions and purchasing behaviour are compared with the dated baseline. This timetable is a proposed operating method, without a claim that every transaction permits pre-completion customer contact.
Exceptions need an owner and an expiry date. A temporary second account owner, delayed price change or unresolved consent should specify who reviews it next and which evidence closes it. Commercial leadership can then see whether scarce capacity remains tied to an obsolete assumption. Finance can reconcile delivered actions to their actual cost, while legal and data owners retain the limits on what may be done. Periodic review should preserve the original decision record so that changed facts and changed judgement remain distinguishable in the eventual outcome analysis.
24 Limitations and the Next Empirical Test
The books use authored coefficients, distributions, timing windows and fixed intervention multipliers. The logistic form, independence assumptions and simplified contract pathways leave out operational and legal complexity. Annualised revenue exposure is not cumulative cash flow, customer lifetime value or margin. The core package has no implementation cost in the experiment. Neither exit behaviour nor wallet reduction is empirically calibrated. The legal discussion concerns cited texts and requires transaction-specific review of governing law, transitional issues, sector rules and the actual agreements.
This review covers a selected source corpus. The business-to-business studies concern salesperson changes; the bank-merger studies examine relationship status and borrower value. Their results use different populations and outcomes from this paper's annualised revenue exposure. Some references were reviewed as accepted manuscripts or working papers, and selected journal abstracts supply narrower claims. The dated IFRS examples serve an account-record purpose, with no current transaction-accounting opinion. The experiment derives no empirical acquisition-churn estimate from these sources and makes no claim that the review exhausts the literature.
The next empirical step is a prospectively governed account register for a defined acquisition cohort, with permissions, linkage controls and an analysis plan agreed before outcomes accumulate. Its sample and follow-up requirements should be estimated for that cohort. The first tests would examine the assumed consent and relationship mechanisms, the feasible intervention effect and how a register-based ranking performs on held-out accounts. Results could support revising the authored coefficients. An observed improvement would still need its comparison, costs and attribution limits reported before it informs another transaction.
References
- United Arab Emirates. Federal Decree-Law No. (25) of 2025 Promulgating the Civil Transactions Law, issued 1 October 2025, effective 1 June 2026. Promulgating Articles 2 and 3; attached Articles 4, 19, 405-407, 418 and 419. Official English text; Arabic prevails in interpretation and application. https://uaelegislation.gov.ae/en/legislations/4011/download
- United Arab Emirates. Federal Decree-Law No. (33) of 2021 Concerning Regulating Labour Relations, as amended, Articles 3 and 10. Effective 2 February 2022. Official portal English text; Arabic prevails in interpretation and application. https://uaelegislation.gov.ae/en/legislations/1541
- United Arab Emirates Cabinet. Cabinet Resolution No. (1) of 2022 on the Executive Regulations of Federal Decree-Law No. (33) of 2021, Article 12. MOHRE-hosted English version marked 'Not an official translation'. https://www.mohre.gov.ae/assets/download/46bdbfda/Cabinet%20Resolution%20_Executive%20Regulations%20Decree-Law%20No.%2033.pdf.aspx
- United Arab Emirates. Federal Decree-Law No. (45) of 2021 Concerning the Protection of Personal Data, Articles 1, 2, 4-6 and 28-31. Effective 2 January 2022. Official portal English text; Arabic prevails in interpretation and application. https://uaelegislation.gov.ae/en/legislations/1972
- Australian Accounting Standards Board. AASB 8 Operating Segments, compilation no. 3, compilation date 30 June 2021, incorporating amendments to 6 March 2020. Scope paragraphs 2-4 and major-customer disclosure paragraph 34; incorporates IFRS 8. Official portal operative period: reporting periods beginning on or after 1 July 2021 and before 1 January 2027. https://standards.aasb.gov.au/aasb-8-mar-2020
- IFRS Foundation. IFRS 3 Business Combinations: examples accompanying the standard, January 2012 version, paragraphs IE26-IE28. These supporting examples accompany, and are not part of, IFRS 3. https://www.aasb.gov.au/admin/file/content105/c9/IFRS3_IE_1-12.pdf
- Degryse, H., Masschelein, N. and Mitchell, J. Staying, dropping, or switching: the impacts of bank mergers on small firms. National Bank of Belgium Working Paper No. 179, October 2009. The numerical estimates cited are from this working-paper version. Published as Review of Financial Studies 24(4), 2011, 1102-1140, https://doi.org/10.1093/rfs/hhp126. Working paper: https://www.nbb.be/doc/ts/publications/wp/wp179En.pdf
- Karceski, J., Ongena, S. and Smith, D. C. The impact of bank consolidation on commercial borrower welfare. Federal Reserve Board International Finance Discussion Paper No. 679, revised February 2004. The cited 1.8% subgroup estimate is from the revised working paper. Published in Journal of Finance 60(4), 2005, 2043-2082, https://doi.org/10.1111/j.1540-6261.2005.00787.x. Working paper: https://www.federalreserve.gov/pubs/ifdp/2000/679/ifdp679r.pdf
- Schmitz, C., Friess, M., Alavi, S. and Habel, J. Understanding the impact of relationship disruptions. Journal of Marketing 84(1), 2020, 66-87. https://doi.org/10.1177/0022242919882630. The main-result percentages cited are from the accepted manuscript, Results and Table 5, held by the University of Warwick: https://wrap.warwick.ac.uk/id/eprint/128885/1/WRAP-understanding-impact-relationship-disruptions-Habel-2019.pdf
- Shi, H., Sridhar, S., Grewal, R. and Lilien, G. Sales representative departures and customer reassignment strategies in business-to-business markets. Journal of Marketing 81(2), 2017, 25-44. https://doi.org/10.1509/jm.15.0358
- Homburg, C. and Bucerius, M. A marketing perspective on mergers and acquisitions: how marketing integration affects postmerger performance. Journal of Marketing 69(1), 2005, 95-113. https://doi.org/10.1509/jmkg.69.1.95.55510
- Rosenbaum, P. R. and Rubin, D. B. The central role of the propensity score in observational studies for causal effects. Biometrika 70(1), 1983, 41-55. https://doi.org/10.1093/biomet/70.1.41
- Matchpoint Partners. The Post-Acquisition Customer Continuity Office: Protecting Recurring Revenue through Integration. published English web edition, 2026. https://www.matchpoint-partners.com/our-insights/post-acquisition-customer-continuity-office.html
- Adya, C. Customer Retention during Integration: Detecting Churn before Revenue Falls. published English web edition, 4 September 2026. https://www.matchpoint-partners.com/our-insights/customer-retention-during-integration-detecting-churn-before-revenue-falls.html
About the Author
Chennakeshav (CK) is a corporate finance and investment banking executive with 25+ years of global experience in deal origination, structuring and execution across M&A, growth capital and corporate strategy. He has led value-creation mandates for founders, corporates and funds — bridging the boardroom view to hands-on execution and close.
His career spans Morgan Stanley, HSBC, Lloyds Banking Group, EWEC, ADQ portfolio companies and Emirates Growth Fund, across TMT, real estate, fintech, deeptech, cleantech, infrastructure and energy. He has partnered with C-suite leaders, private equity and venture funds, sovereign wealth funds and family offices to finance complex fund raises and scale-up ventures, and has led M&A due diligence, post-merger integration and business-transformation initiatives to create value.
At Matchpoint Partners he is Managing Partner, leading the firm's corporate finance, M&A and capital-raising practice. He holds an MBA from London Business School, an engineering degree from VTU and a Master of Laws (LLM, in progress) from UCL London.
An active start-up mentor, CK mentors at Techstars, DIFC FinTech Hive, Startup Grind, Founder Institute and IN5, serves as Entrepreneur Mentor in Residence (EMiR) at London Business School, and judges the Entrepreneurship World Cup.
https://www.linkedin.com/in/ckadya/
https://www.matchpoint-partners.com/team/ck-adya.html
Disclaimer
This paper is part of a continuing series on the structure of private and alternative markets. The views expressed are the author's own. The paper is for information only, describes market structure in general terms, and does not constitute investment, legal, tax or regulatory advice or a recommendation in respect of any security, vehicle or counterparty.
