

1 The decision is how much of an announced synergy case to pay for
A synergy figure is a claim about future cash flow. When a committee uses that claim to justify a price, it needs to ask what remains after a comparable baseline, implementation costs, timing and tax are accounted for. This paper proposes a procedure and examines its behaviour in a constructed setting. It reports no observed cohort of acquisition outcomes.
The title refers to several possible accounting overlaps. A saving may appear in two workstreams or already sit in the target's standalone plan. Revenue may be treated as profit, while implementation costs may be omitted or counted inconsistently. Their combined effect depends on the case. The paper separates these adjustments so their definitions and interactions can be examined.
The intended application is GCC M&A. The legal comparison is confined to the reviewed UK and Saudi provisions, and the tax context to the specified UAE rules. [1, 2, 6] The bounded public example is the FGB-NBAD merger. No GCC-wide search completeness or leakage rate is claimed. The paper proposes records for transaction analysis and compares six estimation rules in an authored experiment.
The proposed decision record starts with the amount of the acquisition price that management attributes to combination benefits. That amount should be identified separately from the standalone value, financing effects and any strategic option that the committee elects to support on another basis. Otherwise, an apparently favourable synergy calculation can answer a different question from the one used to approve the transaction. The paper therefore follows the claimed benefit through its baseline, cash consequences and price contribution. It leaves the valuation of the remaining business outside the experiment.
2 Count survival on run-rate, on after-tax value and on price coverage, at a stated date
The outcome has to be defined before any instrument is applied. We define the announced case as the run-rate cost synergy, the run-rate revenue synergy valued at the margin the announcement assumes, the announced phasing and the announced one-off cost. We define three survival measures. Run-rate survival is the pre-tax run-rate that remains after the baseline and attainment adjustments, divided by the announced gross run-rate. Value survival is the ten-year present value of the adjusted case after cost and tax, divided by the present value of the announced case. Price coverage compares value survival with the share of the announced value that the buyer pays to the seller.
The distinction matters because the corrections do not all act on the same quantity. A baseline correction lowers the run-rate permanently. A delay or a larger one-off cost leaves the run-rate unchanged and lowers only the value. A committee that tracks run-rate alone will miss the second group, and one that tracks value alone cannot tell the two groups apart. The paper uses the pair of measures as a diagnostic, as the stress cases later show.
At approval, the committee has the announced case and the evidence then available. Later outcomes still require a defensible no-deal baseline, whose identification depends on design and assumptions. The experiment generates both the case and that baseline, allowing a method to be graded against generator-defined truth. A real study would need to justify its counterfactual and report the resulting uncertainty.
A survival ratio requires a documented denominator. The announced reference in this experiment is a pretax present value containing the announced integration-cost allowance; the completed bridge is after tax and contains the revised allowance. The ratio measures that specific conversion. A comparison between two after-tax cases answers a different question and should carry its own label. Changes in currency, valuation date, horizon or tax convention also require a separate reconciliation. A lower ratio is meaningful only when the reader can identify which economic quantities changed and which accounting or presentation conventions remained fixed.
The valuation boundary also determines which cash flows belong in the numerator. An operating saving can require working capital, replacement investment or an implementation payment by another group entity. A proposed transaction bridge would identify those effects and reconcile their dates before it treats operating contribution as distributable cash. The present experiment contains the particular operating and implementation flows defined in its equations. It omits a separate working-capital process and a financing waterfall. The resulting synergy value therefore answers a restricted investment question. It supplies no complete forecast of debt capacity, sponsor distributions or cash available elsewhere in a group.
3 The UK Takeover Code makes the base figure, the costs and the counterfactual part of the statement
The UK Takeover Code gives an explicit disclosure framework for quantified financial benefits statements. Subject to the Panel's consent and applicable dispensations, Rule 28.1 requires reporting-accountant and financial-adviser reports on first publication by an offeree company or securities exchange offeror during an offer period or in its opening announcement. Rule 28 excludes statements by a cash offeror. The current rule pages were checked on 6 November 2026. [1]
Rule 28.6 covers the bases of belief, quantified constituents, a base figure for historical or existing-cost comparisons, disbenefits, timing, recurrence and the costs of realising benefits. Its offer-dependence statement applies specifically to definition (a), concerning benefits of a successful offer. These fields inform the paper's proposed baseline and omission checks; they do not calibrate the adjustments. [1]
Note 1 distinguishes an offeree's pre-offer-period cost savings from revisions published during the offer period. New cost-saving statements after an approach require Panel consultation; the Panel may treat them as quantified financial benefits statements and defer reporting to the offeree board circular. Transaction-specific application therefore needs the Code and Panel process. Table 1 summarises the reviewed texts. [1]
| Source and status | Base figure or counterfactual | Costs of achieving | Disbenefits | Reporting or review requirement |
|---|---|---|---|---|
| UK Takeover Code Rules 28.1 and 28.6 [1] | Base figure for comparisons; offer-dependence statement for definition (a) | Recurring and non-recurring costs | Required | Scoped reports under Rule 28.1; Panel consent, dispensations and cash-offeror exclusion apply |
| Saudi Merger and Acquisitions Regulations, Article 41 [2] | No equivalent base-figure checklist identified in Article 41 | No equivalent checklist identified in Article 41 | No equivalent checklist identified in Article 41 | Auditor report and adviser acknowledgement for scoped profit forecasts/profit statements under Article 41(c), unless CMA consents otherwise |
| IFRS 3/IAS 36; corresponding AASB texts [3, 4] | Residual goodwill; qualitative factors; scoped impairment requirements | Acquisition-related costs generally expensed; securities-issue exception | No deal-specific checklist in cited paragraphs | Financial-reporting requirements; no separate blanket synergy-assurance requirement established here |
| IASB exposure-draft redeliberation, checked November 2026 [5, 14] | Performance and expected-synergy information under discussion | Amounts, costs and timing by category proposed | No conclusion drawn here | No final requirements established by these materials |
MatchPoint summary of the specified provisions, subject to their jurisdiction, transaction and reporting scope. An item not identified in Article 41 or the cited accounting paragraphs is a bounded reading result; it does not establish the absence of requirements elsewhere.
A transaction team can use these fields as an internal review checklist after determining the statement's actual legal classification. The checklist should identify the publishing entity, consideration structure, offer stage, relevant definition and any Panel consent before it describes a reporting requirement. Using the same fields in a private GCC acquisition is an analytical recommendation. The UK rule does not acquire local legal force through that use. Legal advisers should determine the transaction's obligations, while finance tests whether the economic claims reconcile under the selected definitions.
4 Saudi Article 41 regulates profit forecasts and specified earnings statements within its offer rules
Saudi CMA Article 41(a) and (b) requires care in compiling profit forecasts and disclosure of their assumptions. Under Article 41(c), unless the CMA consents otherwise, the offeree or an offeror in a securities exchange offer must include the specified auditor report and independent-adviser acknowledgement when first publishing a profit forecast or profit statement during the offer period or its opening announcement. The official Arabic text specifies profit forecasts and profit statements; the English translation's shorter 'forecast or statement' should be read in that context. The current CMA register identifies the amendment of 18 January 2023. [2]
Article 41(e) requires a clear earnings-per-share disclaimer for specified earnings-enhancement statements not intended as profit forecasts. Article 41 does not set out the UK Rule 28.6 checklist for a base figure, offer dependence, costs and disbenefits. This comparison is confined to the provisions examined. [2]
The comparison does not establish Saudi disclosure practice or the CMA's expectations in a particular offer. UAE SCA, DIFC and ADGM takeover requirements remain outside this review. As a proposed diligence control, a committee should request line-level baselines, costs and disbenefits and record whether they have been independently tested.
The proposed country record would retain the relevant official text, translation, amendment date and transaction-scope assessment together. It would also distinguish a profit forecast, an earnings statement and a description of potential combination benefits. Similar commercial language can fall within different legal definitions. An absence identified in one reviewed provision is therefore insufficient support for a wider conclusion about every obligation affecting an offer. The economic review can proceed by requesting the underlying records directly, with the legal position recorded separately by the advisers responsible for that assessment.
5 Goodwill measurement and impairment rules provide distinct checks on a synergy case
Within its business-combination scope, IFRS 3 measures goodwill residually. Paragraph 32 includes consideration, non-controlling interests and, for staged acquisitions, the acquisition-date fair value of the previously held interest, less net identifiable assets and liabilities. B64(e) requires qualitative goodwill factors, including expected synergies; this is not a separate quantitative synergy measurement. The corresponding AASB 3 compilation applies to annual periods beginning from 1 July 2026 to before 1 January 2027. Its IFRS-compliance statement concerns for-profit Tier 1 entities. [3]
IFRS 3 paragraph 53 generally expenses acquisition-related costs as incurred and services are received. Costs of issuing debt or equity follow IAS 32 and IFRS 9 instead. The corresponding AASB paragraph uses AASB 132 and AASB 9. The paper's integration-cost ledger is a separate analytical record; its contents require classification under the applicable standards. [3]
IAS 36 paragraph 18 defines recoverable amount using the higher of value in use and fair value less costs of disposal. Paragraph 80 allocates goodwill to benefiting cash-generating units or groups. In value-in-use cash flows, paragraphs 43 to 45 address double counting and exclude uncommitted restructuring and performance enhancements. Paragraph 47 addresses committed restructurings. These restrictions do not describe every impairment valuation. The corresponding AASB 136 compilation applies to annual periods beginning from 1 July 2026 to before 1 January 2029; for-profit Tier 1 compliance also meets IAS 36. [4]
The acquisition valuation, the purchase-price allocation and the subsequent impairment assessment should retain separate reconciliations. Expected combination benefits may inform an investment case, while the recognition and testing requirements apply their own units, boundaries and conditions. A finance team should document how an item moves between those schedules and which differences remain. For example, a cash integration payment can affect the investment forecast before the associated accounting expense or tax deduction occurs. The experiment keeps its economic payment assumption visible and makes no transaction-specific conclusion about recognition, deductibility or impairment.
6 The standard setter is weighing synergy disclosure by category, amount, cost and timing and has not decided
The International Accounting Standards Board issued an exposure draft, which the staff paper links as the 2024 draft, that proposed to require information on expected synergies for each business combination. A July 2026 staff paper summarises the proposal. For each category of expected synergy, the entity would disclose the estimated amount, the estimated cost and the expected timing. The paper records that most users and user groups agreed with the proposal, while most respondents, including almost all preparers, disagreed. [5]
The July staff paper records seven of thirteen members supporting the May 2026 package's cost-benefit assessment, below the eight-member publication supermajority. It describes staff analysis and tentative work. The official September update records a 23 September 2026 discussion of subsequent-performance information, with no decisions requested and redeliberation continuing. The project page still identifies redeliberation at the 6 November 2026 check. These sources establish no final new disclosure requirement. [5, 14]
The bridge's categories, amounts, costs and timing could help organise information relevant to the proposals. Compliance with any eventual standard would require a separate assessment of its final scope, aggregation, exemptions and disclosure requirements. The cited staff paper also records concerns about auditability, commercial sensitivity and litigation risk. These are considerations for the proposed record design. [5]
An organisation preparing its own records can preserve useful information while a standard-setting project remains in progress. The underlying evidence schedule should keep acquisition-date expectations distinct from subsequent changes, with a reason and approval date for each restatement. A reporting team could later map those records to an enacted requirement after checking its final wording, scope and effective date. This is a proposal for maintaining usable evidence. The experiment does not estimate the compliance cost of a future standard, predict its final requirements or treat tentative discussion as an obligation already in force.
7 One Gulf bank merger shows the synergy target and the one-off cost rising together
The FAB materials provide one documented historical example. Its Annual Review 2017 reports around AED 500 million of first-year cost synergies, a 2020 annual run-rate target raised from around AED 1 billion to around AED 1.5 billion, and estimated 2017 to 2019 integration costs of AED 1.1 billion. [7] The bank's April 2017 presentation records the earlier revisions from AED 500 million to around AED 1 billion in cost synergies and from AED 600 million to around AED 1.1 billion in integration costs. [8]
The stated integration-cost estimate is 0.73 of the later annual run-rate target. It compares a multi-year estimate with a revised annual target. The April 2017 presentation excludes around AED 350 million of strategic enabler investments from integration costs. The annual report's pro forma introduction separately excludes expected synergies and related costs from its pro forma statements. These distinct boundaries require care when using the ratio as a model anchor. [7, 8]
The record does not show that the synergies were overstated. The target was raised, and the bank reports realisation ahead of its first-year target. It does not show how much of the cost reduction would have occurred without the merger, because the baseline is not given. We did not obtain a later audited statement of the final run-rate. The ratio is used once, as an anchor for the authored one-off cost input, and it is not generalised to other banks or to other sectors. Table 2 lists each figure and what it leaves unproven.
| Item | Figure reported | Source | What it does not establish |
|---|---|---|---|
| Cost synergies realised in 2017 | Around AED 500 million | Annual Review 2017 [7] | The share that would have occurred without the merger |
| Run-rate cost synergy target for 2020 | Around AED 1.5 billion, up from around AED 1 billion | Annual Review 2017 [7] | The run-rate actually reached in 2020 |
| One-off integration costs, 2017 to 2019 | AED 1.1 billion estimated; April presentation excludes around AED 350 million of strategic enabler investments | Annual Review 2017 [7]; April 2017 presentation [8] | Final spend or total all-in implementation cash cost |
| One-off cost relative to the later target | 0.73, computed here from the two figures above | MatchPoint arithmetic | A norm for other mergers |
| Earlier estimates and revisions | Cost: AED 600 million to around AED 1.1 billion; cost synergy: AED 500 million to around AED 1 billion | FAB April 2017 presentation, printed pages 14 to 15 [8] | Final spend or realised net benefit |
| Pro forma statements | Exclude expected synergies and the costs incurred to achieve them | Annual Review 2017 [7] | Any measure of the benefit net of cost |
Management-reported realisation, targets and estimates from the bank's publications. The annual report copy is third-party hosted; the April 2017 presentation was obtained from FAB's investor-relations site. The cost estimate has the stated exclusions. No figure is a model output or independently measured causal synergy outcome.
For this paper, the bank disclosures demonstrate why the date and expenditure boundary belong beside a quoted synergy amount. A ratio between an integration-cost estimate and a later annual run-rate target combines two identified quantities; it does not measure realised net present value. The original presentation's excluded strategic investment also needs to remain visible when the figures are used as a reference. Any acquisition team adopting an external comparison should reconstruct its numerator, denominator and exclusions before using it to challenge a budget. The experiment uses this historical example without assigning it a representative weight.
8 Selected prior research informs baseline measurement, synergy types and forecast evaluation
Barber and Lyon examine tests of abnormal operating performance for NYSE and AMEX firms over 1977 to 1992. Their results show misspecification when controls fail to match pre-event performance and relate this to mean reversion in accounting measures. [9] This supports attention to a comparable baseline. It does not establish that a particular weak target would improve independently; the link between pre-deal weakness and baseline improvement is an authored premise tested in this model.
Feldman and Hernandez develop five synergy types, life cycles and conceptual interactions between sources of value. The cited January 2021 author manuscript corresponds to their 2022 Academy of Management Review article. [11] Devos, Kadapakkam and Krishnamurthy report Value Line forecast-based estimates for 264 large mergers averaging 10.03 per cent of combined equity value, including 1.64 per cent tax and 8.38 per cent operating gains. These are analyst-forecast valuation estimates from the cited abstract, with a different measurement object from this paper's announced run-rate. They supply no direct calibration for the constructed GCC case. [12]
Smith and Winkler analyse optimism induced by choosing among noisy value estimates and the use of Bayesian updating. [10] Flyvbjerg discusses reference-class forecasting, optimism bias and strategic misrepresentation in project management, particularly transport infrastructure. [13] Bauer and Friesl's exploratory qualitative study examines how valuation practices and M&A attention structures can favour functional synergies over business-model and strategic synergies. [15] These are relevant antecedents. The papers examined here do not provide a directly transferable GCC synergy-survival calibration; this selective review does not establish an exhaustive literature gap.
Bauer and Friesl examine how organisational attention and valuation practices shape synergy evaluation, including the treatment of functional, business-model and strategic benefits. Their analysis offers a further reason to inspect how a numerical case was assembled. It supplies no calibrated rate of GCC forecast error. [15] The present paper focuses on a reproducible valuation reconciliation and constructed estimator comparisons. It draws on established ideas about synergy categories, baseline matching and selection. The combination of those ideas is an analytical application; this paper makes no claim that a synergy ledger, a counterfactual baseline or order-averaged attribution is a newly discovered method.
9 Five overlap risks and forecast adjustments structure the proposed review
The first double count is overlap between lines. A programme that counts contract labour savings under procurement and again under headcount claims the same payment twice. The proposed test maps each line to a ledger account and checks the shared claim against the cost base. The second is overlap with the baseline: a saving already contained in a standalone budget or existing programme. The paper proposes a base figure and a documented no-deal comparison for every line, drawing on Rule 28.6's scoped disclosure discipline. [1]
The third adjustment converts incremental revenue into operating contribution at its incremental margin, net of the assumed cost to serve it. Further adjustments cover omitted or inconsistently netted implementation spending, attrition and dis-synergy. A separate price review checks whether combination benefits already appear in standalone value and are then used again to justify a premium. Goodwill is a residual under the cited accounting framework and does not independently measure those benefits. [3] The ledger should identify each economic event before finance decides how the relevant forecasts connect.
The model separates cross-line overlap, standalone-baseline movement, incremental margin and revenue attainment from timing, integration-cost and tax adjustments. Overlap and baseline corrections affect the operating quantity in the stated model. A different payment schedule, tax convention or fixed-horizon delay can change present value while leaving the final operating run-rate unchanged. These are conditional diagnostic relationships. Several mechanisms can operate together, and the two survival measures cannot uniquely identify their cause.
| Adjustment or risk | Economic boundary | Proposed evidence | Model treatment |
|---|---|---|---|
| Overlap between lines | One saving in two workstreams | Ledger-account map of every claimed line | Cross-line overlap share |
| Overlap with baseline | Saving already in a standalone plan or in market movement | Base figure; statement that the benefit could not be achieved independently [1] | Standalone baseline share, cost and revenue |
| Revenue counted as profit | Sales quoted at group margin | Margin on incremental sales net of cost to serve | Incremental margin |
| Omitted or inconsistently netted costs | Cost to achieve, attrition, dis-synergy | Recurring and non-recurring costs and disbenefits [1] | Attainment, dis-synergy and cost to achieve |
| Value counted twice in the price | Synergy in the standalone value and again in the premium | Price bridge from standalone value to price [3] | Share of announced value paid to the seller |
Proposed analytical record. Overlapping benefits are literal double counts; margins, delivery, costs, timing and tax require additional valuation adjustments. Each adjustment retains its stated definition.
Mutual exclusivity should be tested at the economic-event level. A procurement initiative and a workforce initiative may both refer to the same outsourced service, while an improvement in price and an improvement in volume may interact within the same contract. A proposed ledger would identify the underlying cost pool or revenue transaction, then document how the combined claim is apportioned. Removing an overlap and removing a standalone-plan benefit also require an explicit sequence or a joint definition. In the model, the baseline share applies to the cost amount remaining after the overlap correction. That conditional convention is an authored assumption.
Evidence about an account balance is insufficient to establish the whole claimed saving. The review also needs the activity, service level and counterparty affected by the proposed change. For a proposed outsourced-service consolidation, the ledger would identify which contract ends, which obligations remain and where replacement service is funded. The same economic payment would receive one treatment in the combined case. Changes in volume or service would be recorded separately. This is a proposed control for defining the claim. No saving or legal right to terminate a contract is assumed for an actual acquirer.
10 A bridge from announced run-rate to surviving value applies each correction to a stated quantity
The bridge starts from the announced gross run-rate, which is the announced cost synergy plus the announced revenue synergy valued at the announced margin. It applies the adjustments in Table 3 to produce an adjusted run-rate, spreads that run-rate over the actual phasing, deducts the one-off cost, applies tax and discounts. Each adjustment can be switched on or off independently, so every intermediate value is defined. This design is what allows the order of the corrections to be examined later.
In the first equation A is the adjusted pre-tax run-rate, C the announced cost synergy, R the announced incremental revenue, mu the announced margin on it and G the announced gross run-rate. The symbols o and b are the cross-line overlap share and the share of cost synergy already in standalone plans, e is the share of revenue synergy already in baseline growth, q is revenue attainment, m the incremental margin on delivered revenue and d the dis-synergy as a share of G. In the second equation phi is the announced ramp shifted by delta years, w the phasing of the one-off cost across years, kappa the one-off cost as a share of G, tau the tax rate and r the discount rate. One-off expenditure is phased 40%, 40% and 20% in years 1, 2 and 3, with zero thereafter; its phasing is unchanged by the benefit delay.
Run-rate survival s uses announced gross run-rate G; main value survival S uses pretax announced reference W. W already deducts the announced integration allowance of 0.50G. V deducts the revised allowance of 0.75G and applies the uniform effective-tax assumption. Seller payment is pi times the original W, so non-negative synergy surplus requires V to cover that payment. A separate like-tax reference is 704.4 in USD million, giving survival of 32.8%. That display changes the denominator only; it leaves the model's seller payment and main pretax-to-after-tax bridge unchanged.
The uniform tax multiplier is a substantial simplification. It grants a tax effect to negative as well as positive annual model cash flows, so integration expenditure receives an immediate offset at the assumed rate. Actual availability would require a separate assessment of the entity, expenditure type, taxable income, timing and relevant relief. The model also treats the discount rate as a stated input and leaves financing cash flows outside the bridge. A transaction model should reconcile the synergy cash schedule to its tax and financing schedules before using the result in an enterprise-value or equity-value conclusion.
A bridge can be arithmetically correct while its payment dates remain unusable for a financing decision. The constructed schedule places flows at annual ends and leaves integration-cost phasing unchanged when benefit delivery is delayed. In a live analysis, a deposit, termination payment or transition-service invoice may precede the corresponding saving. The proposed finance record would therefore include a dated implementation funding schedule and an identified source of cash. A present-value surplus would be reported alongside any intervening funding requirement. The model supplies no test of intrayear liquidity, lender consent or committed funding availability.
11 A constructed deal and a stated input register fix every number that follows
The constructed deal is a mid-sized acquisition with announced cost synergies of 100, announced incremental revenue of 200 valued at an announced margin of 30 per cent, and an announced gross run-rate of 160 in USD million. The announced ramp reaches full run-rate in the third year and the announced one-off cost is half of the gross run-rate. The announced value over ten years at a 10 per cent rate, before tax and with no terminal value, is 774.1. Every other input is authored, and the register states which.
The authored one-off-cost ratio of 75 per cent sits close to 0.73, calculated from the stated FAB integration estimate and later annual target. Its disclosed cost boundary excludes strategic enabler investments, and it supplies no representative cost norm. [7, 8] The model's 9 per cent tax parameter uses the UAE ordinary rate on taxable income above AED 375,000. Qualifying Free Zone Persons have separate treatment. The 15 per cent sensitivity is a uniform authored scenario; the UAE DMTT applies to scoped MNE constituent entities under its own calculation rules, from financial years beginning on or after 1 January 2025, with the EUR 750 million revenue test in at least two of four preceding years. A real transaction requires entity-level tax analysis. [6]
Excluding a terminal value is a deliberate choice that lowers both announced and surviving value and so affects the ratio. A cost saving that persists would carry a terminal value, and the sensitivity of the ratio to that choice is not tested. The experiment reports ratios because absolute values depend on arbitrary scale. Table 4 is the register used by every result below.
| Input | Value | Status |
|---|---|---|
| Announced cost synergies (run-rate) | 100.0 | Authored |
| Announced revenue synergies (run-rate revenue) | 200.0 | Authored |
| Announced margin on revenue synergies | 30.0% | Authored |
| Announced ramp, years 1 to 3 | 30% / 70% / 100% | Authored |
| Announced one-off cost, share of announced run-rate | 50% | Authored |
| Cross-line overlap in cost synergies | 12% | Authored |
| Share of de-duplicated cost synergy already in standalone plans | 15% | Authored |
| Share of revenue synergy already in baseline growth | 20% | Authored |
| Incremental margin on delivered revenue | 18.0% | Authored |
| Revenue attainment | 60% | Authored |
| Dis-synergy, share of announced run-rate | 7.5% | Authored |
| One-off cost to achieve, share of announced run-rate | 75% | Authored; one documented bank merger ratio 0.73 [7] |
| Phasing delay against announced ramp | 1 year | Authored |
| Horizon / discount rate | 10 years / 10% | Authored; no terminal value |
| Share of announced value paid to the seller | Uniform 10% to 50% by deal | Authored; no market evidence |
| Corporate tax rate | 9% (15% tested) | Statutory rate [6]; applicability to the acquirer is an input |
Authored inputs. USD million where a money amount is shown. The statutory rate is taken from the cited decree-law; every other value is a constructed assumption, not an observed rate.
Every input should retain a basis, an owner and an expiry or review condition. A signed supplier commitment, a management budget and a model sensitivity have different evidential roles even when their displayed amounts coincide. The proposed register therefore records the originating document and the economic event, rather than relying on a label such as validated. Currency and price basis also need to be consistent across periods. The constructed amounts use one currency and a fixed convention, with no separate foreign-exchange process. Their apparent numerical precision describes reproducible arithmetic under those assumptions.
The horizon choice particularly affects a delayed benefit. This experiment ends after ten years measured from its stated starting point. A delay can move a benefit outside that window, and the model gives no recovery for that later amount. It does not demonstrate that the economic benefit ceases at the window boundary. A transaction analysis could instead adopt an evidence-supported finite duration or a separately justified terminal treatment. Each version should preserve the same starting date, currency and price convention when compared. Changing a horizon solely to restore an attractive result would change the question being answered.
12 In the constructed deal 50.0% of the run-rate and 29.8% of the value survive
Applying all seven adjustments in the order of Table 5 reduces the announced value of 774.1 to 230.7, so the value survival is 29.8% and the run-rate survival is 50.0%. The run-rate falls from 160 to 80.1 before tax. The cumulative table shows how each step contributes when applied in the announced order, and Figure 1 shows the order-averaged contribution of each adjustment, which the next section defines.
Two results are worth separating. First, the value lost is larger than the run-rate lost because the corrections that leave the run-rate untouched, slower phasing, cost to achieve and tax, are all adverse and compound with the run-rate corrections. Second, the loss is spread over several adjustments and no single one explains it. A review that corrected only the largest item would still leave most of the gap. The size of each step depends on authored inputs and the table is a worked case, not an estimate of typical leakage.
The implication for the committee is direct. In this constructed deal an announced case that looked sufficient at a stated price would cover a minority of its own value after the bridge. A price that pays away more than 29.8% of the announced value would leave the buyer worse off on the synergy component, under the stated inputs. The buyer should ask which of the seven adjustments the seller's case has already applied.
| Step (cumulative) | Run-rate before tax | Value | Change in value | Share of announced value |
|---|---|---|---|---|
| Announced case | 160.0 | 774.1 | - | 100.0% |
| Cross-line overlap | 148.0 | 711.0 | -63.1 | 91.8% |
| Standalone baseline | 122.8 | 578.4 | -132.6 | 74.7% |
| Revenue at incremental margin | 103.6 | 477.4 | -101.0 | 61.7% |
| Revenue attainment and dis-synergy | 80.1 | 353.7 | -123.7 | 45.7% |
| Slower phasing | 80.1 | 287.3 | -66.4 | 37.1% |
| Cost to achieve | 80.1 | 253.5 | -33.8 | 32.8% |
| Corporate tax | 80.1 | 230.7 | -22.8 | 29.8% |
MatchPoint analysis of the constructed deal. Model output under stated inputs; not an observed result. USD million. Adjustments applied in the order shown.
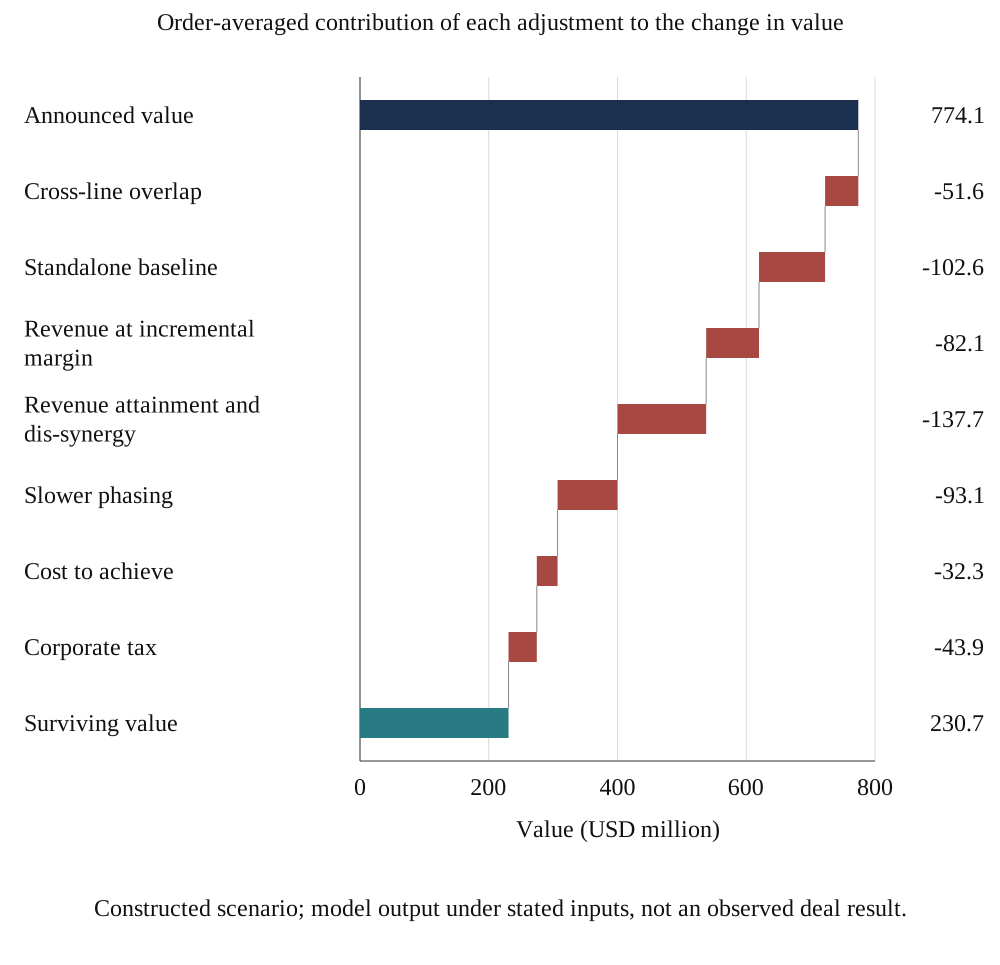
MatchPoint analysis of the constructed deal. Model output under stated inputs; not an observed result. USD million, order-averaged attribution.
The price-coverage result applies to the synergy component defined in the experiment. An acquisition may have other reasons for proceeding, but any separately supported value should enter a separate bridge with its own evidence and approval. Adding an unmeasured strategic residual after a synergy shortfall would make the stated price test difficult to falsify. The committee can instead record the remaining gap and the basis on which it chooses to accept that exposure. This preserves the distinction between the computed cash case and a decision to fund an additional strategic objective.
13 The size of each correction depends on the order applied, so attribute by averaging over all orders
A sequential bridge assigns to each step the change it causes given the steps already taken. When the adjustments interact, that change depends on position. The standalone baseline lowers the run-rate that later phasing and tax then scale, so applied early it removes more value than applied late. Table 6 shows the same seven adjustments applied from first to last and from last to first. The largest disagreement between the two orders is 54.6 for standalone baseline, in the same units as the bridge.
In equation 3a, j enumerates all n! complete orderings of the n adjustments. The set S with subscripts j and k contains the adjustments preceding k in ordering j; its plus superscript denotes that set with k added. N denotes all adjustments, and v(0) means the no-adjustment case. The expression averages each marginal change over the complete orderings. Equivalently, it applies the Shapley construction to the normalised change function v(S) minus v(0). Equation 3b reconciles the allocations to the total change. The source model uses the equivalent subset formula; independent enumeration of all orderings reproduces its values. [17]
The order-averaged attribution ranks revenue attainment and dis-synergy, standalone baseline and slower phasing as the three largest of the seven for the constructed deal, and the standalone baseline accounts for 102.6 of the 543.4 lost. This is a statement about authored inputs. The allocation convention makes the chosen treatment of ordering explicit in the committee record. A committee paper should show the order-averaged column next to its own sequence.
| Adjustment | Applied first to last | Applied last to first | Order-averaged | Share of change |
|---|---|---|---|---|
| Cross-line overlap | -63.1 | -41.1 | -51.6 | 10% |
| Standalone baseline | -132.6 | -77.9 | -102.6 | 19% |
| Revenue at incremental margin | -101.0 | -58.1 | -82.1 | 15% |
| Revenue attainment and dis-synergy | -123.7 | -145.2 | -137.7 | 25% |
| Slower phasing | -66.4 | -120.7 | -93.1 | 17% |
| Cost to achieve | -33.8 | -30.7 | -32.3 | 6% |
| Corporate tax | -22.8 | -69.7 | -43.9 | 8% |
| Total change | -543.4 | -543.4 | -543.4 | 100% |
MatchPoint analysis of the constructed deal. Model output under stated inputs; not an observed result. USD million. Negative values reduce value.
Order-averaged attribution distributes a defined change in model value among the selected adjustments. It does not establish which management action caused an observed outcome or which party should receive compensation. The answer depends on the chosen adjustment set and the value function evaluated for each combination. Splitting one adjustment into two, or changing the counterfactual used for the empty case, can therefore change the attribution question. A report should preserve that specification alongside the waterfall. The calculation is useful when participants need a consistent allocation convention and understand the convention's dependence on those definitions.
14 Each stress case leaves a different signature in run-rate survival and value survival
Four stresses are applied one at a time and then together. Baseline drift raises the cost baseline share to 30 per cent and the revenue baseline share to 35 per cent, as would happen if the standalone plan had been more ambitious than assumed or market prices had moved in the target's favour. Further slippage adds a second year of delay. Cost overrun raises the one-off cost by half. Revenue attrition lowers attainment to 40 per cent and doubles the dis-synergy. The stresses leave the announced case unchanged and alter only the adjustments. Table 7 and Figure 2 report them.
The stresses separate into two groups. Baseline drift lowers run-rate survival from 50.0% to 39.8% and value survival to 21.2%. Revenue attrition lowers run-rate survival to 38.9% and value survival to 20.6%. Slippage and cost overrun leave run-rate survival at 50.0% and lower value survival only, to 22.7% and 23.8% respectively. The pair of measures therefore tells the reader where to look: a fall in run-rate points to the baseline or to attainment, while a fall in value alone points to timing or cost. Combined, the value survival is 2.4% and the value is 18.9 in USD million.
Figure 3 varies the baseline share and the one-off cost across a grid. Value survival ranges from 8.8% to 46.9%. With every other input at its base value, the one-off cost at which the value reaches zero is 2.63 times the announced gross run-rate. Raising the tax rate to 15 per cent lowers the base value survival to 27.8%. These results show how fast the case erodes, and they carry no probability.
| Case | Run-rate survival | Value survival | Value | Run-rate change (percentage points) | Value change (percentage points) | Diagnostic signature |
|---|---|---|---|---|---|---|
| Base case | 50.0% | 29.8% | 230.7 | - | - | Reference |
| Baseline drift | 39.8% | 21.2% | 164.4 | -10.3 | -8.6 | Both fall: baseline or attainment |
| Further slippage | 50.0% | 22.7% | 175.8 | 0.0 | -7.1 | Value only: timing or cost |
| Cost overrun | 50.0% | 23.8% | 184.6 | 0.0 | -6.0 | Value only: timing or cost |
| Revenue attrition | 38.9% | 20.6% | 159.1 | -11.1 | -9.3 | Both fall: baseline or attainment |
| Combined | 29.3% | 2.4% | 18.9 | -20.7 | -27.4 | Both fall, value more: mixed causes |
MatchPoint analysis of the constructed deal. Model output under stated inputs; not an observed result. USD million for value; survival as a percentage of the announced quantity; changes in percentage points.
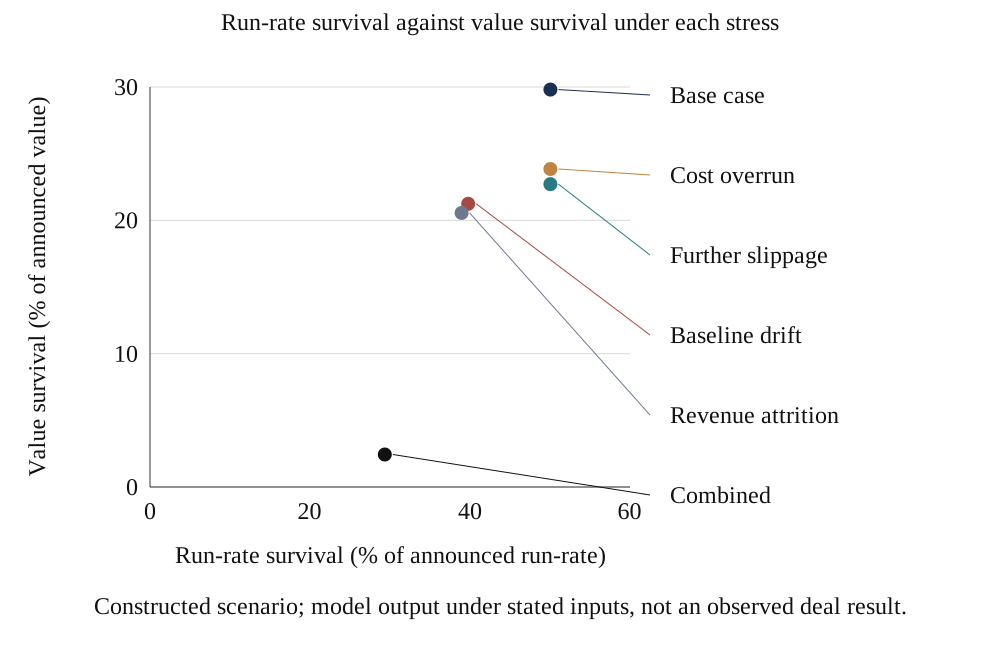
MatchPoint analysis of the constructed deal. Model output under stated inputs; not an observed result.
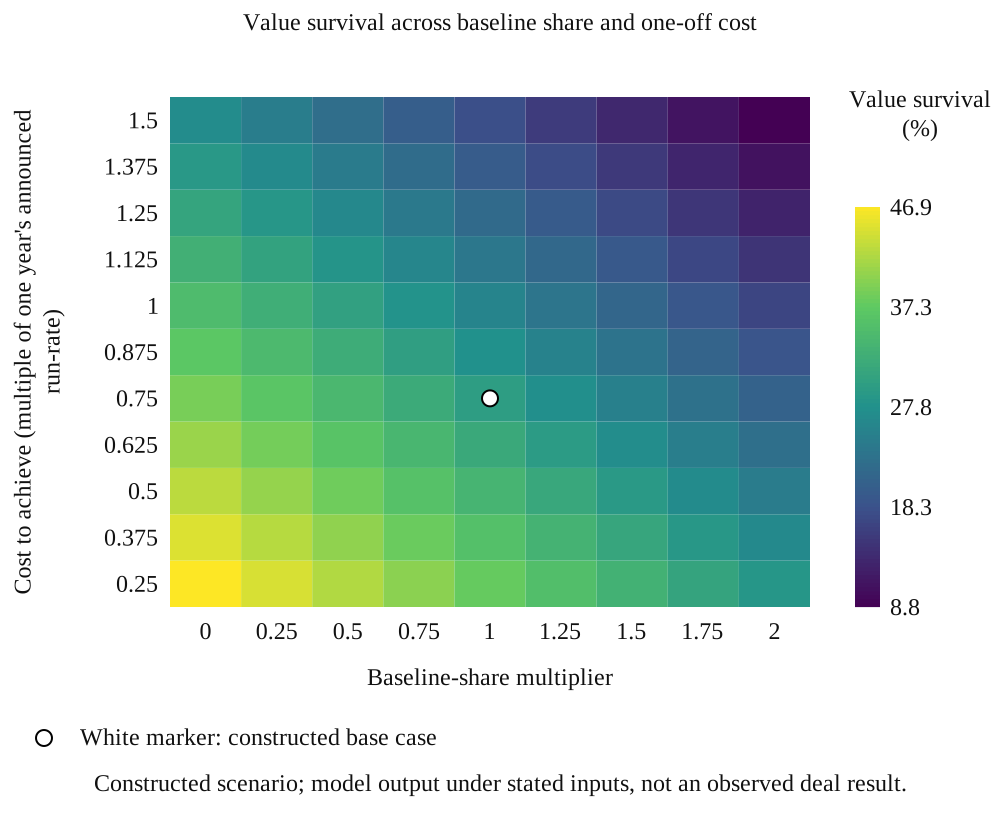
MatchPoint analysis of the constructed deal. Model output under stated inputs; not an observed result. The white marker shows the base case.
A combined downside requires a rationale beyond placing adverse entries in adjacent rows. Some assumptions can move together, some may reflect the same underlying cause, and others can be incompatible. A live review should identify those relationships before it assigns a scenario probability or a pricing reserve. The experiment's combined case is a deterministic conjunction of the stated stresses and carries no estimated likelihood. Its diagnostic use is to expose the cash consequences of that conjunction. A different combination, or a benefit continuing beyond the fixed horizon, would answer a different valuation question.
15 In a constructed population a full bridge leaves 11.1% false accepts against 49.2% for the announced value
The population experiment constructs 300 opportunities in each of 200 replications, with the distributions, dependencies, measurement errors and calibration draws recorded in the technical register. Generated truth is the full bridge using the generating parameters. The five evaluated estimation rules use the announced case, a learnt flat retention factor, costs and tax alone, a full bridge with fixed baseline centres, or a full bridge with gap-conditioned baseline predictions. A perfect-information reference uses generated truth directly; a random rule provides a separate comparison. Their information and estimation costs are not matched.
A rule accepts an opportunity when its estimated synergy value covers the modelled payment to the seller. A false accept has negative generated synergy surplus within that accepted set. The mean accepted-set false-accept share is 49.2% for the announced case, 49.2% for costs and tax alone, 19.0% for the flat retention factor and 11.1% for the gap-conditioned bridge. The announced-case bias is 69.5% of the reference-value total and the costs-and-tax bias is 56.5%. The flat factor reduces the displayed mean bias in this constructed comparison. These percentages do not use an identical accepted set.
The perfect-information reference has zero valuation error by definition. Random acceptance gives 49.1% false accepts within its accepted set; it is a reference rule without a global worst-case interpretation. The rank measure compares monetary estimated surplus with generated surplus, while the later pipeline experiment selects on normalised surplus. Seller-payment dispersion affects those rankings. Table 8 reports false accepts alongside missed good opportunities and value destroyed, so a change in one selected-set statistic is not treated as a complete decision-policy evaluation. Figure 4 displays the stated comparisons.
| Rule | Mean error | Root mean square error | Rank correlation | False accepts | Missed good deals | Value destroyed |
|---|---|---|---|---|---|---|
| Accept announced value | 69.5% | 77.2% | 0.28 | 49.2% | 0.0% | 6.0% |
| Flat retention factor | -0.1% | 10.9% | 0.76 | 19.0% | 19.1% | 0.6% |
| Net of cost and tax only | 56.5% | 63.0% | 0.36 | 49.2% | 0.0% | 6.0% |
| Full bridge, industry baseline | -0.4% | 8.3% | 0.87 | 13.3% | 14.7% | 0.3% |
| Full bridge, matched baseline | -0.4% | 7.2% | 0.91 | 11.1% | 12.6% | 0.2% |
| Perfect-information bridge (identity reference) | 0.0% | 0.0% | 1.00 | 0.0% | 0.0% | 0.0% |
| Random ranking /50% acceptance reference | n/a | n/a | 0.00 | 49.1% | n/a | n/a |
Constructed population; means across 200 replications. Bias is total estimation error divided by total W; RMSE is root mean squared monetary error divided by mean W. False accepts use accepted cases; missed good deals use all generated good cases. Value destroyed divides adverse accepted surplus by total W across candidates. No observed outcome is reported.
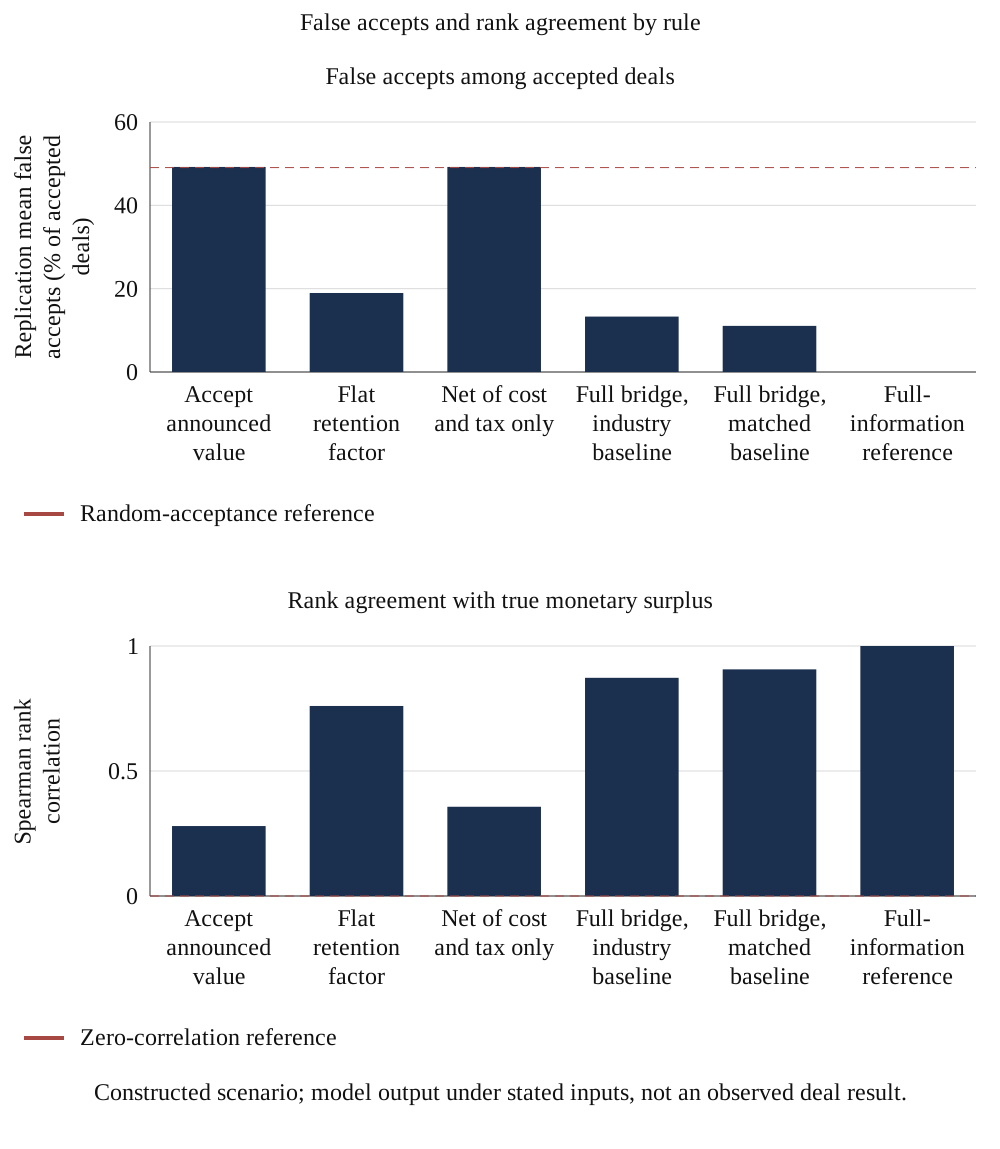
MatchPoint analysis of the constructed population. Model output under stated inputs; not an observed result. The dashed line is random acceptance in the left panel and zero in the right.
The false-accept statistic averages the proportion of accepted opportunities with negative true surplus within each replication. The missed-good statistic uses truly good opportunities as its denominator. These measures answer different questions, and the rules accept different sets. The experiment also distinguishes estimation error, ranking and financial loss. Comparisons retain the shared opportunity population and price convention while reporting those selection differences. The full-information reference has access to the generating parameters. An actual advisory process would need reliable measurements before a comparison with that reference could support a practical performance claim.
A conditional error rate needs its acceptance count alongside it. In the implementation, a replication with no accepted opportunities receives a zero false-accept entry by convention; that entry describes an empty selected set. It cannot demonstrate that a process identifies every worthwhile acquisition. Similarly, the reported value-destroyed measure counts adverse synergy surpluses on accepted cases and omits gains forgone by rejected cases. A prospective decision evaluation would specify the relevant losses and benefits before comparing policies. It would retain approval volume, missed opportunities and implementation effort alongside forecast accuracy, with the available follow-up stated.
16 Conditional baseline predictions reduce error under the authored performance relationship
The baseline estimator is the part of the bridge that most resembles the problem Barber and Lyon studied. [9] In the constructed population the share of cost synergy already in standalone plans rises with how far the target's pre-deal cost position lags the industry, which is the mechanism behind mean reversion. An industry baseline assigns the same share to every target. A performance-matched baseline conditions the share on the pre-deal gap, using a slope estimated from 60 completed deals with noisy measurement.
The superscripts I and M denote fixed-centre and gap-conditioned predictions. The expression is applied separately to cost and revenue shares using authored centres b0 of 0.15 and 0.20 and separately fitted slopes. These centres are not exact means of the clipped population. The standardised gap g is observed without error in the experiment. The weakest fifth has true cost-baseline share 24.7%, against 5.7% for the strongest fifth. Fixed-centre signed value errors are 5.1% and -5.5% of W respectively; a negative error is an understatement. The gap-conditioned error for the weakest fifth is -0.1%.
The implication is practical and specific. For the targets with the weakest pre-deal cost position, an industry-average baseline gives the most favourable and least reliable answer under the authored link. Figure 5 shows the pattern. The result depends on the authored link between the gap and the baseline share. The two predictions coincide when the fitted slope is zero. With no true link, a finite noisy calibration sample can still produce a nonzero fitted slope, so a matched prediction need not equal the fixed-centre prediction. A real study would need to test the link and its stability on held-out data.
| Pre-deal cost gap to industry | True cost baseline share | Industry baseline | Matched baseline | Error, industry baseline | Error, matched baseline |
|---|---|---|---|---|---|
| Lowest fifth (best performers) | 5.7% | 15.0% | 5.6% | -5.5% | -0.3% |
| Second fifth | 11.3% | 15.0% | 11.4% | -2.4% | -0.4% |
| Middle fifth | 15.0% | 15.0% | 15.0% | -0.2% | -0.2% |
| Fourth fifth | 18.7% | 15.0% | 18.6% | 1.7% | -0.3% |
| Highest fifth (weakest performers) | 24.7% | 15.0% | 24.6% | 5.1% | -0.1% |
MatchPoint analysis of the constructed population. Model output under stated inputs; not an observed result. Errors are the signed error of the estimated value as a percentage of announced value; a positive error is an overstatement.
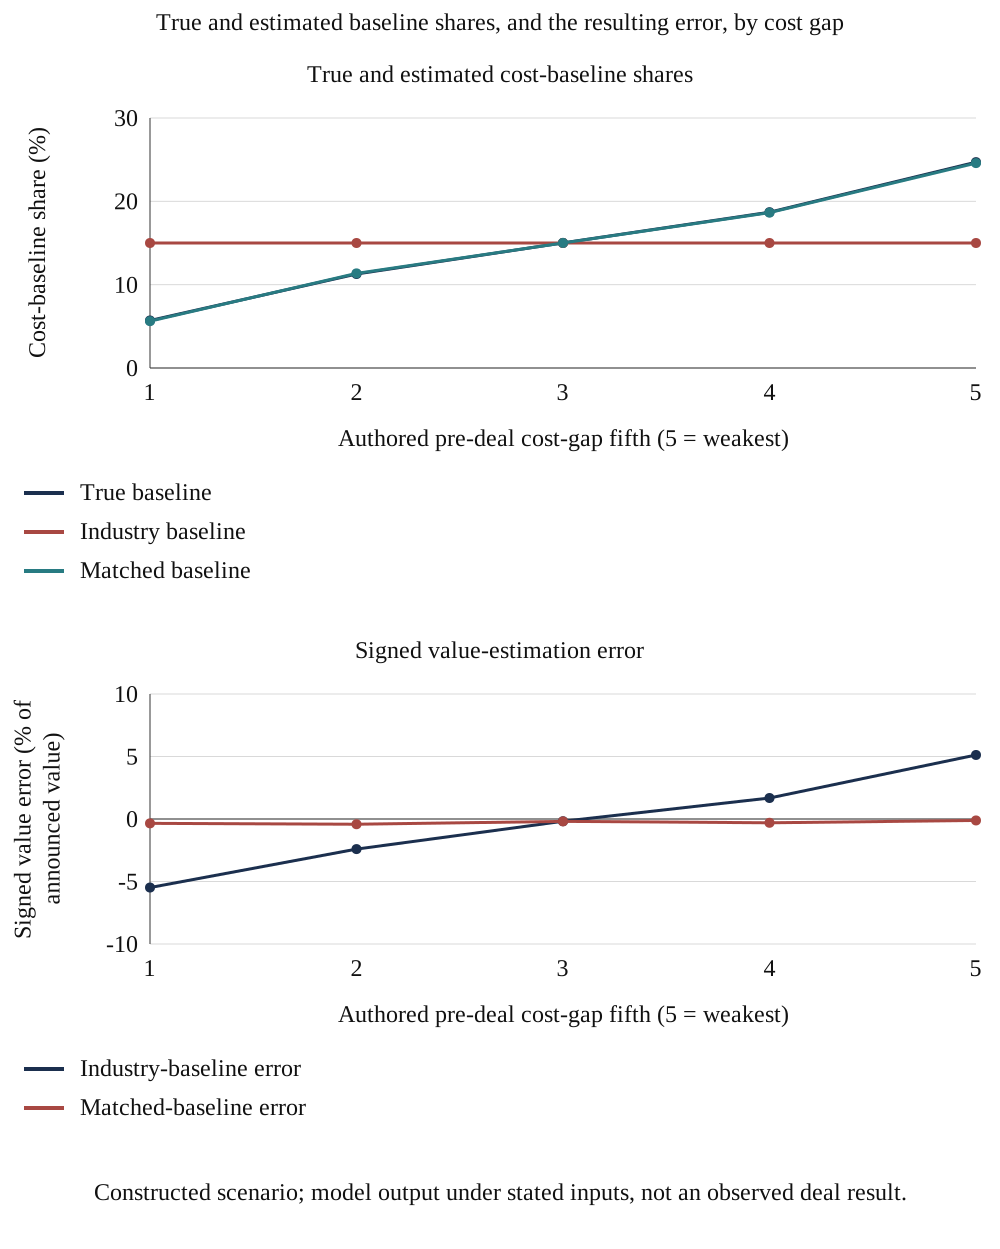
MatchPoint analysis of the constructed population. Model output under stated inputs; not an observed result.
A prospective estimator should be frozen before the deal whose outcome it predicts. Training records, matching variables, outcome measurement and validation records need separate timestamps. If several opportunities share the same acquirer, industry shock or integration team, the analysis should investigate their dependence rather than count each observation as wholly independent. The proposed validation would report results for later transactions and for acquirers omitted from training. These are evidence requirements for a future application. The constructed experiment checks behaviour under its specified relationship and supplies no observation that the relationship holds in a particular acquisition programme.
The baseline adjustment does not reconstruct the target's individual no-deal future. It predicts a baseline share using the authored gap, fixed centres and a fitted slope, with clipping at the stated boundaries. A real programme would need to establish how that gap is measured and how information available before approval predicts subsequent outcomes. A historical saving already approved in the standalone plan and a regression prediction would retain different evidential roles. The proposed ledger would show each separately. Combining them without a reconciliation could itself count a baseline adjustment twice or conceal the uncertainty in a prediction.
17 Pipeline selection magnifies forecast error under the authored mechanism
The pipeline experiment models an acquirer choosing among competing opportunities by estimated synergy surplus. Smith and Winkler analyse how maximising noisy, conditionally unbiased value estimates can produce optimism on average. [10] The pipeline experiment draws 40 deals per cycle, chooses the top 5 by estimated surplus as a share of announced value, and records the estimated and true surplus of the chosen deals over 400 cycles. Table 10 and Figure 6 report the result.
Here x is a deal's synergy surplus divided by its original W, the hat denotes its estimate and mu is the calibration mean of generated true surplus. The factor rho uses the variance of generated true surplus and the variance of estimation error from 150 constructed calibration deals. The fitted slopes use a separate 60-deal draw. Those generated outcomes and known baseline centres are privileged experiment information. The fitted factor is 0.87. This empirical linear adjustment is a calibration heuristic; joint Gaussian independent-error assumptions have not been established for the clipped, nonlinear generator.
The mean selected forecast error is 69.2% of W for announced selection, 3.4% for the gap-conditioned bridge and 0.0% after its linear adjustment. The last display is rounded: its retained mean is 0.018 percentage points, with conditional Monte Carlo standard error 0.134 points. The positive affine transformation preserves ordering and leaves the selected opportunities and their generated true surplus unchanged. The true selected surplus is 17.9% under announced selection and 22.5% under the gap-conditioned rule. The 400-cycle uncertainty conditions on the one retained calibration sample.
| Selection on | Estimated surplus of chosen deals | True surplus of chosen deals | Disappointment | Chosen deals with negative true surplus |
|---|---|---|---|---|
| Announced value | 87.1% | 17.9% | 69.2% | 3.8% |
| Full bridge, industry baseline | 24.9% | 21.6% | 3.3% | 0.7% |
| Full bridge, matched baseline | 25.9% | 22.5% | 3.4% | 0.2% |
| Matched bridge, shrunk | 22.5% | 22.5% | 0.0% | 0.2% |
Constructed pipeline; means over 400 cycles of 40 candidates, selecting five on estimated surplus divided by W. Surplus and forecast error are percentages of the selected deals' original W. Calibration draws of 150 and 60 cases are fixed within this experiment. No actual acquisition outcome is reported.
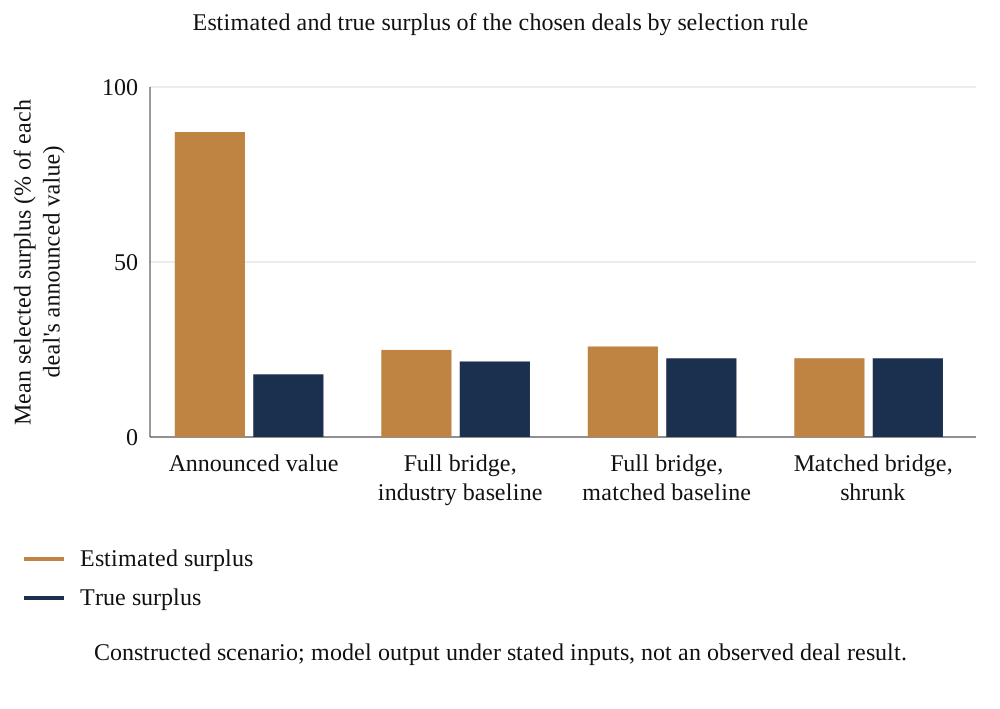
MatchPoint analysis of the constructed pipeline. Model output under stated inputs; not an observed result.
The calibration sample and the selection rule require separate reporting. A positive affine adjustment can change a forecast's level while leaving its ordering of opportunities unchanged. It can therefore reduce the displayed disappointment without identifying a different group of deals. A review should show the chosen set, its estimated surplus, its realised or generated surplus and the uncertainty in the calibration parameters. Rounding a small residual to zero also requires care. The experiment reports numerical behaviour under one stated calibration mechanism; it does not establish exact post-selection unbiasedness for arbitrary transaction forecasts.
18 The constructed calibration shows mean-factor precision and residual decision errors
The calibration experiment samples n independent constructed deals, computes their mean retained-value ratio and repeats 1,500 times. Its 20,000-deal constructed reference has mean ratio 30.3% and deal-level standard deviation 9.9%. With ten calibration deals the central 90 per cent range is 10.4 percentage points wide, with fifty it is 4.6 percentage points and with 300 it is 1.8 percentage points. These quantities concern the precision of a mean retention factor under the authored distribution. The corresponding deduction is one minus that retention factor.
The range narrows with the sample and the flat retention factor does not become decisive. On one fixed test draw of 2,000 constructed deals, the maximum misclassification evaluated at the 5th, 50th and 95th percentiles of the learned retention factor is 21.7% for calibration samples of 300 deals and 24.6% for samples of ten. This is a maximum across three tested factor values, not a worst-case bound. Variation in deal-specific ratios remains after the population mean is estimated precisely. The sample size therefore removes noise in the average and cannot supply the deal-level information that the bridge carries.
The model illustrates why a mean retention factor should be accompanied by its sampling range and the calibration sample's composition. Its precision depends on heterogeneity, dependence and measurement quality, as well as sample size. A small completed-deal record requires candid uncertainty; the relative value of a flat adjustment and a line-level bridge should be evaluated on relevant outcomes.
| Constructed calibration deals per replication | Mean retained-value factor | 5th percentile | 95th percentile | 90% range width (percentage points) | Maximum misclassification at factor quantiles5/50/95 |
|---|---|---|---|---|---|
| 10 | 30.4% | 25.3% | 35.7% | 10.4 | 24.6% |
| 20 | 30.3% | 26.9% | 33.8% | 6.9 | 22.9% |
| 50 | 30.3% | 28.1% | 32.6% | 4.6 | 22.0% |
| 100 | 30.3% | 28.7% | 31.9% | 3.2 | 21.9% |
| 300 | 30.3% | 29.4% | 31.3% | 1.8 | 21.7% |
Constructed calibration; 1,500 repetitions per sample size. Bounds are the fifth and ninety-fifth percentiles. The width is in percentage points. Misclassification is evaluated only at three factor quantiles on one fixed 2,000-deal test population; the maximum shown is not a universal bound.
Sampling precision and transportability answer different questions. More observations can narrow the dispersion of a learnt retention factor within a given constructed population, while a change in sector, acquisition type or measurement method can alter the quantity being estimated. A prospective reference class should state which completed cases qualify and why their outcomes are comparable. It should retain exclusions and failed measurements alongside the included cases. The central ranges in this experiment describe repeated samples under the authored mechanism. They provide no universal minimum transaction count and no assurance that an internal acquisition history represents the next deal.
19 Under the authored success-dependent disclosure pattern, reported realisations overstate survival
A dataset assembled from public company disclosures depends on which outcomes those records contain and which records are available. If disclosure depends on success, its observed mean may differ from the all-deal mean; the direction requires a stated reporting mechanism. The selection experiment lets the probability of reporting rise with the true ratio, with an authored logistic link, and compares the estimators of the surviving share. The share of deals reported is 34%, and Table 12 reports the estimators.
In equation 6, r is the retained-value ratio, D indicates disclosure and p-hat is an estimated disclosure probability. The generating logit has intercept -2.85 and slope 7. A noisy proxy, equal to the ratio plus normal error with standard deviation 0.08, is available for the entire constructed deal frame. The all-deal mean is 30.3% and the disclosed mean 34.4%, a gap of 4.1 percentage points. Proxy weighting gives 32.0% and removes 59% of the mean bias. Weighting by the untruncated true probability removes approximately 100%, rounded. Both weighted results are self-normalised estimates.
The disclosure result is conditional on the authored success-dependent mechanism. The fitted proxy probabilities are floored at 0.05; the perfect-information reference uses untruncated true probabilities. A noisy proxy can leave residual outcome-dependent missingness, and the observed subset alone does not establish the relevant population outcome. The perfect-information result is also a finite-sample weighted estimate, with a small residual bias that rounds to the displayed removal percentage. An acquisition archive would require its own frame, missing-record investigation and sensitivity analysis before these corrections could be evaluated.
| Estimator of the surviving share | Mean estimate | Error against all deals | Share of error removed |
|---|---|---|---|
| All deals observed (target) | 30.3% | 0.0 points | n/a |
| Reported deals only (naive) | 34.4% | 4.1 points | 0% |
| Weighted by a noisy proxy of reporting | 32.0% | 1.7 points | 59% |
| Weighted by the true reporting probability | 30.3% | 0.0 points | 100% |
MatchPoint analysis of the constructed population. Model output under stated inputs; not an observed result. Means over 300 replications of 400 deals. The fitted proxy reporting probability is floored at 0.05. The perfect-information reference uses the untruncated true reporting probability. Both estimates are self-normalised weighted means; reported 100% bias removal is rounded.
The reporting mechanism should be part of the proposed data audit. A participation register can distinguish an undisclosed outcome, an unavailable ledger, a deal that never completed and a benefit that remains unmeasured. Those states should retain separate codes and reasons. Under the experiment's success-dependent reporting rule, the observed subset is favourable by construction. A correction fitted from a noisy proxy depends on that proxy and its probability model. Unobserved outcomes cannot be certified from the selected records alone. The practical report should retain a sensitivity to the missing records and disclose the assumptions that determine its direction.
20 A proposed study combines dated deal records and line-level evidence with a separately designed randomised review component
A real study would take the deal as the unit and the claimed synergy line as the sub-unit. For each deal the record would hold the announced figures with their date, the base figure and the independence statement used, the one-off cost estimate, and every later restatement. For each line it would hold the ledger account, the owner and the measured saving by quarter. Table 13 lists the elements. Checkpoints at completion plus twelve, twenty-four and thirty-six months would distinguish measured run-rate and realised cash-to-date from projected remaining cash and ten-year value. The data cut, horizon, frozen denominators and incomplete follow-up would be recorded; a three-year review cannot yet observe the full ten-year value.
Participation would require written organisational permission, confidentiality terms and controlled aggregate reporting. Employee-level records require a separate personal-data assessment. UAE Federal Decree-Law No. 45 of 2021 addresses lawful processing, purpose, necessary data, security and retention; Article 2 has jurisdictional and sectoral exclusions, including specified health, banking and free-zone data regimes. The protocol should establish the applicable regime and processing basis and favour genuinely anonymised data. Removing names alone may leave identifiable records. The cited Arabic compilation establishes these provisions; counsel should check current implementing measures and transition requirements before collection. [16] Abandoned, untracked and unreported deals should be recorded where the agreed study design permits.
A randomised study could be organised among serial acquirers by assigning eligible cases to independent baseline and cost review before the relevant approval decision or to the usual process. Assignment would support an intention-to-treat comparison if the allocation, follow-up and interference assumptions were satisfied. The original announced denominators and outcome definitions should be frozen before assignment, and rejected or abandoned cases should remain in the assignment record. Sample size must be planned for a prespecified effect, outcome variance, allocation unit, acquirer clustering, attrition and follow-up. The fifty-deal calibration exercise estimates the precision of a mean retention factor and does not establish the number needed per trial arm.
| Element | Requirement | Reason |
|---|---|---|
| Unit and sub-unit | Deal; claimed synergy line by ledger account | Allows the double counts to be located |
| Timestamps | Announcement, completion, each restatement, quarterly measurement | Separates the approval-date case from later outcomes |
| Baseline | Base figure, independence statement, standalone plan retained at signing | Gives the counterfactual against which savings are measured |
| Outcomes | Measured run-rate and cash-to-date; forecast remaining cash and ten-year value shown separately | Keep observed follow-up distinct from projected lifetime value |
| Missing deals | Abandoned, untracked and unreported deals recorded | Limits the selection shown in the reporting experiment |
| Consent and privacy | Written agreement; aggregate reporting; personal data removed | Commercial confidentiality and data protection |
| Randomised component | Eligible cases assigned before final approval; allocation and analysis pre-specified | Supports assignment-based evaluation under the specified design and follow-up assumptions |
| Sample size | Plan from the target effect, variance, randomisation unit, clustering, attrition and follow-up | Mean-factor precision does not establish treatment-effect power |
| Analysis plan | Pre-registered ratios, intervals, and the unadjusted comparison | Defines the measures before outcomes are examined |
MatchPoint proposal. The table specifies what a study would collect; it reports no data.
The point of assignment matters if the review can change which acquisitions proceed. A prospective study would define eligible opportunities before the final investment decision and retain every assigned opportunity in its decision analysis, including rejected and abandoned cases. A separate completed-deal analysis would measure integration outcomes within its narrower population and state the resulting selection limitation. Review effort, implementation expenditure and the date at which an outcome becomes observable should also be recorded. The appropriate randomisation unit would depend on whether the same people or information can affect multiple cases. A study-specific analysis plan would address that dependence before claiming an effect of the review.
For a proposed multi-company pilot, the data dictionary would separate financial amounts, event dates, document references and any personal identifiers. A controlled linkage key could connect approved records without placing employee names in the analytical table. This is a proposed safeguard and would not, by itself, establish anonymity. The protocol would identify who can access the original evidence, how corrections are recorded, when records are removed and which aggregate results may be released. Firms would also agree how disputed outcome measurements are handled before comparative results are examined. These arrangements require agreement before recruitment and collection.
21 Report the bridge, decision range and evidence status together
The committee paper should present the announced case and the bridge side by side. For each of the seven adjustments it should show the value of the adjustment, the evidence behind the parameter, the owner of that evidence and the order-averaged attribution. The headline should be the value survival and the price coverage, with the run-rate survival beside them so that the committee can see whether the problem is the baseline or the timing.
A range should accompany the central case. The stress table shows the form: the base case, each single stress, and the combined case. The paper recommends reporting the combined case as the downside and stating the share of the announced value that the price pays away, so the reader can see where the price sits against the range. The model result here is a constructed case with value survival of 29.8% at base and 2.4% when stresses are combined, and it carries no prediction for any deal.
The report should also say what has not been verified. Each parameter should be marked as verified from a ledger or contract, estimated from a comparable, or assumed. This follows the discipline in Rule 28.6 on the bases of belief and the principal assumptions. [1] A table that mixes the three statuses without saying so presents an assumption as a finding, which is the error the paper is about.
The version history should preserve the original underwriting case. Management can add a revised operating forecast without replacing the price-approval baseline used to evaluate delivery. A proposed change record would identify a new fact, a changed assumption, its financial consequence and the person approving its treatment. It would also distinguish an error correction from a deliberate change in strategy. This allows a board to see whether a favourable updated forecast reflects new value, a lower starting baseline or additional expenditure. The paper recommends retaining both the original comparison and the current decision view.
Evidence status should remain attached to individual cash assumptions when the committee compares the cases. A contractual amount can have an uncertain payment date, and a confirmed operational milestone can leave its incremental financial effect unresolved. The proposed report would therefore separate amount, timing, attribution and funding questions. It would identify which assumption moves the decision across the price-coverage threshold and what further evidence could resolve that question. An arbitrary average confidence score would lose those relationships. The experiment does not assign evidence scores or estimate probabilities for its deterministic stresses; those judgements remain outside the reported calculations.
22 In a live transaction obtain the base figure and costs first, price against the combined case and review at fixed dates
The decision rule has four steps. First, obtain the seller's synergy case at line level with a base figure and an independence statement for each line, and the costs and disbenefits. If the seller cannot supply them, treat the case as unverified and set its weight in the price accordingly. Second, rebuild the bridge with parameters marked by evidence status. Third, compute the share of announced value that survives in the base and combined cases. Fourth, set the maximum share of announced value to be paid to the seller no higher than the survival share in the combined case, unless the committee has a stated reason to accept more.
The third step uses the stress table: in the constructed deal the base survival is 29.8% and the combined survival 2.4%, so the rule would cap the share paid away at 2.4% of announced value, below the whole range of 10 to 50 per cent authored for the population. The result is conditional on the authored inputs and would differ for a real deal. What generalises is the structure of the test, in which the price is compared with the downside case and not with the announced case.
After signing, proposed checkpoints at twelve, twenty-four and thirty-six months compare measured run-rate and realised cash-to-date with the corresponding original forecast. Remaining cash and ten-year value continue to be forecasts until observed. The data cut and incomplete follow-up should be stated. With other inputs fixed, the isolated model stresses indicate where a reviewer might investigate. Concurrent or offsetting changes, tax, discounting and horizon choices can produce similar statistics. These signposts organise a review and do not identify a cause in an actual transaction.
The operational exhibits below translate the proposed record into a sequence, a role allocation and a ledger structure. They describe information to obtain and decisions to document. They contain no actual transaction timetable, assigned individual or validated saving. The roles should be adapted to the acquisition's governance and legal responsibilities before use. Their purpose is to make ownership of the baseline, implementation funding and benefit evidence visible at the point of a decision. A workstream completion can then be recorded separately from the finance team's assessment of an incremental cash benefit.
| Decision point | Evidence to retain | Decision recorded |
|---|---|---|
| Before final price approval | Original standalone plans, line-level claims, implementation budget and downside bridge | Amount of price supported by the defined synergy case |
| Signing to completion | Permitted information access, contract dependencies and funded implementation commitments | Unresolved conditions and accountable owners |
| Day One | Opening baseline, authorised ledger, workstream responsibilities and measurement rules | Approved starting record and exceptions requiring escalation |
| First hundred days | Dated completion evidence, expenditure, customer effects and forecast revisions | Changes requiring a cash-bridge or funding decision |
| Twelve, twenty-four and thirty-six months after completion | Measured outcomes and preserved original underwriting case | Original-case delivery, current outlook and unresolved attribution |
Proposed operating sequence, to be adapted to the transaction. The dates are review conventions, not observed delivery evidence or mandatory legal deadlines.
| Activity | Deal sponsor | Finance | Integration lead | Workstream owner | Legal or tax specialist |
|---|---|---|---|---|---|
| Approve the price contribution | A | R | C | C | C |
| Freeze the economic baseline | I | A | C | R | C |
| Resource and execute the workstream | I | C | A | R | C |
| Reconcile realised cash and claims | I | A | C | R | C |
| Approve a material plan change | A | R | R | C | C |
Proposed roles only. A means accountable, R responsible, C consulted and I informed. Each row has one accountable role. Specialist sign-off and statutory responsibilities must be determined separately for the actual transaction.
| Field | Record required | Review question |
|---|---|---|
| Economic event and owner | Contract or account, workstream and accountable role | Does another claim refer to the same event? |
| Original standalone baseline | Dated approved plan and independently achievable movement | Which benefit was already included? |
| Incremental operating effect | Volume, price, marginal cost and displacement | What incremental cash does the combination support? |
| Implementation and tax | Dated spending, recurrence, deductibility and cash-tax assessment | What must be paid and when can any tax effect be used? |
| Measurement and revision | Evidence date, original forecast, current forecast and approved reason | Is a changed assumption being presented as delivery? |
| Price and outcome linkage | Relevant bridge entry, uncertainty and later measurement | Which approval conclusion changes? |
Proposed information schema. No actual client data, validated amounts or measured outcomes are shown. The tracker distinguishes completion of an activity from a supported incremental cash benefit.
The role matrix separates responsibility for delivering an activity from responsibility for accepting the financial claim. A workstream owner could document a completed system migration while finance still needs to establish the avoided contract payment and the absence of an offset elsewhere. The integration lead would retain delivery dependencies, and the sponsor would receive the resulting pricing or funding exception. Those are proposed information flows, subject to the actual governance arrangements. The matrix does not confer authority on an employee, replace specialist approval or establish that a benefit has occurred. Its use would be assessed through the quality of the resulting records.
23 Machine-assisted checks need source-linked records and outcome evaluation
The paper proposes testing machine assistance for extracting the seller's claimed lines, mapping accounts, flagging possible overlaps, comparing margin assumptions with contracts and searching standalone plans. The output would retain source locations, confidence flags and a human decision for each mapping. Extraction accuracy, missed overlaps, false flags and review time would be measured before claiming an improvement. This paper reports no observed tool performance.
A tool could assist in constructing and evaluating a no-deal baseline. Its counterfactual credibility would depend on the identification assumptions, data and validation design. Training on selectively disclosed outcomes could carry disclosure-selection bias where the relevant reporting pattern holds. Any claimed improvement should be evaluated on held-out eligible cases against a defined comparator, with leakage, decision errors and uncertainty reported. No trained tool or observed accuracy is reported here.
The proposed evaluation would connect extraction quality with decision consequences and operating cost. It would track changes in approval, price, uncertainty, review time and error detection, followed by outcomes where observable. Additional flags can be useful even when a recorded decision is unchanged, so their benefit and review burden should be assessed. The constructed model supplies proposed grading measures; a live evaluation requires defensible outcomes and comparators.
A controlled machine-assisted pilot could start with document extraction and duplicate-claim triage. Each proposed mapping should retain the exact source passage, document version, account or contract identifier and the human review outcome. A held-out evaluation would count false duplicate flags, missed overlaps, time spent reviewing and changes in the accepted cash bridge. Access permissions, retention and permitted processing should be reviewed before confidential records enter the workflow. These are proposed tests. No trained system, operating-cost reduction, forecasting accuracy or financial benefit has been measured in this paper. Evidence of a plausible output alone would be insufficient support for those claims.
24 Reproducibility controls and explicit limits govern the model's use
The model executes 45 assertions, grouped in Table 17. They include algebraic reconciliations, endpoints evaluated by the same valuation function, scenario checks, generator-conditional outcome comparisons and bookkeeping. The seeded repeatability control compares industry-baseline false-accept arrays in two five-replication runs. Separate independent review reproduced all 103 legacy scalar displays and ten dynamic tables and checked the scalar bridge, complete permutation attribution and stress cases. The assertions and that reproduction do not establish empirical calibration, comprehensive software coverage or the performance of an actual acquisition process.
Every parameter and distribution is authored. The generator embeds the relationships that the experiment examines, so the results are conditional method comparisons. They do not estimate real-deal leakage or establish the proposed framework's practical performance. The model omits terminal value, uses a single discount rate, excludes interactions with the standalone business and applies uniform tax. Revenue synergies use a single attainment factor. The regulatory conclusions are confined to the reviewed provisions and versions; transaction-specific legal and tax analysis remains necessary.
The next research decision is whether to assemble a consented, sufficiently informative set of dated deal and line-level records. It could estimate parameters and examine the proposed relationship between pre-deal performance and the no-deal baseline. Sample requirements depend on the question and design. Until such validation, the paper offers a proposed procedure and conditional model results, with no calibrated GCC survival rate.
| Control | Result |
|---|---|
| Order-averaged attributions sum to the total change | Passed, base deal and population |
| Sequential bridges in both orders sum to the total change | Passed |
| No adjustment returns announced value; all adjustments return surviving value | Passed |
| Tax scales value by one minus the rate; zero discount rate equals undiscounted sum | Passed |
| Longer delay lowers value; grid is monotone in baseline share and cost to achieve | Passed |
| Slippage and cost overrun leave run-rate survival unchanged | Passed |
| Oracle rule has zero error and zero false accepts | Passed |
| Perfect-information identities and evaluated-rule comparisons under the stated generator | Passed |
| Selection raises the reported share; weighting repairs part of the error | Passed |
| Fixed seed reproduces industry false-accept arrays in two five-replication runs | Passed |
| Number of asserted controls | 45 |
MatchPoint model controls. Fixed seeds; every number in the paper is produced by the model file in the paper folder or taken from a cited source.
A successful computational reproduction establishes that the recorded instructions produce the recorded outputs. Economic validity requires further evidence about the inputs, counterfactual and measurement process. The present model also omits entity-specific tax capacity, financing constraints, changes in standalone investment and benefits beyond its fixed horizon. Those boundaries should accompany any quoted retention factor or decision error. The proposed next step is a governed feasibility study that establishes data access and outcome definitions, then determines whether a prospective empirical design is practical. The constructed results should remain identifiable throughout that work.
The following registers state the constructed population, its observation errors and the separate experiment settings. Table 21 reports Monte Carlo precision from retained replication arrays. That precision conditions on the authored generator and any fixed calibration draws; it does not quantify uncertainty about real acquisition populations.
| Input or dependence | Authored generating rule |
|---|---|
| independence | All primitive draws independent except shared factors s and g reused as shown |
| s | Lognormal(log-location 0, log-sd 0.4) |
| u_v | Independent lognormal(log-location 0, log-sd 0.25) |
| C | 100*s*u |
| R | 200*s*v |
| g | Normal(0,1), observed without measurement error |
| o | Beta(2,14) |
| bC | clip(0.15 + 0.07*g + Normal(0,0.04),0,0.7) |
| bR | clip(0.20 + 0.05*g + Normal(0,0.05),0,0.7) |
| m | clip(Normal(0.18,0.03),0.05,0.30) |
| q | Beta(6,4) |
| dd | Gamma(shape6.25,scale0.012) |
| kappa | Lognormal(mean0.75,log-sd0.3), log-location=log(0.75)-0.3^2/2 |
| delay_years | [0, 1, 2] |
| delay_probabilities | [0.3, 0.5, 0.2] |
| seller_payment_share | Uniform(0.10,0.50), independent; payment=share*pretax announced value |
Authored generating assumptions; not market estimates. Lognormal parameters state log-location and log-standard deviation unless described otherwise. clip means the stated lower and upper limits. Normal(a, b) denotes a normal distribution with mean a and standard deviation b.
| Measurement | Authored observation or prediction rule |
|---|---|
| o | clip(o + Normal(0,0.04),0,0.6) |
| m | clip(m + Normal(0,0.03),0.03,0.4) |
| q | clip(q + Normal(0,0.12),0.05,1) |
| dd | dd*Lognormal(log-location -0.045, log-sd0.3) |
| kappa | kappa*Lognormal(log-location -0.03, log-sd0.25) |
| delay | With probability0.3, add independently equiprobable -1/+1, then clip0..3; otherwise unchanged |
| slope_calibration | 60 independent deals; each baseline share observed with independent Normal(0,0.03) error; use np.polyfit slope only and fixed authored centres0.15/0.20 |
| predictor | clip(authored centre+fitted slope*g,0,0.7); no estimated intercept or matching of individual firms |
Authored measurement errors and prediction rules. The pre-deal gap and fixed centres are privileged experiment information, not verified inputs available to every transaction team. Normal(a, b) denotes a normal distribution with mean a and standard deviation b.
| Experiment | Counts, seed and conditioning |
|---|---|
| rule_comparison | seed=2026; replications=200; deals_per_replication=300; independent_flat_factor_calibration_per_replication=100; independent_slope_calibration_per_replication=60 |
| gap_quintiles | seed=7; replications=100; deals_per_replication=500; independent_slope_calibration_per_replication=60 |
| pipeline | seed=11; cycles=400; candidates_per_cycle=40; selected=5; shrinkage_calibration_once=150; slope_calibration_once=60; normalised_score="V_est/W - seller_share"; posterior_assumptions_not_established=true |
| calibration | seed=21; replications_per_n=1500; n=[10,20,50,100,300]; reference_deals=20000; reference_seed=5; fixed_test_deals=2000; test_seed=6; test_payment_seed=8; misclassification_tested_factor_percentiles=[5,50,95] |
| disclosure | seed=33; replications=300; deals_per_replication=400; report_probability="logit^-1(-0.4+7*(true_ratio-0.35)) = logit^-1(-2.85+7*true_ratio)"; proxy="true_ratio+Normal(0,0.08), available for all deals"; fitted_propensity="Logistic intercept/slope fitted to report indicator on full deal frame and noisy proxy;25 Newton steps; Hessian ridge1e-9"; fitted_probability_floor=0.05; true_probability_oracle_floor=null; estimator="Self-normalised inverse-probability (Hajek) mean" |
| repeatability_control | seed=99; replications=5; deals_per_replication=300; repeated_calls=2; asserted_result="Only industry-baseline false-accept arrays compared" |
Exact settings of the retained numerical experiments. These counts define computations and do not establish empirical sample-size sufficiency.
| Conditional quantity | Mean | Monte Carlo standard error | Unit and conditioning |
|---|---|---|---|
| Matched false-accept share | 11.068 | 0.177 | Percent of accepted cases; 200 replications |
| Matched minus industry false-accept share | -2.232 | 0.132 | Percentage points; paired replications |
| Matched minus flat-factor false-accept share | -7.895 | 0.245 | Percentage points; paired replications |
| Matched minus industry rank correlation | 0.033790 | 0.000730 | Correlation units; paired replications |
| Matched selected forecast error | 3.371 | 0.139 | Percentage points; 400 cycles, fixed calibration |
| Shrunk selected forecast error | 0.018 | 0.134 | Percentage points; 400 cycles, fixed calibration |
Computed from retained replication arrays. Paired contrasts use common replications. Pipeline results condition on fixed calibration samples; simulation precision excludes field, parameter and external-validity uncertainty.
References
- The Takeover Panel. The Takeover Code, Rules 28, 28.1 and 28.6 and definition of quantified financial benefits statement, fourteenth edition; online provision versions dated 11 December 2023. https://code.thetakeoverpanel.org.uk/tp/rules/rule-28/rule-28-6.html
- Capital Market Authority, Saudi Arabia. Merger and Acquisitions Regulations, amended by Resolution 8-5-2023, 18 January 2023, Articles 2 and 41. Arabic is official; English translation. https://cma.gov.sa/en/RulesRegulations/Regulations/Documents/Merger%20and%20Acquisition%20Regulations.pdf Arabic: https://cma.gov.sa/RulesRegulations/Regulations/Documents/MERGER.pdf
- IFRS Foundation. IFRS 3 Business Combinations, paragraphs 32, 53 and B64(e), 2026 issued text. https://www.ifrs.org/content/dam/ifrs/publications/html-standards/english/2026/issued/ifrs3.html Australian corresponding text: AASB 3, compilation 6, prepared 1 October 2026, applicable to annual periods beginning 1 July 2026 to before 1 January 2027. https://standards.aasb.gov.au/aasb-3-dec-2022-0
- IFRS Foundation. IAS 36 Impairment of Assets, paragraphs 18, 43 to 47 and 80, 2026 issued text. https://www.ifrs.org/content/dam/ifrs/publications/html-standards/english/2026/issued/ias36.html Australian corresponding text: AASB 136, compilation 5, prepared 13 October 2026, applicable to annual periods beginning 1 July 2026 to before 1 January 2029. https://standards.aasb.gov.au/aasb-136-jan-2026-0
- IASB staff. Business Combinations: Disclosures, Goodwill and Impairment, Agenda Paper 18, Cover Paper, July 2026, paragraphs 1 to 6 and Appendix A. Staff analysis and tentative work. https://www.ifrs.org/content/dam/ifrs/meetings/2026/july/iasb/ap18-cover-paper.pdf
- United Arab Emirates. Federal Decree-Law No. 47 of 2022, as amended through No. 28 of 2025, Article 3; Ministry of Finance consolidated unofficial English translation, January 2026. https://mof.gov.ae/wp-content/uploads/2026/01/Federal-Decree-Law-No.-47-of-2022-and-its-amendments-en-v13.1.26.pdf Cabinet Decision No. 116 of 2022, Articles 2 to 3: https://tax.gov.ae/Datafolder/Files/Legislation/Corporate%20Tax/Cabinet%20Decision%20No.%20116%20of%202022%20-%20for%20publishing.pdf Cabinet Decision No. 142 of 2024, Article Two and annex Article 1.1: https://mof.gov.ae/wp-content/uploads/2025/02/English-Cabinet-Decision-142-of-2024-on-Top-up-Tax-on-MNEs-1.pdf FTA, Top-up Tax Scope and Registration announcement, 7 October 2026: https://tax.gov.ae/en/media.centre/News/federal.tax.authority.issues.new.guide.on.scope.and.registration.for.topup.tax.on.multinational.enterprises.aspx
- First Abu Dhabi Bank. Annual Review 2017, pages 13 and 18 to 19, and pro forma condensed consolidated financial-statements introduction. Bank publication, copy hosted by BankTrack. https://www.banktrack.org/download/annual_report_2017_87/181029_fab_full_annual_report_2017.pdf Corroborating bank-hosted February 2018 investor presentation, page 17: https://www.bankfab.com/-/media/fab-uds/about-fab/investor-relations/reports-and-presentations/presentations/pdfs/2018/fab-investor-presentation-feb2018.pdf?view=1
- First Abu Dhabi Bank. FGB-NBAD Merger Update, April 2017, printed pages 14 to 15, cost synergies and one-time integration costs. https://www.bankfab.com/-/media/fab-uds/about-fab/investor-relations/reports-and-presentations/presentations/pdfs/2017/merger-update-apr3.pdf?view=1
- Barber, B. M. and Lyon, J. D. (1996). Detecting abnormal operating performance: The empirical power and specification of test statistics. Journal of Financial Economics 41(3), 359 to 399. https://leeds-faculty.colorado.edu/bhagat/BarberLyon1996.pdf
- Smith, J. E. and Winkler, R. L. (2006). The optimizer's curse: Skepticism and postdecision surprise in decision analysis. Management Science 52(3), 311 to 322. DOI: 10.1287/mnsc.1050.0451. https://gwern.net/doc/statistics/decision/2006-smith.pdf
- Feldman, E. R. and Hernandez, E. (2022). Synergy in mergers and acquisitions: Typology, life cycles, and value. Academy of Management Review 47(4), 549 to 578. Author manuscript dated 25 January 2021. https://faculty.wharton.upenn.edu/wp-content/uploads/2016/11/Synergy-in-Mergers_FeldmanHernandez.pdf
- Devos, E., Kadapakkam, P.-R. and Krishnamurthy, S. (2009). How do mergers create value? A comparison of taxes, market power, and efficiency improvements as explanations for synergies. Review of Financial Studies 22(3), 1179 to 1211. DOI: 10.1093/rfs/hhn019. Abstract: https://ideas.repec.org/a/oup/rfinst/v22y2009i3p1179-1211.html
- Flyvbjerg, B. (2006). From Nobel Prize to project management: Getting risks right. Project Management Journal 37(3), 5 to 15. Author manuscript: https://arxiv.org/pdf/1302.3642
- IFRS Foundation. IASB Update, September 2026, Business Combinations: Disclosures, Goodwill and Impairment (Agenda Paper 18), meeting of 23 September 2026. https://www.ifrs.org/news-and-events/updates/iasb/2026/iasb-update-september-2026/ Project status: https://www.ifrs.org/projects/work-plan/goodwill-and-impairment/
- Bauer, F. and Friesl, M. (2024; first online 21 February 2022). Synergy evaluation in mergers and acquisitions: An attention-based view. Journal of Management Studies 61(1), 37 to 68. DOI: 10.1111/joms.12804. https://onlinelibrary.wiley.com/doi/full/10.1111/joms.12804
- United Arab Emirates. Federal Decree-Law No. 45 of 2021 concerning the protection of personal data, Articles 1 to 2, 4 to 6 and 28 to 31. Dubai Judicial Institute, Arabic compilation, first edition, 2023; government-hosted copy. https://assets.u.ae/api/public/content/954629a06cc64fd887771ce3273d6154?v=21d88839
- Shapley, L. S. (1952). A Value for N-Person Games. RAND. DOI: 10.7249/P0295. https://www.rand.org/pubs/papers/P295.html
About the Author
Chennakeshav (CK) is a corporate finance and investment banking executive with 25+ years of global experience in deal origination, structuring and execution across M&A, growth capital and corporate strategy. He has led value-creation mandates for founders, corporates and funds — bridging the boardroom view to hands-on execution and close.
His career spans Morgan Stanley, HSBC, Lloyds Banking Group, EWEC, ADQ portfolio companies and Emirates Growth Fund, across TMT, real estate, fintech, deeptech, cleantech, infrastructure and energy. He has partnered with C-suite leaders, private equity and venture funds, sovereign wealth funds and family offices to finance complex fund raises and scale-up ventures, and has led M&A due diligence, post-merger integration and business-transformation initiatives to create value.
At Matchpoint Partners he is Managing Partner, leading the firm's corporate finance, M&A and capital-raising practice. He holds an MBA from London Business School, an engineering degree from VTU and a Master of Laws (LLM, in progress) from UCL London.
An active start-up mentor, CK mentors at Techstars, DIFC FinTech Hive, Startup Grind, Founder Institute and IN5, serves as Entrepreneur Mentor in Residence (EMiR) at London Business School, and judges the Entrepreneurship World Cup.
https://www.linkedin.com/in/ckadya/
https://www.matchpoint-partners.com/team/ck-adya.html
Disclaimer
This paper is part of a continuing series on the structure of private and alternative markets. The views expressed are the author's own. The paper is for information only, describes market structure in general terms, and does not constitute investment, legal, tax or regulatory advice or a recommendation in respect of any security, vehicle or counterparty.
