

1 Frame integration choices as dated cash decisions
This paper considers four families of early integration decisions: customer pricing and terms, supplier terms, billing and payables systems, and the continuity of the finance roles that operate those processes. It asks how to compare their modeled cash consequences, how to identify the temporary funding requirement and what evidence would be needed to estimate their effects in an observed acquisition. The numerical example is a constructed experiment; its role is to make the assumptions and measurement choices inspectable.
Two difficulties shape the answer. First, acquisition accounting may change the opening basis, while growth, seasonality and measurement date affect the balance being compared. Second, early implementation choices may be related to the acquirer's finance capabilities and the target's complexity. The cohort experiment treats those characteristics as possible confounders through an authored assignment mechanism. It does not establish how real acquirers choose or the size of any independent capacity effect. We separate outcome definition, proposed mechanisms, conditional model results and the problem of attributing outcomes to choices.
We build the framework from accounting standards, payment-term law, company filings and the published research on acquisitions and trade credit [1, 2, 3, 4, 5, 6, 7, 8, 9, 10, 11, 14]. We then run an authored experiment on a constructed business with 4,000 replications for each of 54 packages of choices, and a second experiment on constructed cohorts of deals in which choices are made by the acquirer. The experiment reports no observed result. It shows how the measures behave when its stated mechanisms hold.
The decision owner should begin with a cash question precise enough to change an action. A request to improve working capital leaves the baseline, timing and permitted commercial sacrifices open. A usable question identifies the customer or supplier population, the operational choice, its intended start, the cash measure and the decision date. It also identifies who may change the choice when the early evidence disagrees with the assumptions. This paper proposes that structure for a buyer deciding how to sequence terms, billing and finance-team changes after completion.
The framework has three distinct uses. Treasury can test the incremental buffer needed for a proposed sequence. The integration office can turn a policy choice into dated operational records and accountable gates. A research team can specify which causal or descriptive claim those records support. The same spreadsheet may serve all three groups, but a recorded instruction, a simulated result and a verified bank receipt have different meanings. Keeping those meanings explicit makes the resulting analysis easier to challenge and reproduce.
2 Define incremental cash against an explicit operating baseline
The outcome is working capital released: the difference between the working capital the business would have carried had its pre-deal days been unchanged, given the same growth and seasonality, and the working capital it carries under the chosen package. Working capital is receivables plus inventory less trade payables. A positive release is cash freed. We count it at day 100, day 180 and day 360 from completion. A second outcome, net first-year cash, adds the change in contribution over twelve months and subtracts one-off costs net of any run-rate saving.
The status quo path matters. A business growing at six per cent a year with a seasonal cycle absorbs working capital even if nothing is changed. A before-and-after comparison therefore mixes the effect of the choices with the drift of the business. We also do not count the choices as successful merely because a days measure improved: customer losses reduce receivables and improve a balance, but they destroy margin, and the net measure includes that margin.
Acquisition accounting can change the opening comparison. For a business combination accounted for under the acquisition method, AASB 3 requires ordinary acquired receivables to be measured at acquisition-date fair value; B41 prohibits a separate acquisition-date allowance for uncertainty already included in that value [1]. The standard contains specified recognition and measurement exceptions. If initial accounting is incomplete, provisional amounts are adjusted for new information about facts and circumstances existing at acquisition; the measurement period ends when the required information is obtained or no longer obtainable, and cannot exceed one year [1]. Opening book and contractual balances may therefore differ without a cash movement. Section 20 tests an authored opening-basis adjustment. The corresponding IFRS 3 paragraphs are reproduced in the Australian standard; the applicable entity, reporting framework and period must be confirmed.
The incremental buffer is a treasury input defined outside the simulation. It represents cash or committed capacity available for integration deviations after the baseline operating forecast, minimum-cash policy, acquisition funding and other binding obligations have been considered. Restricted balances, unavailable facilities and funds needed by another legal entity do not become available merely because a modeled policy has positive year-end cash. The numerical case illustrates an incremental constraint; it does not calculate the combined group's total acquisition-financing requirement.
A cash-path measure should include the timing of every cost and saving represented by the experiment. The working-capital release series answers a balance-efficiency question. Adding cumulative contribution differences, subtracting cumulative implementation payments and adding cumulative savings produces an implementation-adjusted incremental cash series. The year-end value can reconcile to the existing net first-year measure while its lowest point changes materially. Payment timing is an assumption that must be disclosed; recognising an expense in the accounts and paying the associated cash are separate events.
Two summaries of a simulated path require different labels. Taking the minimum of the expected monthly cash series describes the trough in the average path. Taking each replication's minimum and then averaging those minima describes the expected pathwise trough. The dates of the minima can differ across replications, so those operations need not produce the same result. A lower percentile of pathwise minima and the frequency of buffer breaches add different information again. Real transaction outcomes remain outside the constructed experiment's validation.
3 Apply jurisdiction-specific payment and reporting boundaries
The EU framework requires a contract-specific legal check. Directive 2011/7/EU remains marked in force on EUR-Lex. For transactions between undertakings, Article 3(5) requires a contractual payment period of no more than 60 calendar days unless a longer period is expressly agreed and is not grossly unfair to the creditor; Article 7 requires remedies for grossly unfair payment terms or practices [3]. Article 12(3) permits national provisions more favourable to creditors, so the directive does not give a buyer an unconditional right to impose 60-day terms. The proposed replacement regulation, procedure 2023/0323(COD), is recorded as awaiting the Council's first-reading position. National implementation, governing law and the particular contract remain to be checked.
The United Kingdom has progressed from consultation to a Commercial Payments Bill. As checked on 8 November 2026, Parliament's record lists it in the Commons at second-reading stage and expressly records that it is not an Act [4]. The government describes a proposed 60-day maximum with limited exemptions and mandatory late-payment interest at 8 percentage points above the Bank of England base rate. Its ministerial answer of 19 October 2026 puts most measures in late 2027 or early 2028, subject to Parliamentary approval, Royal Assent and necessary secondary legislation; the bill generally provides for commencement regulations [4]. The statutory 8%-above-base rate already appears in current guidance, with a caveat for contracts specifying a different rate. The proposed mandatory regime must therefore be distinguished from existing entitlements. Gulf commercial-payment statutes were not reviewed; counsel must confirm the relevant rules before designing a term extension.
Supplier finance requires a separate reporting check. For entities subject to the relevant AASB 107 or corresponding IAS 7 requirements, paragraphs 44F to 44H require information about arrangements in which a finance provider offers to pay suppliers and the entity agrees to pay under the arrangement at the same or a later date [2]. Such arrangements can give the entity extended terms or give its suppliers earlier payment. Required information includes terms, liability carrying amounts and statement line items, amounts already paid to suppliers by providers, payment-date ranges against comparable payables, and the type and effect of non-cash liability changes, including business combinations. The amendments apply to annual periods beginning on or after 1 January 2024 and remain in the current 2026 compilation. Australian entities using AASB 1060 Tier 2 simplified disclosures have a separate framework; AASB 107's Appendix A excludes them from this standard. These rules provide no estimate of supplier acceptance.
4 Selected research describes aggregate acquisition and trade-credit patterns
Healy, Palepu and Ruback's earlier NBER working-paper abstract reports results for the 50 largest mergers between United States public industrial firms completed from 1979 to 1983 [7]. It reports industry-relative improvements in asset productivity and operating cash-flow returns, with capital-expenditure and research-and-development rates maintained relative to industry peers. This provides historical aggregate context. The accessible abstract supplies no estimate for the dated pricing, cutover or personnel choices defined here. The published 1992 journal version is a separate version; this discussion uses the working-paper abstract and its stated sample.
El Ghoul, Gong and Guedhami's abstract reports that privately held targets obtain more supplier trade credit and collect customer receivables more quickly after acquisition, alongside changes in retained earnings, parent funding and debt financing [8]. This directly overlaps the financing and collection mechanisms examined here. Our use is limited to the abstract's aggregate findings; it supplies no verified effect size for this paper's packages of early decisions. Hu, Mou and Tuilautala's abstract reports that listed United States firms with more trade credit are more likely to acquire, use cash offers and pay lower target premiums [14]. Those selection and financing associations address a different estimand from the post-completion working-capital effect of a dated operational choice.
The review covers the selective corpus identified here. These sources motivate the four decision families and the measurement and selection problems considered here; they do not validate the joint package effects in the authored ledger. The proposed contribution is a transparent counterfactual comparison at stated dates, with costs and liquidity headroom made explicit, and a design for collecting decision evidence. Its empirical usefulness and effect sizes would have to be assessed with suitable deal records. No claim of literature-wide novelty follows from the sources reviewed.
5 Test bargaining power and margin effects alongside payment terms
Fabbri and Klapper's accepted manuscript uses firm-level Chinese survey data, including information on trade-credit terms and customer payment history. Its abstract and introduction report that weaker supplier bargaining power is associated with more trade credit and longer offered payment periods, and that important customers extend payment beyond offered terms and generate overdue amounts [10]. The data description identifies the 2003 World Bank Enterprise Survey for China. These findings motivate a proposed mechanism in which powerful customers may resist a request to shorten terms after an acquisition. They do not establish the acceptance response to such a request, or its size.
Kieschnick, Laplante and Moussawi's abstract examines United States firms from 1990 to 2006. For the average firm, it reports a lower marginal valuation for an incremental dollar of net operating working capital than for cash; that valuation varies with expected sales, debt, financial constraints and bankruptcy risk, and the reported wealth association for an incremental dollar of customer credit exceeds that for inventory for the average firm [9]. These valuation associations motivate reporting the sales, margin and cost consequences alongside a balance release. They do not establish that reducing a particular receivable or inventory balance causes an increase in shareholder value.
These sources justify two features of the model: customer acceptance that varies with concentration, and a cost of lost revenue alongside any days improvement. Neither supplies a magnitude. The acceptance share, the dispute rate and the loss probabilities in the experiment are authored.
6 Historical filings report collection delays, DSO improvement and conversion forecasts
Amedisys's 2008 Form 10-K reports that days revenue outstanding rose by three days gross to 54.4 and two days net to 47.2. During the year it converted 145 acquired home health and hospice agencies, representing USD 257.3 million of net service revenue, to its operating and billing platforms [5]. Management describes conversion-related regulatory and internal delays, and separate private-payor processing problems. It also reports an industry-wide CMS document-control error holding USD 7.8 million of claims at year end; those funds arrived in February 2009. Management states that, without that hold, year-end days would have been 52.3 gross and 45.1 net. The filing therefore documents several concurrent influences on receivable days. It does not isolate the causal contribution of the conversion.
LabCorp's 1999 Form 10-K reports that year-end days sales outstanding improved to 74 from 83 at the end of 1998 [6]. Management describes company-wide collection efforts and claim-submission improvements, alongside continuing conversion of decentralised billing locations and cross-functional billing teams. It expected conversions combined with front-end improvements to reduce DSO to approximately 69 by the end of 2000. It also expected benefits to appear after conversion and expressly gave no assurance that planned conversions would improve DSO or collections. The historical DSO change and the forward-looking conversion forecast are distinct statements; the filing provides no isolated conversion effect.
These filings provide sector-specific management accounts of collection changes and expected systems benefits. Amedisys describes conversion friction alongside other delays; LabCorp reports an aggregate DSO improvement and forecasts later benefits from a combination of initiatives. Their healthcare payor processes differ from those of many commercial businesses. The ledger uses a transient cutover lag followed by an authored permanent gain as a proposed mechanism. Neither filing calibrates that lag, gain or failure probability.
7 Specify the finance-team capacity mechanism as an authored assumption
Cannella and Hambrick studied 96 acquisitions completed between 1980 and 1984 and report that executive departures from acquired firms were associated with worse post-acquisition performance, with departures of the highest-ranking executives appearing the most damaging, and that giving acquired-firm executives top management status in the combined firm was associated with better results [11]. Only the abstract was available. The study concerns senior executives and an overall performance measure.
The accessible abstract does not report effects for credit controllers, payables staff or stock planners, or provide receivable, payable or inventory-day coefficients. The ledger's assumption that loss of these staff reduces operating capacity is authored: it raises receivable and inventory days and shortens payable days in proportion to the share lost. Sensitivity analysis varies that assumption. A live decision would require evidence about the target's actual staff roles and processes; executive-departure findings do not supply the magnitude.
Table 1 summarises what each source establishes and what it does not, so that the design in the next sections can be read against the evidence.
| Source | Status | Establishes | Leaves open |
|---|---|---|---|
| Acquisition standard [1] | Selected official AASB 3 provisions; current reporting-period version checked | Acquisition-date fair-value receivables; restricted measurement period of at most one year | Applicable framework/period; cash effect of a choice |
| Supplier finance [2] | Official amendment and current 2026 AASB 107 provisions | Applicable supplier-finance and non-cash-change disclosures | Other reporting frameworks; supplier take-up |
| Late payment directive [3] | EU framework marked in force; pending replacement procedure checked | B2B express-agreement/gross-unfairness limits; national creditor protection | Relevant national implementation and Gulf payment rules |
| UK Commercial Payments Bill [4] | Commons second-reading stage; not an Act at 8 November 2026 | Proposed 60-day maximum with exemptions and mandatory interest; conditional implementation timing | Final law, commencement and applicable contract detail |
| Company filings [5, 6] | Filed historical figures and management statements | Reported collection delays and DSO improvement; later conversion forecast | Isolated conversion effect or realised forecast |
| Acquisition and trade-credit research [7, 8, 14] | Abstract-level contextual evidence; versions identified | Reported operating-cash-flow [7] and financing [8] patterns; acquisition/payment-method selection [14] | Effects of this paper's dated decision packages |
| Working-capital research [9, 10] | Abstract and selected accepted-manuscript evidence | Marginal valuation associations; bargaining power and credit terms | Causal post-deal magnitudes and acceptance rates |
| Executive departures [11] | Institutional abstract | Executive departures associated with worse performance | Operating finance-staff capacity and working-capital effects |
Author synthesis of the selective source corpus. Framework and version limits apply; no model output.
8 Enumerate 54 interdependent integration packages
The experiment groups the early choices into four families. Pricing has three levels: hold prices and terms, align customer payment terms to the group standard, or align the price list as well as the terms. Supplier terms have two: hold or extend to the group standard. Systems have three: keep ledgers separate, cut billing and payables over at month 2, or cut over at month 4 after a data clean-up. Personnel has three: take no action, grant retention awards to credit, payables and planning staff, or consolidate those teams into a shared service.
Every combination is a package, so there are 54. Using a full grid, not a few named scenarios, allows two things that case examples do not: the effect of each choice can be averaged over the others, and interactions can be measured. It defines the sample-highest outcome and equal-weight package average within this finite authored design for each stated criterion. Table 2 lists the levels, their timing and their cost. The codes are used throughout, with A for pricing, B for supplier terms, C for systems and D for personnel.
| Family | Level | Choice | Timing in the model | Cost, USD million |
|---|---|---|---|---|
| Pricing | A0 | Hold prices and terms | None | 0.0 |
| Pricing | A1 | Align customer terms | Starts month 1; 17-day cut scaled by acceptance, invoice compliance and gradual transition | 0.2 |
| Pricing | A2 | Align price list and terms | Starts month 1; as A1 plus gradual price-list alignment | 0.4 |
| Supplier terms | B0 | Hold supplier terms | None | 0.0 |
| Supplier terms | B1 | Extend supplier terms | Starts month 1; 19-day extension scaled by acceptance, compliance and gradual transition | 0.2 |
| Systems | C0 | Keep ledgers separate | No cutover in the first year | 0.0 |
| Systems | C1 | Cut over billing by day 60 | Billing and payables cut over at month 2 | 1.8 |
| Systems | C2 | Cut over at day 120 after clean-up | Cut over at month 4 after data clean-up | 1.5 |
| Personnel | D0 | No action | Attrition follows the deal announcement | 0.0 |
| Personnel | D1 | Retention awards | Retention awards for credit, payables and planning staff | 1.2 |
| Personnel | D2 | Consolidate into shared service | Teams move at month 2; saving from month 4 | 1.0 less saving |
Author analysis of the constructed case. Authored inputs; costs in USD million.
The decision dictionary should distinguish intention, communication and actual exposure. A management approval date records intent. A notice date records communication. The first invoice issued on changed terms, the first accepted payment under those terms and the date a credit-control queue moved record different operational events. The proposed study would retain all of them. Combining them into one integration-start variable can put cash movements in the wrong period and can classify a policy as implemented while counterparties are still operating under the old arrangement.
Scope belongs in the same dictionary. A price or term change may cover a legal entity, product, customer segment or invoice vintage. A systems move may cover only new invoices while old receivables stay in a legacy ledger. Retention arrangements may apply to selected roles rather than the entire finance function. The constructed grid deliberately simplifies those boundaries. An implementation plan would record the covered and uncovered populations and the rule for moving between them, so that a package name never substitutes for evidence of what actually happened.
9 A days-based ledger turns each choice into balances and cash
The ledger uses monthly observations. Receivables, inventory and payables combine annualised flows with days measures. Working-capital release is the steady-capacity comparator balance less the package balance. The implementation-adjusted incremental cash proxy adds accumulated contribution differences, subtracts the modeled one-off cash cost and adds accumulated shared-service savings. Its twelve-period endpoint reconciles to net first-year cash.
In equation 1a, R and C are annualised revenue and cost of goods sold, DSO, DIO and DPO are receivable, inventory and payable days, and SQ denotes the steady-capacity comparator. Release is NWC under SQ less NWC under the package. Equation 1b defines X at integer periods t=0,..., 12. K is the complete modeled one-off implementation cost, assumed paid at completion in this timing illustration. S is total modeled savings through period 12: USD 0.675 million for consolidation and zero otherwise, credited in nine equal installments from periods 4 through 12. Each month's annualised contribution difference is divided by 12 and accumulated through t. X at period 12 equals the defined net first-year measure. Purchase price, financing costs, tax, other baseline obligations and within-period extrema are outside this proxy.
Each days measure moves through authored transitions. A permanent shift starts at month s and closes at rate tau, and a transient shock decays from its start. The receivable days are the main example.
Equation 2a defines the gradual transition phi. Define psi(t;s,tau) as zero before t=s and as exp(-(t-s)/tau) from t=s onward. For equation 2b, I_A is one when customer terms are changed, I_C is one for either systems cutover, and I_D2 is one for consolidation. Customer-acceptance share alpha remains distinct from invoice compliance c_t, which is 0.70 before one period after cutover and 1 thereafter. Let s_C be 2, 4 or 99 for early, gated or no cutover.
The term component T_t equals -17 times alpha times c_t times phi(t; 1,2) times I_A. Pricing-dispute component D_A(t) is 35 q_Apsi(t; 1,5), where q_A selects q1 or q2 for the chosen pricing level and is zero for no pricing change. Systems-dispute component D_C(t) is 35 q_Cpsi(t;s_C,5), where q_C is 0.010 for early cutover, 0.005 for gated cutover and zero otherwise.
Cutover lag J_C(t) is L_C(1+2F_C)psi(t;s_C,2), with L_C equal to 6, 3 or 0 days and F_C the selected failure draw. Process gain G_t equals -1.5I_Cphi(t;s_C+3,3)-2I_D2phi(t; 5,3). Personnel component P_t is 28 times the modeled capacity-loss path. These authored components reproduce the coded activation conditions and keep receivable days at 62 at completion.
The schedule labels use a 30-day-month display convention: day 100 maps to 100/30 periods, day 180 to period 6 and day 360 to period 12. Balance calculations use a 365-day denominator, while each monthly annualised contribution difference is divided by 12 before accumulation. These conventions are explicit approximations in the constructed ledger. Applying the framework to a transaction requires actual calendar dates and payment records; the simulation does not validate a calendar-day cash forecast.
10 The constructed business and its authored inputs fix the scale of every number
The customer-term transition uses an authored 17-day reduction scaled by acceptance and invoice compliance. Compliance is 0.70 before one period after a systems cutover and 1 afterwards; accepting and complying are separate mechanisms. Pricing-dispute shares use independent uniforms conditional on the modeled deal characteristics. Disputed invoices are not assigned specifically to non-accepting customers. Supplier extension uses an authored 19-day increase scaled by acceptance and compliance, together with authored price, stock and disruption responses.
Cutting billing over creates an invoicing lag that is larger if the cutover fails, followed by a small permanent gain in receivable and inventory days once data are unified. Staff loss reduces collections, payables and planning capacity, which raises receivable and inventory days and shortens payable days in proportion to the share lost. Consolidation causes a larger temporary capacity loss and then a saving and a small process gain. Two authored stochastic events add tail risk: the loss of a key account after pricing changes, and a supplier shock after extension.
The constructed business starts with annual revenue of USD 240 million, six per cent growth and six per cent seasonal amplitude. Opening receivable, inventory and payable days are 62, 48 and 41. They imply opening working capital of USD 44.0 million, 18.3% of annual revenue, and a cash-conversion cycle of 69 days. One revenue-day is USD 0.66 million. The customer and supplier term benchmarks are 45 and 60 days. These values provide an authored numerical scale; they are not calibrated to a named company or an observed industry distribution.
The uncertain quantities follow authored beta distributions or Bernoulli events. The 54 packages share the same 4,000 draws, so paired package differences use common random numbers. Table 3 records the selected inputs and their status. The experiment describes conditional scenario distributions. It does not estimate their parameters from field data, establish that the target follows those distributions or measure uncertainty about the chosen parameter values.
| Input | Value | Status |
|---|---|---|
| Target annual revenue | USD 240 million; growth 6%; seasonal amplitude 6% | Authored |
| Cost of goods sold and other variable cost | 70% and 2% of volume at baseline prices, before supplier adjustments | Authored |
| Opening days: receivables, inventory, payables | 62, 48 and 41 | Authored |
| Customer terms after alignment | 45 days, a cut of 17 days for accepting customers | Authored |
| Supplier terms after extension | 60 days, a gain of 19 days for accepting suppliers | Authored |
| Acceptance, customers and suppliers | Beta, means 0.55 and 0.50, concentration 20 | Authored |
| Dispute share and duration | Means 5% (A1), 9% (A2); 35 extra days, decay 5 months | Authored |
| Key-account loss | Probability 6% (A1), 20% (A2); 8% of revenue | Authored |
| Supplier shock after extension | Probability 15%; 60% of the gain reversed; inventory 8 days | Authored |
| Cutover disruption | Invoice lag 6 (C1) and 3 (C2) days; failure 30% and 10% | Authored |
| Capacity-loss distribution scales | Beta scale means 22% (D0), 7% (D1), 40% (D2); dynamic profiles differ | Authored |
| Capacity effect of staff loss | Receivables +28, inventory +14, payables -12 days per unit | Authored |
| Liquidity headroom | USD 3.0 million | Authored |
| Replications and seed | 4,000 per package; seed 20261014 | Fixed |
Author analysis of the constructed case. All entries are authored inputs, not observations. USD million unless stated.
11 Measure assumed staff-capacity loss against a steady-capacity baseline
The steady-capacity comparator preserves the initial operating days through the stated growth and seasonal path. The post-completion no-action package follows a separately authored staff-capacity-loss path. Their difference therefore measures the consequence of that assumed loss within the ledger. It is not an estimate of the acquisition itself, of announcement effects in an observed population, or of cash paid to acquire the business. Retention and consolidation comparisons inherit the same assumption and require sensitivity analysis.
The no-action package holds prices, terms and systems unchanged and follows the authored personnel-capacity-loss path. Its scale parameter has mean 22%; it is not a count of employees lost. The time profile includes gradual loss and partial recovery. Under those assumptions, the package has negative NWC release of USD 5.0 million at day 100 and USD 6.4 million at day 180, with USD 2.0 million still absorbed at day 360. Negative release means its working-capital balance is above the comparator. Net twelve-period cash is a loss of USD 2.05 million; 100.0% of the draws are below zero.
The receivable component accounts for USD 1.24 million of the day 360 shortfall. The finding is a direct consequence of the authored capacity effect: the larger the loss of collections capacity per unit of attrition, the larger the cost of inaction. The sensitivity analysis later shows that the do-nothing outcome stays negative in every case tested, which covers seven of the authored inputs. The point for a board is that a plan to hold everything steady is a decision about people, and it has a cash price.
12 Track temporary funding needs through an implementation-adjusted cash path
The uniform package selects customer-term alignment, supplier extension, early systems cutover and consolidation, package A1 B1 C1 D2. Selecting those policies does not imply immediate full acceptance or completion of their gradual effects. The constructed NWC release is negative USD 7.0 million at day 100, positive USD 1.2 million at day 180 and USD 11.3 million at day 360. Mean net twelve-period cash is USD 7.18 million after modeled contribution, cost and savings. The sample share with a negative terminal outcome is 0.3%.
Figure 1 shows implementation-adjusted incremental cash. The uniform package has mean pathwise minimum of negative USD 11.5 million, compared with its separate NWC-only mean minimum of negative USD 8.1 million. Its USD 3.20 million one-off cost is paid at completion under the stated timing assumption, so it immediately exceeds the illustrative USD 3.0 million incremental buffer in every draw. Positive terminal cash does not establish that the funding sequence fits that buffer. Table 4 keeps working-capital, terminal-cash and downside statistics distinct.
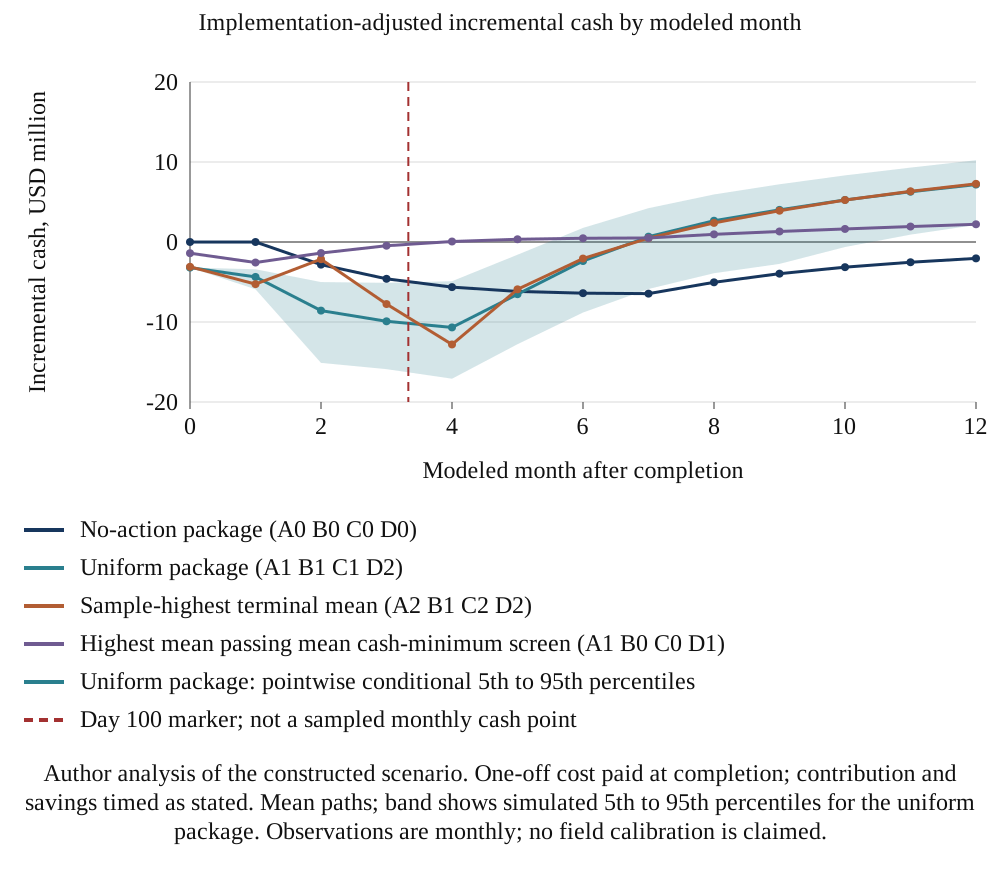
Author analysis of the constructed scenario. One-off cost paid at completion; contribution and savings timed as stated. Mean paths; band shows simulated 5th to 95th percentiles for the uniform package. Observations are monthly; no field calibration is claimed.
| Policy | Package | NWC rel. d100 | NWC rel. d360 | Net12 mean | Mean cash minimum | Cash-minimum 5th percentile | Buffer breach |
|---|---|---|---|---|---|---|---|
| No-action package | A0 B0 C0 D0 | -5.0 | -2.0 | -2.05 | -6.45 | -12.10 | 87.8% |
| Uniform package | A1 B1 C1 D2 | -7.0 | 11.3 | 7.18 | -11.53 | -17.16 | 100.0% |
| Sample-highest terminal mean of 54 | A2 B1 C2 D2 | -5.5 | 11.9 | 7.27 | -12.82 | -19.24 | 100.0% |
| Sample-highest terminal 10th percentile of 54 | A1 B0 C2 D2 | -6.8 | 8.5 | 5.74 | -13.50 | -19.04 | 100.0% |
| Highest mean passing mean cash-minimum screen | A1 B0 C0 D1 | 1.2 | 4.4 | 2.22 | -2.72 | -4.63 | 29.5% |
Constructed scenario, USD million. NWC columns report release against the steady-capacity comparator. Cash minimum is the mean of each draw's minimum implementation-adjusted cash over integer periods 0 to 12. The fifth percentile and breach share use those pathwise minima. H is an authored incremental buffer; probabilities are conditional simulation frequencies.
13 Receivables and payables supply the release; inventory and costs take part of it back
Table 5 splits day 360 working capital by component. For the uniform plan, receivables release USD 7.89 million and payables USD 4.06 million, while inventory absorbs USD 0.69 million as safety stock builds against supplier friction. Working capital is not the whole of the cash. The contribution change is a loss of USD 1.55 million over the year, from customer losses and supplier price increases, and one-off costs net of the saving of the shared service are USD 2.53 million. Net first-year cash falls from the working capital figure to USD 7.18 million.
The bridge shows why a days headline overstates the result. Of the USD 11.3 million released by day 360, USD 4.08 million is given back through lost contribution and net one-off cost. The loss will differ for a business with different margins and customers. What does not depend on the inputs is the requirement that a plan report all three lines: balances, margin and cost.
| Policy | Receivables | Inventory | Payables | Working-capital release at month 12 | Contribution change | Saving less one-off cost | Net first-year cash |
|---|---|---|---|---|---|---|---|
| Do nothing | -1.24 | -0.43 | -0.37 | -2.05 | 0.00 | 0.00 | -2.05 |
| Uniform plan | 7.89 | -0.69 | 4.06 | 11.26 | -1.55 | -2.53 | 7.18 |
| Highest mean | 8.61 | -0.07 | 3.32 | 11.86 | -2.16 | -2.43 | 7.27 |
| Highest mean passing mean cash-minimum screen | 4.57 | 0.20 | -0.41 | 4.37 | -0.75 | -1.40 | 2.22 |
Author analysis of the constructed case. USD million under stated inputs. Net first-year cash equals working-capital release plus contribution change, less one-off implementation cost, plus modeled savings.
14 In the model, pricing and customer terms carry most of the cash, and the choices interact
Table 6 reports the average effect of each level against the first level of its family, averaged over the other choices. Aligning customer terms adds USD 5.33 million of net first-year cash and aligning the price list as well adds USD 5.42 million. Supplier-term extension adds USD 1.04 million. Cutting over systems adds USD 1.86 million for the early cutover and USD 1.95 million for the gated one. Retention awards add USD 0.16 million and consolidation USD 1.79 million.
Table 7 allocates the move from no action to the uniform package over the 24 family orderings. The terminal-cash shares are USD 5.01 million for pricing, 0.81 for supplier terms, 1.59 for systems and 1.82 for personnel, summing to 9.23. The single-family gains sum to 5.92; their difference from the joint gain is 3.31. Within the code, customer-term effects are scaled by invoice compliance of 0.70 before the specified post-cutover point and 1 afterward. Acceptance remains a separate share. Those assumed interactions explain the constructed allocation; their sizes require target-specific evidence for practical use.
In equation 3, v is the mean outcome of an evaluated package. In vector z-minus, families preceding i in ordering pi are at their uniform-package levels and all other families are at baseline. Vector z-plus differs only by moving family i to its uniform level. Averaging the marginal difference over all 24 orderings gives its Shapley allocation. Equation 3b is the efficiency identity: the allocations sum to the uniform-package outcome less the no-action outcome. This is an allocation convention within the constructed design, not an isolated causal contribution in an observed deal.
The attribution is not a claim of what pricing would do in any real deal. It states how the authored mechanisms divide the result, and in one respect the division is robust to the inputs tested: the highest-mean package aligns customer terms in 14 of 14 sensitivity runs, and pricing holds the largest share of the release in the base case.
| Family | Level | Choice | Day 100 effect | Day 360 effect | Net first-year effect | Mean pathwise implementation-adjusted cash minimum |
|---|---|---|---|---|---|---|
| Pricing | A0 | Hold prices and terms | 0.00 | 0.00 | 0.00 | -10.5 |
| Pricing | A1 | Align customer terms | 3.33 | 6.27 | 5.33 | -8.1 |
| Pricing | A2 | Align price list and terms | 3.49 | 7.18 | 5.42 | -8.6 |
| Supplier terms | B0 | Hold supplier terms | 0.00 | 0.00 | 0.00 | -9.2 |
| Supplier terms | B1 | Extend supplier terms | 1.38 | 2.04 | 1.04 | -8.9 |
| Systems | C0 | Keep ledgers separate | 0.00 | 0.00 | 0.00 | -6.1 |
| Systems | C1 | Cut over billing by day 60 | -2.22 | 3.66 | 1.86 | -11.8 |
| Systems | C2 | Cut over at day 120 after clean-up | 0.00 | 3.45 | 1.95 | -9.3 |
| Personnel | D0 | No action | 0.00 | 0.00 | 0.00 | -7.9 |
| Personnel | D1 | Retention awards | 3.37 | 1.36 | 0.16 | -6.6 |
| Personnel | D2 | Consolidate into shared service | -4.62 | 2.12 | 1.79 | -12.7 |
Author-constructed scenario, USD million. Day 100 and day 360 columns are NWC-release effects against level zero of the family; the net column is the corresponding terminal-cash effect, averaged over the other families. The final column is the level-specific mean of each draw's lowest implementation-adjusted cash value over integer periods 0 to 12, averaged over other families; it is a level statistic rather than a level-zero contrast.
| Family and level in the uniform plan | Share of day 100 change | Share of day 360 change | Share of net first-year cash | Change in mean pathwise implementation-adjusted cash minimum |
|---|---|---|---|---|
| Pricing (A1) | 3.58 | 5.96 | 5.01 | 3.09 |
| Supplier terms (B1) | 1.57 | 1.82 | 0.81 | 0.58 |
| Systems (C1) | -2.46 | 3.39 | 1.59 | -4.63 |
| Personnel (D2) | -4.65 | 2.14 | 1.82 | -4.12 |
| Total, from do nothing to the uniform plan | -1.96 | 13.30 | 9.23 | -5.08 |
Author-constructed scenario, USD million. The first two allocations concern NWC release at day 100 and day 360; the third concerns terminal net cash and the final allocation concerns the mean pathwise implementation-adjusted cash minimum. Each column sums to its uniform-minus-no-action change by construction.
15 Compare implementation timing with working-capital and cash-path risk
Figure 2 contrasts the day 100 NWC-release effect with the net first-year cash effect, each averaged over the other choice families. Early cutover reduces day 100 NWC release by USD 2.22 million relative to separate ledgers and adds 1.86 million to terminal net cash. Consolidation reduces day 100 NWC release by 4.62 million and adds 1.79 million to terminal net cash. Their separate day 360 NWC effects, 3.66 and 2.12 million, are reported in Table 6. Retention awards add 3.37 million to day 100 NWC release and 0.16 million to terminal net cash. Customer-term alignment adds 3.33 million to day 100 NWC release.
Figure 3 compares mean terminal cash with the incremental buffer covering 95 per cent of sampled monthly cash minima. The sole package satisfying the mean-minimum screen at H = USD 3.0 million is A1 B0 C0 D1. Its mean terminal cash is USD 2.22 million, mean pathwise cash minimum is negative 2.7, and minimum of the mean path is negative 2.6. Its sample fifth-percentile minimum is negative 4.63 million, and its buffer-breach frequency is 29.5%. The separate 5 per cent breach-frequency screen admits no package. The mean screen therefore provides a different and materially weaker condition than the stated downside screen.
With A1, B1 and D2 held fixed, early cutover C1 has day 100 NWC release USD 1.22 million below gated cutover C2. Its mean pathwise implementation-adjusted cash minimum is USD 1.53 million higher, meaning less negative, under the stated cost-at-completion convention. This is a cash-path contrast, distinct from the NWC-only minimum. Earlier cutover changes invoice compliance sooner, while the packages also differ in cutover lag, dispute rates, failure probabilities and one-off cost. The joint comparison is conditional on those authored mechanisms.
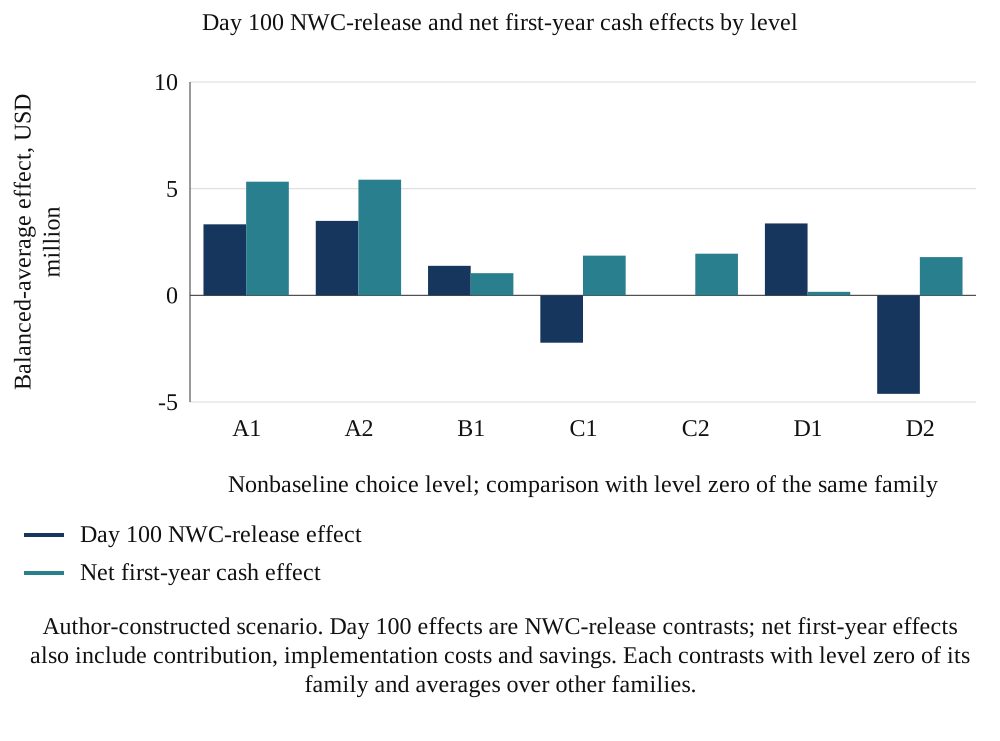
Author-constructed scenario. Day 100 effects are NWC-release contrasts; net first-year effects also include contribution, implementation costs and savings. Each contrasts with level zero of its family and averages over other families.
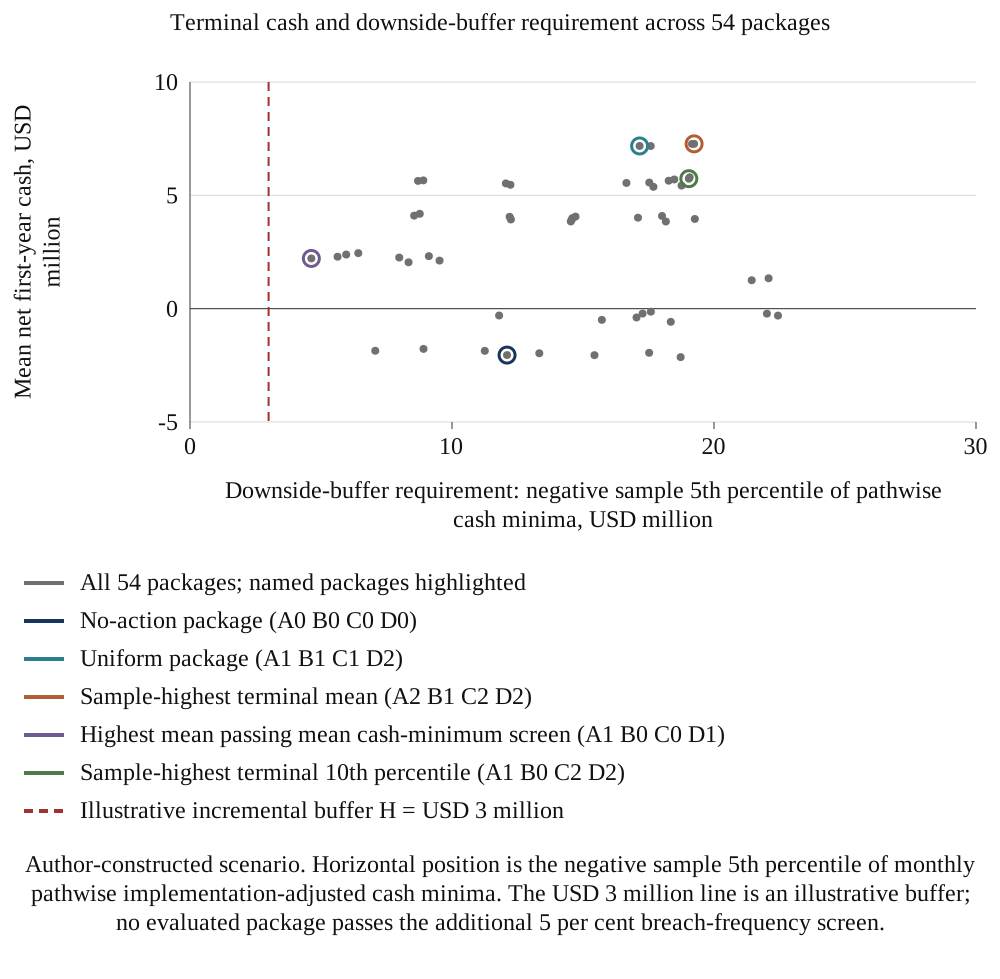
Author-constructed scenario. Horizontal position is the negative sample 5th percentile of monthly pathwise implementation-adjusted cash minima. The USD 3 million line is an illustrative buffer; no evaluated package passes the additional 5 per cent breach-frequency screen.
16 Evaluate finite-grid choices against declared cash and risk criteria
The sample-highest estimated mean among 54 packages is A2 B1 C2 D2 at USD 7.27 million; the equal-weight package mean is 2.71. The uniform package produces 7.18, 0.09 below that sample-highest mean. The two leading means differ by about USD 0.003 million, with paired Monte Carlo standard error about USD 0.012 million. Their ordering is not resolved by that simulation precision. The comparison is restricted to the evaluated design and chosen distributions, with parameter and field uncertainty outside the calculation.
A sample-highest estimated tenth percentile identifies package A1 B0 C2 D2, with terminal tenth percentile USD 4.03 million and mean cash 5.74. Its implementation-adjusted mean pathwise minimum is negative 13.5 million. The mean-minimum-screen package has tenth percentile 0.82. These are different descriptive selection criteria; neither substitutes for the additional breach-frequency screen. Under the stated H and 5 per cent limit, the evaluated design contains no admissible package.
Figure 4 shows terminal net-cash distributions for the no-action, uniform, sample-highest-mean and mean-minimum-screen packages. Their standard deviations are USD 0.96, 2.38, 2.38 and 1.09 million respectively. The last package is selected by the mean pathwise-minimum screen; its dispersion and its separate buffer-breach frequency answer different questions. The plotted conditional distributions do not establish the acquirer's acceptable risk or available liquidity.
Table 8 reports the endpoint sensitivity experiment: seven authored inputs are varied individually to low and high settings, with the base case shown. It reports terminal mean cash and the highest estimated mean in the finite design. The uniform-package gap ranges from USD 0.08 to 0.23 million across those cases. Other assumptions remain fixed. This partial endpoint sensitivity exercise evaluates terminal outcomes only; implementation-adjusted cash-path and downside-screen sensitivity for those scenarios require a separately specified test.
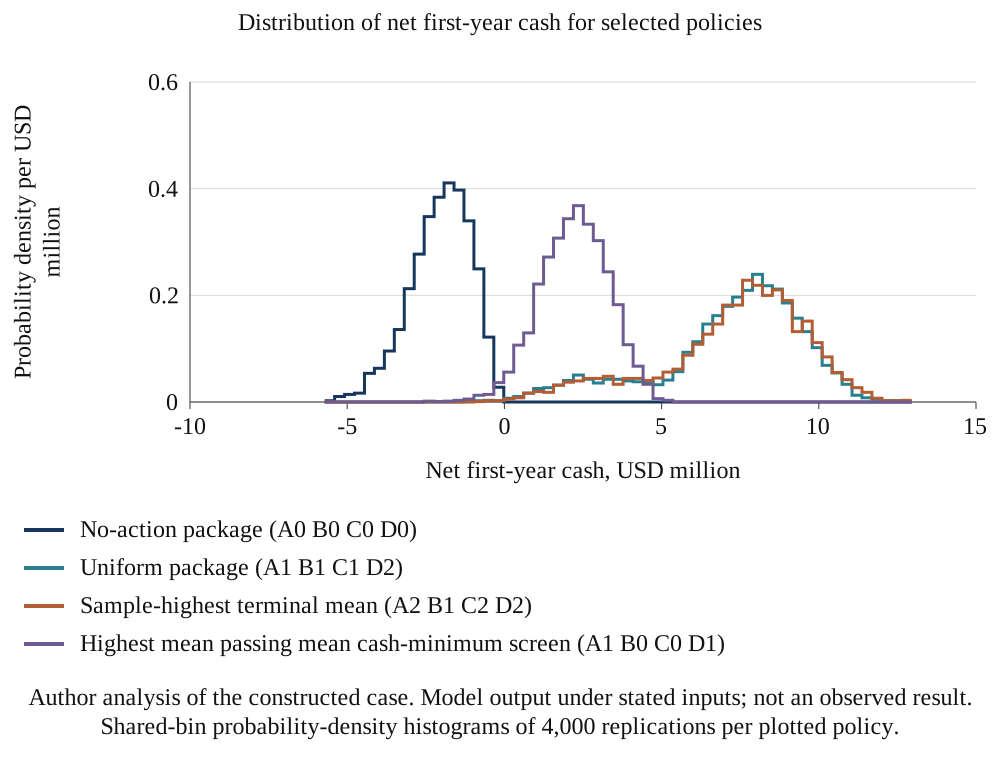
Author analysis of the constructed case. Model output under stated inputs; not an observed result. Shared-bin probability-density histograms of 4,000 replications per plotted policy.
| Input changed to | Highest mean package | Its net cash | Uniform plan net cash |
|---|---|---|---|
| Base inputs | A2 B1 C2 D2 | 7.27 | 7.18 |
| Customer acceptance of aligned terms, 0.4 | A2 B1 C2 D2 | 5.57 | 5.43 |
| Customer acceptance of aligned terms, 0.7 | A1 B1 C2 D2 | 9.01 | 8.92 |
| Capacity-loss scale without personnel action, 0.12 | A2 B1 C2 D2 | 7.27 | 7.18 |
| Capacity-loss scale without personnel action, 0.32 | A2 B1 C2 D2 | 7.27 | 7.18 |
| Probability of loss of a key account under A2, 0.1 | A2 B1 C2 D2 | 7.41 | 7.18 |
| Probability of loss of a key account under A2, 0.35 | A1 B1 C2 D2 | 7.27 | 7.18 |
| Probability of a supplier shock after extension, 0.05 | A1 B1 C2 D2 | 7.78 | 7.69 |
| Probability of a supplier shock after extension, 0.3 | A2 B1 C2 D2 | 6.54 | 6.42 |
| Probability that an early cutover fails, 0.15 | A2 B1 C2 D2 | 7.27 | 7.19 |
| Probability that an early cutover fails, 0.5 | A2 B1 C2 D2 | 7.27 | 7.17 |
| Supplier acceptance of longer terms, 0.3 | A2 B1 C2 D2 | 6.45 | 6.33 |
| Supplier acceptance of longer terms, 0.7 | A1 B1 C2 D2 | 8.12 | 8.03 |
| Collections capacity effect on receivable days, 18 | A1 B1 C2 D2 | 7.65 | 7.56 |
| Collections capacity effect on receivable days, 40 | A2 B1 C2 D2 | 6.82 | 6.72 |
Author analysis of the constructed case. Model output under stated inputs; not an observed result. Each row changes one of seven authored inputs to a low or high value, others held at base; uniform plan is package A1 B1 C1 D2. USD million.
17 Report cross-date rank agreement within the constructed grid
Table 9 compares NWC-release rankings at stated dates with terminal net-cash rankings. At day 100, 44 of 54 package means have negative NWC release, and the rank correlation with mean net first-year cash is 0.09. The ten packages with the highest day 100 NWC release share 2 members with the ten highest by mean net cash. The highest day 100 NWC-release package, A2 B1 C0 D1, has mean net cash USD 2.45 million, below the sample-highest terminal mean of 7.27 million. These statistics describe the evaluated finite design.
By day 180 the rank correlation is 0.75 and by day 360 it is 0.97. 39 package means have negative NWC release at day 100 and positive NWC release at day 360. An integration team judged on a day 100 cash measure is therefore rewarded for choices that avoid the early absorption, such as retention awards, and penalised for those that earn the later release. The implication is that a board should set dated gates that reflect the expected trough, not a single early target.
| Measurement date | Packages with negative mean NWC release | Rank correlation with net first-year cash | Overlap of top ten with the net ranking |
|---|---|---|---|
| Day 100 | 44 | 0.09 | 2 |
| Day 180 | 34 | 0.75 | 2 |
| Day 360 | 5 | 0.97 | 6 |
Author analysis of the constructed case. Model output under stated inputs; not an observed result. Spearman rank correlation across 54 packages; overlap of the ten highest at each date with the ten highest in net cash.
18 Separate constructed effect benchmarks from observational estimators
The cohort experiment generates constructed deals with complexity, finance-function quality and customer-concentration scores. Four binary indicators map to A0/A1, B0/B1, C2/C1 and D0/D1, giving 16 possible combinations. The cohort omits A2, separate-ledger C0 and consolidation D2; its systems contrast is early C1 against gated C2. Authored assignment probabilities depend on the scores: early cutover is more likely with higher finance quality and lower complexity, and retention awards with lower finance quality and higher complexity. Each outcome is computed from the same ledger with deal-specific parameters. In a 20,000-deal constructed sample under the chosen-assignment law, the paired marginal-toggle benchmarks are USD 5.97 million for pricing alignment, 1.53 for supplier terms, -0.09 for early cutover and 0.26 for retention. Each toggles the named choice while holding that deal's other assigned choices and common draws fixed. These finite computational benchmarks represent the stated synthetic assignment law.
In equation 4, Y is constructed net twelve-period cash with authored accounting noise. T records the simulated choices, X the characteristics, and epsilon the residual in a working regression. In 4b, mu-hat(j,z) is the sample mean of Y among observations with T_j=z, with both groups nonempty. The joint model includes the four choices without X; the observed-control version adds noisy proxies and concentration. The all-characteristics version uses the modeled characteristics directly. These additive projections remain subject to nonlinearities, interactions and heterogeneous effects in the data-generating mechanism.
Table 10 reports bias from 400 replications of cohorts of 160 deals. A naive comparison of means overstates the pricing effect by USD 0.62 million and the supplier effect by USD 0.42 million, makes early cutover look beneficial by an average estimate of USD 0.65 million when its true effect is -0.09, and gives retention an average estimated effect of -0.33 against a true 0.26, with the wrong sign in 70% of replications. Regression on the four choices without controls leaves bias of USD 0.55 million for pricing. Adding observed controls reduces the bias to 0.15, 0.09, 0.12 and -0.07, and the average coverage of nominal 90 per cent intervals across the four choices rises from 68% for the naive difference to 88%.
Figure 5 shows the bias by choice and estimator. The shares of deals that make each choice in the constructed population are 45% for pricing alignment, 44% for supplier extension, 44% for early cutover and 43% for retention. The four choices together explain 0.74 of the variation in net first-year cash and the characteristics add little more, to 0.77, because the large authored pricing effect dominates. In this experiment, relative precision differs with the assigned effect sizes and the rest of the data-generating design.
The adjusted and true-characteristic regressions remain restricted statistical specifications of a nonlinear, interacting ledger. Differences from the constructed average-effect benchmark can reflect covariate measurement, selection, functional-form restrictions and effect heterogeneity. Giving a regression the true characteristic values does not supply all relevant nonlinearities or interactions. The random-assignment experiment is a separate benchmark with its own assignment distribution; its estimates should be compared with the corresponding random-assignment effect, rather than with an effect defined under a different distribution of the other choices.
| Choice | 20,000-deal constructed contrast benchmark | Bias: naive | Bias: joint, no controls | Bias: observed controls | Bias: all characteristics | Random-assignment bias versus its own benchmark |
|---|---|---|---|---|---|---|
| Pricing aligned (A1 versus A0) | 5.97 | 0.62 | 0.55 | 0.15 | 0.06 | 0.01 |
| Supplier terms extended (B1 versus B0) | 1.53 | 0.42 | 0.16 | 0.09 | 0.03 | 0.06 |
| Early cutover (C1 versus C2) | -0.09 | 0.74 | 0.22 | 0.12 | 0.02 | -0.03 |
| Retention awards (D1 versus D0) | 0.26 | -0.58 | -0.16 | -0.07 | 0.02 | 0.03 |
Author analysis of the constructed case. Model output under stated inputs; not an observed result. USD million; bias is the mean estimate less its corresponding 20,000-deal constructed marginal-toggle benchmark. The random-assignment cohort uses its own benchmark under its different co-treatment distribution.
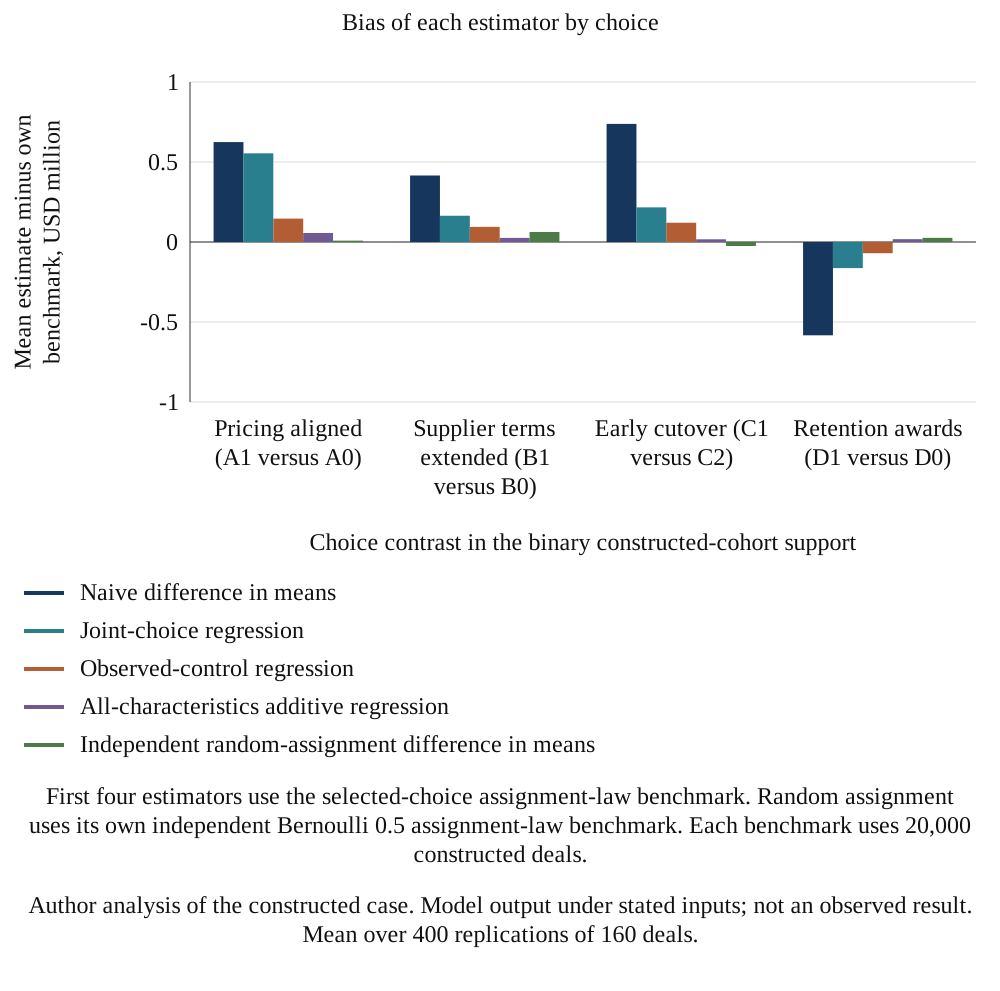
Author analysis of the constructed case. Model output under stated inputs; not an observed result. Mean over 400 replications of 160 deals.
19 Interpret interval precision within the constructed sample-size grid
Table 11 shows how the adjusted estimator behaves as the cohort grows. Averaged over the four choices, the mean absolute error is USD 0.57 million at 40 deals, 0.30 at 160 and 0.13 at 1,280, and the half-width of a 90 per cent interval is 0.56 at 160 deals and 0.20 at 1,280. The pricing effect is large, and the correct sign is found in 100% of replications even at 40 deals. For supplier terms it is found in 99%.
The retention benchmark is USD 0.26 million. The adjusted estimator has the correct sign in 58% of replications at 40 deals, 74% at 160 and 96% at 1,280. Its mean nominal 90 per cent interval half-width is 0.27 million at 640 deals and 0.19 at 1,280. Comparison using unrounded values first falls below the absolute retention benchmark at the tested 1,280-deal point; the grid does not locate the crossing between 640 and 1,280. The naive average correct-sign rate over A, B and D is 76% at 40 deals and 68% at 1,280. Those finite simulations illustrate persistent error under the authored selection mechanism. Identification in an observed study requires a suitable design and explicit assumptions beyond increasing sample size.
Figure 6 separates the two precision series. One panel shows mean absolute estimation error averaged across all four choices. The other shows the retention-specific mean nominal 90 per cent interval half-width and the absolute 20,000-deal constructed retention contrast. The latter is approximately USD 0.256 million. Its mean half-width is approximately 0.267 million at 640 deals and 0.188 million at 1,280. The first tested grid point below the benchmark is 1,280; the threshold between the tested points is not located. This is a conditional precision diagnostic, not a power calculation.
The cohort-size results apply to this authored population, its treatment frequencies, noise, confounding and estimator. They do not establish a minimum number of acquisitions for a real firm's archive, or show that pricing and supplier effects are large in practice. A proposed study should assess precision using its own pilot variance, effect of interest, assignment units, overlap, clustering and missing-outcome pattern before treating any effect as resolved. Its logs can also document mechanisms when a causal estimate remains imprecise.
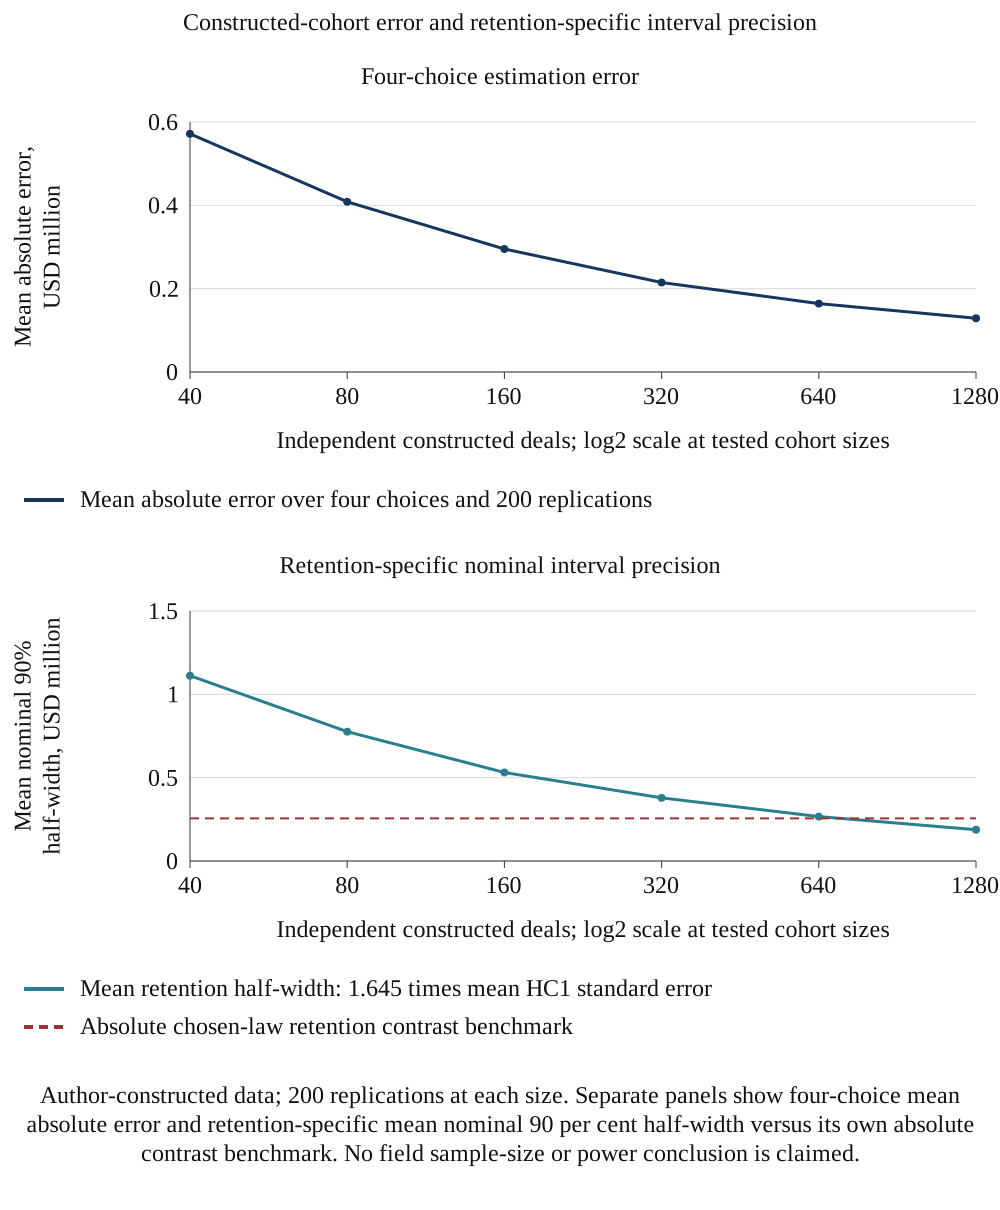
Author-constructed data; 200 replications at each size. Separate panels show four-choice mean absolute error and retention-specific mean nominal 90 per cent half-width versus its own absolute contrast benchmark. No field sample-size or power conclusion is claimed.
| Deals | Mean absolute error across four effects, USD million | Mean 90% interval half-width across four effects | Mean correct sign: A, B, D; adjusted | Mean correct sign: A, B, D; naive | Correct sign, supplier terms | Correct sign, retention |
|---|---|---|---|---|---|---|
| 40 | 0.57 | 1.15 | 86% | 76% | 99% | 58% |
| 80 | 0.41 | 0.81 | 89% | 78% | 100% | 66% |
| 160 | 0.30 | 0.56 | 91% | 79% | 100% | 74% |
| 320 | 0.21 | 0.39 | 93% | 74% | 100% | 80% |
| 640 | 0.16 | 0.28 | 95% | 70% | 100% | 84% |
| 1280 | 0.13 | 0.20 | 98% | 68% | 100% | 96% |
Author analysis of the constructed case. Model output under stated inputs; not an observed result. USD million. Mean absolute error and half-width are averaged over the four choices; the retention half-width is given in the text. Correct-sign rates for supplier terms and retention; the three-choice average uses pricing, supplier terms and retention, excluding cutover.
20 Reconcile operational cash with accounting and balance-sheet movements
Table 12 illustrates measurement differences at the model's phase-zero day 180 point. The uniform-package NWC release against the comparator is USD 1.24 million, while the opening-to-later balance comparison reads -0.06. The approximately USD 1.30 million comparator absorption at this endpoint comes from growth: the seasonal sine is zero at both reported endpoints under the base phase. Seasonal effects remain relevant at other dates and in randomly phased constructed cohorts. Neither opening-to-later balance movement isolates an intervention by itself.
The measurement comparison adds a separate authored opening-basis adjustment. Suppose acquired receivables are initially below their contractual balance by a share of 2%, reducing the opening amount by USD 0.82 million. Holding the later ledger path fixed, that comparator adjustment alone makes the before-and-after reading USD 0.87 million of cash absorbed. AASB 3 explains why acquisition-date fair value incorporates uncertainty about cash flows, but it does not prescribe this percentage or equate fair value to contractual value less a fixed expected-credit-loss discount [1]. This is a modelled comparison of opening bases, not an observed cash flow or a model of subsequent credit losses and collection performance.
In equation 5, the first term is the modeled release and the bracket is the comparator's opening balance less its balance at t. The sign of this drift depends on growth, seasonality and measurement date. At the reported phase-zero day 180 point, the seasonal endpoint component is zero and growth makes the bracket negative. Rho is the authored opening-receivables basis adjustment and AR_0 the opening amount; equation 5b applies that adjustment to the before-and-after comparison. The ledger satisfies equation 5a to numerical precision.
One proposed comparator uses the target's pre-deal monthly balances and transaction records, with documented adjustments for growth and seasonality, alongside days measures with consistent denominators. Its credibility must be assessed; scaling a prior-year balance alone does not identify a decision's effect. The accounting reconciliation should identify provisional and final acquisition-date amounts separately. Where initial accounting is incomplete, measurement-period adjustments concern new information about acquisition-date circumstances and end when the required information is obtained or no longer obtainable, with a one-year maximum [1].
| Measure at day 180, uniform plan | USD million | What it contains |
|---|---|---|
| Like-for-like release against the status quo path | 1.24 | Package mechanisms against the assumed steady-capacity path |
| Before and after change in working capital | -0.06 | Package mechanisms plus growth drift at this phase-zero date |
| Drift contained in the before and after change | -1.30 | Growth drift; zero seasonal endpoint component at this phase-zero date |
| Opening receivables fair-value reset at 2% | -0.82 | Acquisition accounting, no cash |
| Before and after change after the reset | -0.87 | Package mechanisms, growth drift and reset |
Author analysis of the constructed case. Model output under stated inputs; not an observed result. USD million; mean over replications.
An operational reconciliation should connect the opening contractual receivables, acquisition-accounting adjustments, subsequent billing, credit notes, write-offs, cash application and closing balance. Each bridge item needs a source record and a defined cash or non-cash classification. A lower reported receivable balance can result from collection, a valuation adjustment, a disposal or a reclassification. Treating every decline as collection would mix unlike events. The proposed ledger keeps its accounting illustration separate from the operational intervention mechanism for this reason.
Extending the design to several currencies or legal entities requires further bridges that the numerical case does not implement. A study would need a consistent exchange-rate convention, an entity perimeter and a treatment of intercompany balances. It would also separate a supplier being paid by the acquirer from a supplier being paid by a finance provider. Those choices affect the interpretation of a balance movement and the availability of cash to service obligations. They belong in the measurement specification before a dashboard ranks teams or transactions.
21 A proposed study uses dated logs, a stated comparator, lawful data access and possible randomised timing
A study that could answer this paper's question would take the transaction as its unit and record, for each deal, the date and content of each early choice: terms notices sent, supplier letters issued, billing and payables cutover dates, retention offers and team moves. It would record monthly receivables, inventory and payables by customer segment for 24 months before and 12 months after completion, so that a status quo path can be built, and it would record each deal's complexity, concentration and finance quality before any choice is made. Table 13 lists the records.
A proposed completion register should cover all signed deals and record completion, non-completion, reversal and later operating failures. An outcome measured from completion needs a separately stated completion-eligible cohort; uncompleted deals cannot simply be assigned a post-completion outcome. Subsequent integration failures and missing outcomes should remain visible, including records with poor results. Data collection also needs appropriate commercial-access and confidentiality permissions. Where UAE Federal Decree-Law No. 45 of 2021 applies, Article 4 permits processing without consent only under specified exceptions; the contract exception concerns processing necessary for a contract to which the data subject is a party or steps requested by that person to enter into, amend or end a contract [13]. An acquisition agreement does not automatically authorise research use of all customer or staff data. When consent is the basis, Article 6 requires evidence, clarity and accessible withdrawal. Article 2 excludes, among other categories, personal health and banking or credit data governed by specific legislation, and free-zone entities with their own personal-data law. Current implementing requirements and the applicable regime must be confirmed for the study.
Randomised timing is a proposed option where operationally and legally acceptable. An acquirer with comparable units could consider assigning cutover timing or supplier-notice waves by lot, with the independent assignment unit, spillovers, capacity constraints, adherence and missing outcomes specified in advance. Valid assignment and analysis can support a causal comparison for the eligible population; the constructed randomised column shows performance only under its stated design. LaLonde's training-programme abstract supplies a contextual warning that nonexperimental estimators can miss an experimental benchmark [12]. It does not establish the feasibility of randomisation or the adequacy of any estimator in an acquisition. The proposed protocol states outcomes at day 100, 180 and 360 and net first-year cash, with uncertainty intervals. Proposed data and AI tools may assist invoice extraction, risk scoring and payment matching; those tasks require separate accuracy tests, appropriate permissions and dated records, and do not themselves validate a causal interpretation.
| Record | Fields | Purpose |
|---|---|---|
| Choice log | Date, scope and owner of each terms notice, cutover, retention offer and team move | Defines treatment and timing |
| Balance series | Monthly receivables, inventory and payables by segment, 24 months before to 12 after | Builds the status quo path |
| Deal characteristics | Complexity, customer concentration, finance quality, closing month | Controls for selection |
| Customer and supplier response | Acceptance, disputes, losses, shock events | Measures mechanisms |
| Costs | One-off costs, savings, contribution by month | Net first-year cash |
| Completion and follow-up register | All signed deals; completion eligibility, non-completion, reversal, later failures and missing outcomes | Documents selection and follow-up; does not create outcomes for non-completers |
| Data access and lawful basis | Commercial/confidentiality permissions; applicable personal-data regime and processing basis | Documents authority and conditions for proposed use [13] |
MatchPoint proposal for the evidence design. Framework table; no model output.
The primary outcome dataset should preserve invoice-level or controlled aggregate provenance. At minimum, a balance observation needs an entity, period, counterparty identifier, currency, source-system identifier and extraction timestamp. A choice record needs its owner, approval, actual execution date, covered population and exception reason. A linkage table should explain how identifiers changed through the merger. Without that linkage, a migrated account can appear to disappear and reappear as an apparent cash improvement or deterioration.
Missing records require an explicit treatment. A failed extraction is not a zero balance. An unrecorded policy date is not evidence that no policy changed. A disputed invoice is not automatically bad debt, and a late payment is not automatically a refusal of new terms. The proposed protocol would retain a missingness category and reconciliation status for each observation, together with the reason and correction history. Analyses would disclose which exclusions alter the cohort or the covered balance, rather than presenting a cleaned total without its denominator.
The target estimand should be written before the comparison is calculated. A study might ask for the average effect of offering a new policy to an eligible population, the effect among units actually exposed, or the result of a complete sequencing rule. Those are different questions. Exceptions and refusals can be outcomes of the policy itself. Conditioning on them after treatment can change the comparison. A dated eligibility and assignment record makes the intended question visible and gives an independent reviewer a basis for checking whether the reported estimate answers it.
Seasonality and other contemporaneous changes need their own record. A sales promotion, inventory build, supplier disruption, disposal or tax payment can coincide with a systems move. The study design should specify which events enter the operating baseline, which are separate exposures and which make a comparison unsuitable. Adding more explanatory columns after seeing the result does not by itself resolve selection. A pre-specified analysis, a documented change log and sensitivity to alternative defensible specifications make the evidential limits clearer.
Commercial confidentiality and personal-data controls should be operational rather than a statement of intent. The proposed research workspace would separate identifying keys from analysis records, restrict access by role, retain access logs and define deletion or retention responsibilities. A data-sharing agreement would identify the permitted purpose and recipient. The applicable legal review must determine the lawful basis and any transfer or sector restrictions for the actual dataset and jurisdictions. This proposed governance arrangement supplies no universal conclusion that consent alone permits the work.
An external evidence claim should identify the material actually inspected. Reading an abstract supports a narrower account than reproducing a paper's full method and results. A company filing records the company's explanation or forecast, with its stated qualifications. A constructed experiment provides results generated by its own rules. The proposed evidence register would keep those categories beside each numerical or causal claim and record the source version and locator. That practice makes a later factual update traceable without rewriting the history of what was reviewed.
22 Set decision gates with measured exposure and accountable owners
A board report should identify each choice, its date, the expected incremental cash path and the separately available buffer. In the constructed case, the uniform package has a mean pathwise monthly minimum of negative USD 11.5 million and a sample fifth-percentile minimum of negative 17.16 million under the stated payment timing. Its mean net first-year cash is 7.18 million and its day 360 NWC release is 11.3 million. Reporting these measures separately makes their balance, contribution and cost components visible.
The report should also state the status of the evidence. The effect sizes for customer acceptance, disputes, staff loss and supplier response are authored in this paper and, in a real deal, would be estimates from the target's own logs, with ranges. The report should say which choices are large enough to be resolved by the data available and which are not, in line with the sample size results. A target set for cash at day 100 should be replaced by dated gates with the expected trough: month 2, month 4 and day 100 in the constructed case.
A one-page dashboard should carry five lines: working capital against the status quo path by month, the trough and its date, net first-year cash, customer and supplier response against plan, and staff loss in the collections, payables and planning teams. Each line should show its expected range and the date of the next gate. A line that has left its range is a trigger for the decision, such as pausing a cutover or reversing a supplier letter, not a point for discussion at quarter end.
Financial-statement reporting follows the entity's applicable framework and reporting period. Entities subject to the relevant supplier-finance disclosure requirements report the terms and liability information specified there, including the type and effect of applicable non-cash changes such as business combinations [2]. Under the acquisition method, ordinary acquired receivables are measured at acquisition-date fair value; a measurement period is relevant where initial accounting remains incomplete and only within the standard's conditions [1]. The proposed management pack should reconcile its counterfactual working-capital measure with those financial-statement amounts.
A gate should specify an observation, a threshold, a decision owner and an available action. For a billing move, the observation might be reconciled invoice completeness and the aged unresolved queue for the covered population. The available action might be a controlled hold on the next migration wave while the current queue is corrected. The threshold would be a transaction-specific management choice supported by the operating baseline. This paper proposes the gate structure; it does not supply an observed universal tolerance or a validated cutover date.
Cash gates also require an escalation route. Treasury should know which assumptions have changed, which payments remain committed and whether additional capacity is legally and practically accessible. The integration owner should know which actions can be reversed and which are already binding on customers, suppliers or employees. A stop decision without an executable fallback has limited operational content. The proposed control record therefore includes the fallback, the party authorised to invoke it and the source evidence required to restart the activity.
The decision pack should make uncertainty legible. An expected path, a pathwise adverse quantile and an estimated breach frequency answer different questions. The selected threshold should be tied to a stated appetite for that modeled exposure and to separately assessed liquidity. A reader should also see which uncertainty the simulation represents and which it omits. Increasing the number of replications reduces simulation noise; it does not validate the assumed customer behaviour, remove parameter uncertainty or establish that the real target follows the constructed ledger.
A compact responsibility matrix can make the proposed process auditable. The deal CFO owns the integrated financial interpretation, treasury owns available buffer and funding constraints, and the relevant commercial, systems and people owners supply the execution evidence for their choices. Legal and privacy reviewers determine the applicable boundaries for the actual arrangement. This is a proposed allocation of responsibilities that an acquirer would adapt to its governance; it is not a description of roles observed in a client mandate.
| Decision | Accountable owner | Evidence for the gate | Available response |
|---|---|---|---|
| Available incremental buffer | Treasury with deal CFO | Baseline liquidity, restrictions and committed obligations | Revise sequence or secure authorised capacity |
| Customer and supplier terms | Commercial owner with legal review | Executed scope, acceptance, disputes and cash application | Pause the next notice wave or revise eligible scope |
| Billing and payables cutover | Systems and finance-operations owners | Reconciled balances, identifier mapping and exception queue | Hold a migration wave and correct the defined exceptions |
| Critical finance-team continuity | People owner with operating finance | Role coverage, handover evidence and authorised commitments | Adapt retention or transition arrangements |
| Research and data use | Designated data owner with legal/privacy review | Purpose, access authority, lawful basis and source provenance | Restrict, correct or suspend the affected analysis |
Author-proposed governance design. Responsibilities and thresholds require adaptation to the actual acquirer; no client implementation or observed effect is claimed.
23 Choose packages under a tested incremental-buffer constraint
A proposed application begins by reconciling the operating baseline and the separately available incremental buffer. It then defines the modeled payment timing, the summary measure and the permitted downside exposure before choosing a package. The author-selected H=USD 3.0 million is an illustration. The target's actual funding, restricted cash, commitments and operational constraints require independent assessment. Critical-role continuity and cutover timing should enter the comparison as evidence-supported mechanisms for that target, with an available fallback for each decision.
The constructed case shows why those definitions matter. Package A1 B0 C0 D1 meets the mean-minimum screen, with net cash USD 2.22 million and mean pathwise minimum negative 2.7. Its 29.5% sample breach frequency fails the additional illustrative 5 per cent condition. No other evaluated package passes that condition. The decision record should therefore report an infeasible evaluated design under the stated downside rule. Additional buffer, different cost timing or a different operational design would require a new, explicitly tested case; the threshold should not be silently increased to manufacture a preferred answer.
Two cautions apply. Customer terms are bounded by the law of the relevant jurisdiction and by the bargaining power of the largest customers [3, 10], and supplier extension carries a shock risk that in the model reverses a stated share of the extension where it occurs. A plan that relies on either should name the customers and suppliers concerned and set a fall-back before the letters are sent.
AI-assisted document and data processing can be evaluated as an optional component of this proposed workflow. A candidate system would extract invoice identifiers, dates and contractual terms into a review queue, retaining the original document and a locator for each field. A human reviewer would adjudicate a representative test set before the extracted fields were used in a cash measure. The evaluation would report field errors and reconciliation failures for the actual covered population. This paper claims no tested accuracy, time saving or production deployment for such a system.
A proposed early-warning score should be evaluated using information available at the decision time. A model that uses a later payment outcome or a corrected post-cutover record as an earlier feature can give a misleading account of what the team could have known. The study would freeze feature timestamps, record manual overrides and compare the resulting queue with a documented alternative. A predictive ranking of collection risk does not by itself identify the cash effect of changing payment terms or retaining an employee.
Automation should preserve the decision boundary. A proposed assistant may assemble a reconciliation, surface conflicting terms or prepare a draft explanation for review. Changes to customer terms, bank details, supplier instructions or retention commitments require the relevant authorised control process. The research record should identify which output was proposed, which was approved and which was executed. If a system changes how work is assigned, that assignment process also becomes part of the evidence needed to interpret the resulting cash outcomes.
24 Reproduce the model and state the remaining evidence limits
Table 15 states numerical controls for balance components, terminal cash, path statistics, order-averaged attribution, measurement identities and cohort definitions. All 216,000 implementation-adjusted path endpoints reconcile to net twelve-period cash within 1e-11 million. Mean pathwise minimum, minimum mean path, pathwise fifth percentile and buffer-breach share are separately defined and evaluated. The near-zero-capacity-loss control uses an explicit approximation and tolerance. These checks assess the stated mathematical ledger and conditional simulation definitions; field calibration and observed causal effects require separate evidence.
The limits are substantial. Every input is authored: the acceptance share, the dispute and loss probabilities, the capacity effects and the costs. The business has one product line, one currency and one set of terms. Customers and suppliers are treated as shares, not as named counterparties. There is no credit insurance, financing cost or tax. The cohort is generated from the same ledger it analyses, and its confounding structure is chosen. The experiment cannot tell a reader whether any early choice moves cash in a real acquisition. It can tell which patterns of evidence would and would not support such a claim.
The next decision is whether to collect the records in Table 13 for a series of deals and to randomise the timing of at least one choice. Until then, the framework supports ranking choices by mechanism, sizing the trough, and refusing to read a before-and-after balance sheet as evidence.
| Scientific control | Checked scope | Result |
|---|---|---|
| Balance components | At month 12, receivable release plus inventory release plus payable contribution equals NWC release for all 54 packages and 4,000 draws | Reconciles within numerical tolerance |
| Terminal incremental cash | All 216,000 path endpoints equal the defined net twelve-period ledger within 1e-11 million | Reconciles |
| Distinct path summaries | Mean pathwise minimum, minimum mean path, fifth percentile and breach share are separately calculated; mean minimum does not exceed minimum mean path | Definitions and inequality checked |
| Order-averaged attribution | 24-ordering allocations sum to the uniform-minus-no-action difference for day 100 NWC, day 360 NWC, net12 and mean cash minimum | Efficiency identities checked |
| Measurement decomposition | Before-and-after NWC movement equals release plus comparator drift at the selected endpoint | Identity checked within 1e-9 million |
| Cohort and precision definitions | Chosen and random assignments use their corresponding constructed benchmarks; retention comparison uses unrounded half-widths at six sizes | Conditional definitions reconciled |
| Near-zero-capacity-loss approximation | Scale 1e-4 gives mean NWC release with magnitude below 0.01 million in the no-action check | Approximation; no exact zero-loss identity claimed |
Author-constructed numerical controls. Balance and attribution identities, sampled path summaries and conditional cohort diagnostics assess different properties. All quantities use the authored ledger; no field calibration or liquidity assurance follows from these checks.
A reproducible package should retain the source revision, numerical inputs, random seeds, dependency versions and raw arrays used in each displayed table and figure. Display rounding is a presentation step. A feasibility threshold or interval crossing should be evaluated from unrounded quantities, with the displayed result reconciled afterwards. The same distinction applies to a near tie between policy means: the reported decimal precision should not create a stronger ordering than the underlying calculation and its simulation uncertainty support.
The uncertainty represented here is conditional on the authored mechanism and distributions. Parameter uncertainty, dependence between unmodeled events and changes to the business perimeter require additional analysis. One-at-a-time sensitivity varies the stated input while holding the others fixed; it does not explore every joint stress. An acquirer using the framework would therefore document the parameter evidence, plausible dependency structures and stressed operating constraints appropriate to the target before relying on a policy comparison.
For an individual package, the simulated breach share has Monte Carlo variation even when the parameters are fixed. With 4,000 independent draws and a share of 29.5 per cent, the binomial Monte Carlo standard error is approximately 0.72 percentage points. This describes precision of the simulation frequency under its own distribution. Input means, dependence assumptions, omitted shocks and the actual target's liquidity position require separate evidence. The 54 packages share parameter draws, so their estimated statistics are dependent. Paired comparisons should retain those shared draws; the 54 means are constructed policy comparisons rather than independent field observations.
The appropriate output is a decision record that can be revised when evidence changes. It should preserve the previous assumption, the new observation, the resulting calculation and the reason for the chosen action. A positive modeled year-end result cannot replace a reconciled cash record or an available funding commitment. The contribution of this paper is the explicit link between choice definitions, cash measurement, evidence limits and accountable decisions. Real transaction effects require the separately designed and governed empirical study.
References
- Australian Accounting Standards Board. AASB 3 Business Combinations, December 2022 compilation applicable to annual periods beginning on or after 1 July 2026 but before 1 January 2027, paragraphs 2-3, 18-21, 45-49 and B41. Australian Tier 1 for-profit correspondence with IFRS 3; entity and period applicability require confirmation. https://standards.aasb.gov.au/aasb-3-dec-2022-0
- Australian Accounting Standards Board. AASB 2023-1 Amendments to Australian Accounting Standards: Supplier Finance Arrangements, 22 June 2023, adding AASB 107 paragraphs 44F-44H, effective for annual periods beginning on or after 1 January 2024. Current AASB 107 compilation applicable from 1 January 2026, paragraphs 44F-44H, 62-63 and Appendix A AusA1. https://www.aasb.gov.au/admin/file/content105/c9/AASB2023-1_06-23.pdf ; https://www.legislation.gov.au/F2015L01538/2025-12-31/2025-12-31/text/original/epub/OEBPS/document_1/document_1.html
- European Parliament and Council. Directive 2011/7/EU of 16 February 2011 on combating late payment in commercial transactions (recast), Articles 3, 7 and 12. EUR-Lex marks the directive in force; applicable national implementation requires confirmation. European Parliament, Legislative Observatory, procedure 2023/0323(COD), Commercial transactions: combating late payment, status awaiting Council's first-reading position at 8 November 2026. https://eur-lex.europa.eu/eli/dir/2011/7/oj/eng ; https://oeil.europarl.europa.eu/oeil/en/procedure-file?reference=2023%2F0323%28COD%29
- United Kingdom Parliament. Commercial Payments Bill [HL], Bill 166 of 2026-27, as brought from the House of Lords, 21 October 2026; Commons second-reading stage and not an Act at 8 November 2026. Department for Business and Trade, Commercial Payments Bill: overview, 19 May 2026; written answer to question 33379, 19 October 2026. Proposed measures and implementation remain conditional on legislation and commencement. https://bills.parliament.uk/bills/4128 ; https://publications.parliament.uk/pa/bills/cbill/59-02/0166/260166.pdf ; https://www.gov.uk/government/publications/commercial-payments-bill-factsheets/commercial-payments-bill-overview ; https://questions-statements.parliament.uk/written-questions/detail/2026-10-09/33379 ; https://www.gov.uk/late-commercial-payments-interest-debt-recovery/charging-interest-commercial-debt
- Amedisys, Inc. Form 10-K for the year ended 31 December 2008, Management's Discussion and Analysis, Outstanding Patient Accounts Receivable, p. 49. United States Securities and Exchange Commission, accession 0001193125-09-031143. Historical reported figures and management explanations. https://www.sec.gov/Archives/edgar/data/0000896262/000119312509031143/d10k.htm
- Laboratory Corporation of America Holdings. Form 10-K for the year ended 31 December 1999, filed 17 March 2000, Management's Discussion and Analysis, Liquidity and Capital Resources. United States Securities and Exchange Commission, accession 0000920148-00-000009. Historical reported DSO and management conversion forecast. https://www.sec.gov/Archives/edgar/data/0000920148/000092014800000009/0000920148-00-000009.txt
- Healy, P. M., Palepu, K. G. and Ruback, R. S. (1990). Does Corporate Performance Improve After Mergers? NBER Working Paper 3348, May. The working-paper abstract describes mergers completed from 1979 to 1983. Published journal version: Journal of Financial Economics 31(2), 135-175 (1992), DOI 10.1016/0304-405X(92)90002-F. Contextual discussion uses the earlier working-paper version. https://www.nber.org/papers/w3348
- El Ghoul, S., Gong, Z. and Guedhami, O. (2025). Easing the Squeeze: How Do Acquisitions Relieve Target Firms' Financial Constraints? Research in International Business and Finance 74, 102673. DOI 10.1016/j.ribaf.2024.102673. https://scholar.xjtlu.edu.cn/en/publications/easing-the-squeeze-how-do-acquisitions-relieve-target-firms-finan/
- Kieschnick, R., Laplante, M. and Moussawi, R. (2013). Working Capital Management and Shareholders' Wealth. Review of Finance 17(5), 1827-1852. DOI 10.1093/rof/rfs043. https://ideas.repec.org/a/oup/revfin/v17y2013i5p1827-1852.html
- Fabbri, D. and Klapper, L. F. (2016). Bargaining Power and Trade Credit. Journal of Corporate Finance 41, 66-80. DOI 10.1016/j.jcorpfin.2016.07.001. Accepted manuscript, May 2016, City Research Online; this version may differ from the final publication. https://openaccess.city.ac.uk/id/eprint/17179/
- Cannella, A. A. and Hambrick, D. C. (1993). Effects of Executive Departures on the Performance of Acquired Firms. Strategic Management Journal 14(S1), 137-152. DOI 10.1002/smj.4250140911. https://pure.psu.edu/en/publications/effects-of-executive-departures-on-the-performance-of-acquired-fi/
- LaLonde, R. J. (1986). Evaluating the Econometric Evaluations of Training Programs with Experimental Data. American Economic Review 76(4), 604-620. https://ideas.repec.org/a/aea/aecrev/v76y1986i4p604-20.html
- United Arab Emirates. Federal Decree-Law No. 45 of 2021 Concerning the Protection of Personal Data, Articles 2, 4 and 6. Government-linked Arabic compilation, Dubai Judicial Institute, 2023. Applicable personal-data regime and current implementing requirements require confirmation. https://assets.u.ae/api/public/content/954629a06cc64fd887771ce3273d6154?v=21d88839 ; https://uaelegislation.gov.ae/en/legislations/1972
- Hu, M., Mou, J. and Tuilautala, M. (2020). How Trade Credit Affects Mergers and Acquisitions. International Review of Economics and Finance 67, 1-12. DOI 10.1016/j.iref.2019.12.004. https://ideas.repec.org/a/eee/reveco/v67y2020icp1-12.html
About the Author
Chennakeshav (CK) is a corporate finance and investment banking executive with 25+ years of global experience in deal origination, structuring and execution across M&A, growth capital and corporate strategy. He has led value-creation mandates for founders, corporates and funds — bridging the boardroom view to hands-on execution and close.
His career spans Morgan Stanley, HSBC, Lloyds Banking Group, EWEC, ADQ portfolio companies and Emirates Growth Fund, across TMT, real estate, fintech, deeptech, cleantech, infrastructure and energy. He has partnered with C-suite leaders, private equity and venture funds, sovereign wealth funds and family offices to finance complex fund raises and scale-up ventures, and has led M&A due diligence, post-merger integration and business-transformation initiatives to create value.
At Matchpoint Partners he is Managing Partner, leading the firm's corporate finance, M&A and capital-raising practice. He holds an MBA from London Business School, an engineering degree from VTU and a Master of Laws (LLM, in progress) from UCL London.
An active start-up mentor, CK mentors at Techstars, DIFC FinTech Hive, Startup Grind, Founder Institute and IN5, serves as Entrepreneur Mentor in Residence (EMiR) at London Business School, and judges the Entrepreneurship World Cup.
https://www.linkedin.com/in/ckadya/
https://www.matchpoint-partners.com/team/ck-adya.html
Disclaimer
This paper is part of a continuing series on the structure of private and alternative markets. The views expressed are the author's own. The paper is for information only, describes market structure in general terms, and does not constitute investment, legal, tax or regulatory advice or a recommendation in respect of any security, vehicle or counterparty.
